Abstract
The machine industry has undergone several developments in the past years, and reducing the cost and time required for machine designing is important. In this study, the vibration characteristics of a precision grinding machine were obtained through experimental modal analysis and finite element analysis. The experimental modal analysis employed single point excitation, and the equipment used to determine the frequency response of the grinding machine comprised a hammer, an accelerometer, and a spectrum analyzer. In addition, the resonance frequency, damping factor, and modal shape of the grinding machine were determined. The natural frequency, modal shape, and interface stiffness were determined through finite element analysis. Finally, the theoretical model and the experimental modal analysis models were compared, and get closer to the actual situation of a model to conduct several times analysis. Thus, this paper presents a reliable and convenient method to study the characteristics of machine tools; this method can reduce unnecessary costs and find structural weaknesses in machine designs for improvement.
1. Introduction
At present, three types of dynamic structural analysis techniques are known: the distributed-mass beam method [1], the lumped-constant beam method [2], and the finite element method [3]. In this paper, the dynamic characteristics of machine tools were studied through the finite element method. Moreover, the material properties, geometric properties, and boundary conditions were obtained.
Zhang [4] proposed computer-aided engineering to predict the dynamic behavior of machine tool structures. The dynamic flexible method was used for this purpose, and the experimental results presented the basic dynamic characteristics of a unit area. Sahoo [5] investigated the transient characteristics of the composite material layer plates, which included static properties, free deflection vibration, and natural frequency. These findings were confirmed by comparing them with the experimental results in the present study. Kono [6] used the contact stiffness model to establish the mathematical relationship between the load and rigidity of the fixed structure. The experiment results suggested that the proposed method can improve the rigidity of the machine support.
The structural system was subjected to an external force to produce a reciprocating movement in the reference direction. The structural system exhibited different frequency and amplitude under different operating conditions. In general, vibration is an undesirable characteristic of a structure; however, the vibration characteristics can be used for structural testing of a machine. Vibration can be classified into two types: First, free vibration is generated by the natural frequency of a structural system without an external force. Because the initial displacement and initial velocity of the system can periodically change its kinetic energy, the system performs repetitive motions. Second, forced vibration is produced from the frequency of an external force. The system movement is then applied to a dynamic external load.
The vibration can be described as a set of modal parameters, which include natural frequency, mode shape, and damping. The natural frequency is an important component of the resonance effect. If the external excitation frequency is the same as that of the structure, a resonance effect can result. The modal analysis can be classified into experimental modal analysis and theoretical modal analysis.
2. Experimental modal analysis
2.1. Experimental modal analysis theory
For a damped mechanical member during resilient movement, the discrete component can be expressed as a linear differential equation as shown in Eq. (1) [7]:
where [M] is the mass matrix, [C] is the damping matrix, [K] is the stiffness matrix, {¨x(t)} is the acceleration vector, {˙x(t)} is the velocity vector, {x(t)} is the displacement vector, and {F(t)} is the force vector.
By applying a Laplace transform, the linear differential equation is transformed from the real domain to Laplace domain. The Laplace domain equation is shown in Eq. (2):
where {X(s)} is the displacement of the Laplace transform, {F(s)} is the force vector of the Laplace transform, {x(0)} is the initial displacement vector, {v(0)} is the initial velocity vector, and s is the Laplace variable.
If the Laplace parameter s is replaced by jω, the frequency information can be obtained as follows:
(1) Homogeneous solution:
[P(s)]=s2[M]+s[C]+[K] is the system matrix.
If Gk is the solution of the system matrix that makes the determinant of [P(Gk)] equal to zero, then Gk is the eigenvalue. The corresponding eigenvector is called the modal shape. The eigenvalue and eigenvector are given as follows:
where σk is the kth modal damping and ωk is the kth modal frequency.
(2) Particular solution:
The force vector of the linear differential equation is nonzero, and m eigenvectors describe the particular solution of the equation as follows:
where [H(s)] is the transfer matrix.
The determinant of the system matrix [P(s)] is the quadratic function given in Eq. (3):
where G*k is the complex conjugate of Gk. The inverse matrix [H(s)] is shown in Eq. (4):
The denominator of [H(s)] is a quadratic function; by using the remainder theorem, Eq. (4) can be rewritten as follows:
where [rk] is the kth complex matrix and [r*k] is the complex conjugate matrix of [rk].
Eq. (6) expresses [H(s)] in the form of a mode vectors:
where {uk} is the kth modal vector, {uk}* is the complex conjugate of {uk}, {uk}t is the transposed vector of {uk}, and {u*k}t is the transposed vector of {uk*}.
2.2. Experimental modal analysis
Experimental modal analysis is illustrated in Fig. 1. The process can be divided into four stages:
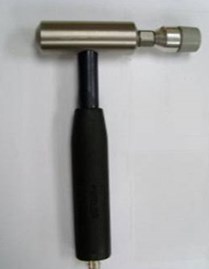
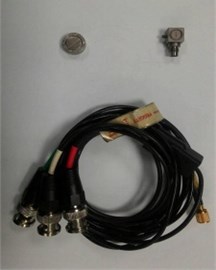
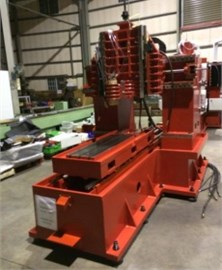
(1) Measuring technology: Appropriate measuring instruments were used to measure the analyte in order to obtain the input and output response. A hammer, an accelerometer, and a spectrum analyzer were used as shown in Fig. 2.
(2) Signal analysis: The resulting input and output signals of the time-domain response signal were used for signal processing, for example, through Fourier transformation. This study used a time-domain input signal and a frequency-domain output signal as shown in Fig. 3.
(3) Curve fitting: Curve fitting techniques were used to obtain the modal parameters of the system as shown in Fig. 4.
(4) Data analysis: Using curve fitting calculate the modal is necessarily all true [8], which through the damping ratio between 1 % and 5 % to obtain correct modal parameters. The natural frequency and modal damping ratio of the machine tools are shown in Table 1.
Fig. 1Experimental modal analysis
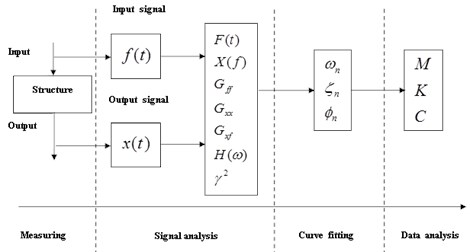
Fig. 2Equipment
a) Hammer
b) Accelerometer

c) Spectrum analyzer
d) Precision grinding machine tools
Fig. 3Tap the signal curve
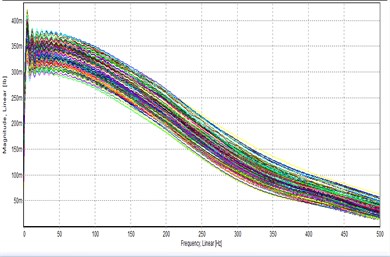
a) Signal curve
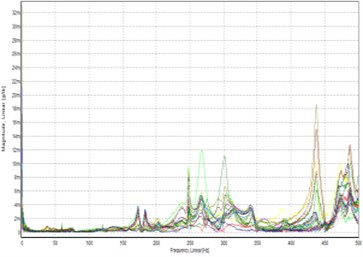
b) Frequency response
Fig. 4Curve fitting
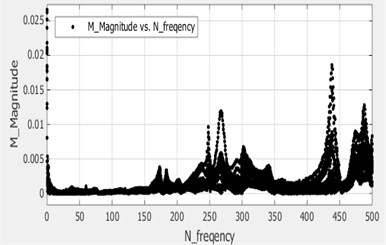
a)
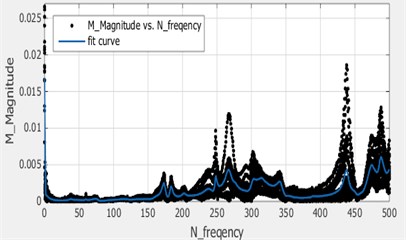
b)
Table 1Natural frequency and modal damping ratio
Mode | Natural frequency | Damping ratio |
Mode 1 | 37.8 | 0.0845 |
Mode 2 | 75.3 | 1.71 |
Mode 3 | 248 | 0.429 |
Mode 4 | 267 | 1.51 |
Mode 5 | 274 | 1 |
Mode 6 | 302 | 0.919 |
Mode 7 | 438 | 0.472 |
3. Finite element analysis
3.1. Finite element modeling and meshing
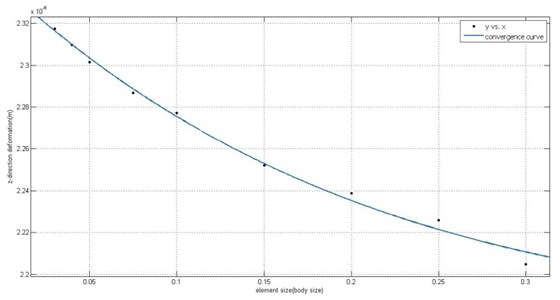
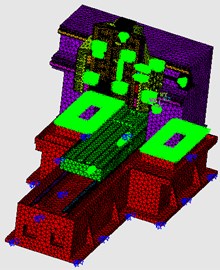
In this study, the machine tool model was prepared from casting drawings. The model included the internal structure and components, omitting the fillets and holes. The entire machine tool model is shown in Fig. 5. This study used the SOLID187 and COMBIN14 elements to simulate contact rigidity. The free mesh function and SOLID187 were used for the machine tool model, and COMBIN14 was used for simulation of contact rigidity. The finite element model is shown in Fig. 6. The convergence curve is shown in Fig. 7. The element mesh size(body size) is 0.05 m and in the circle model element size (body size) is 0.01 m.
Fig. 5Machine tool model
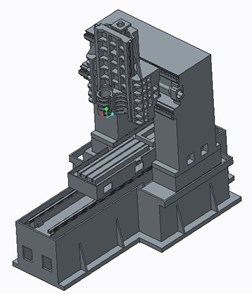
Fig. 6Finite element model
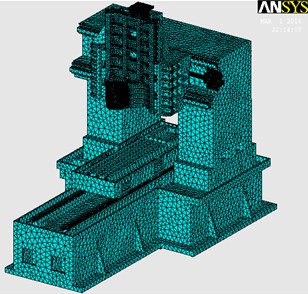
Fig. 7Convergence curve
3.2. Materials and calculation of support rigidity and finite element model planning
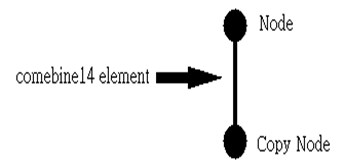
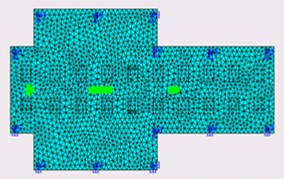
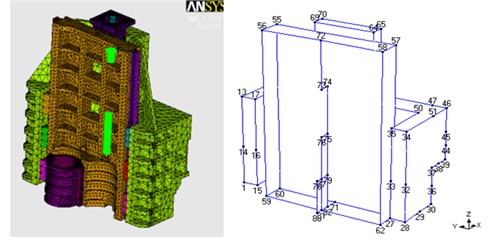
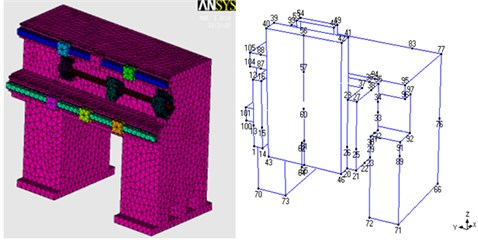
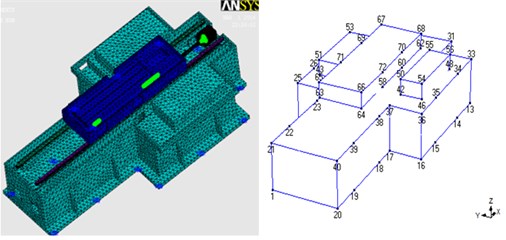
In this study, grey cast iron was used as the material of the model and medium carbon steel was used for the three-axis linear ball screw and linear guideway. The spring constant was obtained through trial and error adjustments of the rigidity of the bottom support of the machine tool, which make setting X, Y, and Z directions. The setting schematic diagram and position are shown in Fig. 8, and the copy node was bound. The subparts of the finite element model are spindle head, column with spindle head, and bottom with workplane, which do not share any nodes. The finite element model subparts and the experimental modal analysis model are shown in Fig. 9. The material properties and support rigidity are given in Table 2.
Fig. 8Setting schematic and support position
a) Setting schematic
b) Support position
Fig. 9Finite element model subparts and experimental modal analysis models
a) Spindle head
b) Column with spindle head
c) Bottom with workplane
Table 2Material properties and support rigidity of machine tools
Material | Density | Young’s modulus | Poisson’s ratio |
Gray cast iron | 7200 kg/m3 | 155 GPa | 0.3 |
Medium carbon steel | 7850 kg/m3 | 210 GPa | 0.3 |
X direction | Y direction | Z direction | |
X direction spring constant | 7.3×10⁷ N/m | 7.3×10⁷ N/m | 7.3×10⁷ N/m |
Y direction spring constant | 1.25×10⁸ N/m | 1.25×10⁸ N/m | 1.25×10⁸ N/m |
Z direction spring constant | 5.95×10⁷ N/m | 5.95×10⁷ N/m | 5.95×10⁷ N/m |
3.3. Contact rigidity calculation
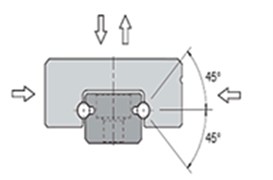
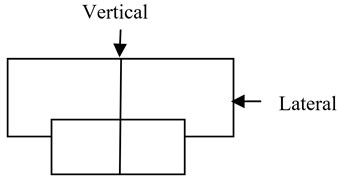
The contact rigidity between the linear guideway and linear slide was obtained from the design catalog. The contact rigidity has only two directions: vertical rigidity and lateral rigidity. The direction of the linear slide withstanding force is shown in Fig. 10. The contact rigidity is given in Table 3.
The linear ball screw nut and support bearing rigidity can be calculated using Eq. (7) [9]:
where KB is the axial rigidity of the support bearing, Fa0 is the withstanding pressure, and δa0 is the axial displacement. The equation for axial displacement is given below:
where Q is the axial load, Da is the diameter of steel ball bearings, and α is the bearing contact angle. The equation for axial load calculation is given in Eq. (9):
where Z is the number of balls. The calculation parameters for the axial rigidity of support bearings can be obtained from the design catalog. In this study, the rigidity of the linear ball screw nut was calculated. Moreover, the linear ball screw prepressed value can be calculated as shown in Eq. (10) [10-12]:
where Tp is the reference torque (kgf·cm), l is the lead, β is the lead angle, and Fa0 is the prepressed value (kgf). The unit length of the calculated prepressed was measured in centimeters. The axial rigidity can be calculated as shown in Eq. (11) [9, 12, 13]:
where Kn is the axial rigidity of the ball screw nut (N/μm), Ca is the basic dynamic load rating (N), K is the original rigidity of the ball screw (N/μm), ε is the basic dynamic load rating coefficient, which was assumed to be 10 % of the dynamic load rating for obtaining the nut axial rigidity.
The linear ball screw was subjected to axial rigidity, and the three-axis nut axial rigidity is shown in Table 4. The axial rigidity of the three-axis support bearing was 980 N/μm.
3.4. Construction of a cylindrical coordinate system and node coupling
In precision grinding, the finite element model of the three-axis linear ball screw was used to establish the respective cylindrical coordinate system to transfer the DOF nodes of COMBIN14. The cylindrical coordinates for each linear ball screw are shown in Fig. 11. The COMBIN14 elements were used to simulate the linear ball screw nut and bearing axial rigidity. Moreover, the COMBIN14 elements were used to choose the r direction of the linear ball screw coupling two nodes DOF. To avoid self-rotation, they are bound by the rotation of the motor so that the elements nodes are coupled in the θ direction at the end of the COMBIN14 elements. The cylindrical coordinates coupling of two nodes DOF; the settings of all linear ball screws are shown in Fig. 12.
The ANSYS modal analysis model was used to solve the ideal model without damping; therefore, the results of ANSYS modal analysis and experimental modal analysis will have some error. In this study, the results of ANSYS modal analysis and ME'SCOPE modal analysis were obtained for only five frequency and mode shapes. The complete settings of the finite element model are shown in Fig. 13.
Fig. 10Direction of linear slide withstanding force
a)
b)
Table 3Contact rigidity between linear guideway and linear slide
Linear Guideway | Type | Vertical rigidity | Lateral rigidity |
X-direction | MSA35R | 305 N/μm | 216 N/μm |
Y-direction | MSR45R | 400 N/μm | 284 N/μm |
Z-direction | MSR45R | 400 N/μm | 284 N/μm |
Table 4Three-axis nuts axial rigidity of linear ball screw
Linear ball screw nuts | Ball diameter | Dynamic load rating | Cycle | Axial rigidity |
X-direction | 6.35 mm | 5190 kgf | 4×1 | 808 N/um |
Y-direction | 3.175 mm | 1980 kgf | 2.5×2 | 560 N/um |
Z-direction | 3.175 mm | 3600 kgf | 2.5×4 | 966 N/um |
Fig. 11Cylindrical coordinates of each linear ball screw
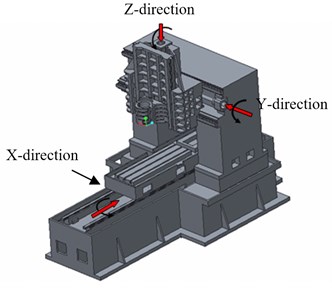
Fig. 12Coupling of cylindrical coordinates and the settings of linear ball screws
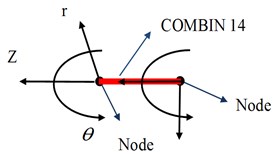
a) Cylindrical coordinates of two DOF nodes

b) Linear ball screws of the model
Fig. 13Complete finite element model
4. Verification of finite element analysis and experimental modal analysis
4.1. Natural frequency value comparison
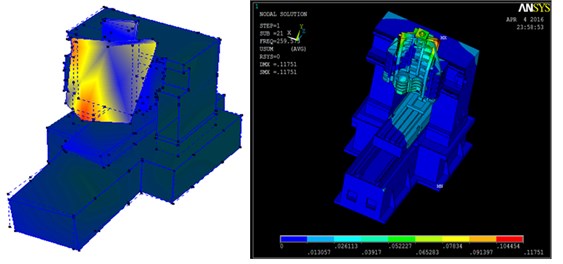
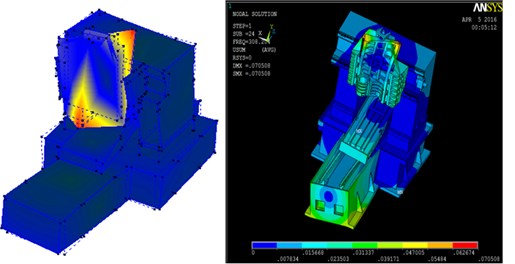
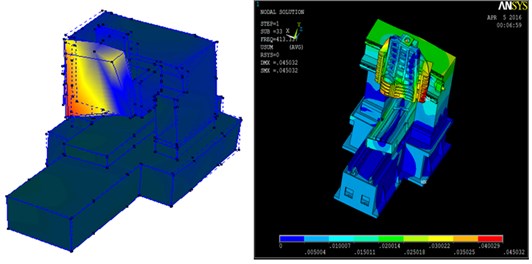
The experimental process was assumed to be free from human error. The dynamic characteristics obtained through the experimental modal analysis were similar to the actual results. The experimental modal analysis results obtained in this study were the contact rigidity set reference. A comparison of the natural frequency of the five groups obtained through experimental modal analysis and finite element analysis is shown in Table 5 and Fig. 14. The error of 1.3 % for the second group was the optimal result obtained.
Fig. 14Natural frequency comparison
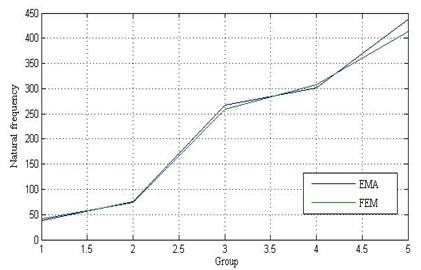
Table 5Compare the natural frequency of the five groups
Model | Experimental modal analysis | Finite element analysis | Error |
First group | 37.5 Hz | 40.6 Hz | 8.2 % |
Second group | 75.6 Hz | 74.6 Hz | 1.3 % |
Third group | 268 Hz | 259.6 Hz | 3.1 % |
Fourth group | 302 Hz | 308.2 Hz | 2.0 % |
Fifth group | 438 Hz | 413.3 Hz | 5.6 % |
The ANSYS finite element model ignores the fillets and the gap between the structures; the ANSYS modal analysis process has no damping, thereby resulting in the error. In the experimental modal analysis, the first group exhibited a low-frequency signal interference because of the size of the hammer.
Fig. 15Five groups of corresponding mode shape
a) Comparison of first group
b) Comparison of second group
c) Comparison of third group
d) Comparison of fourth group
e) Comparison of fifth group
4.2. Comparison of modal shapes
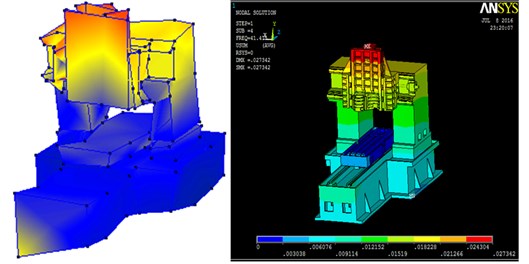
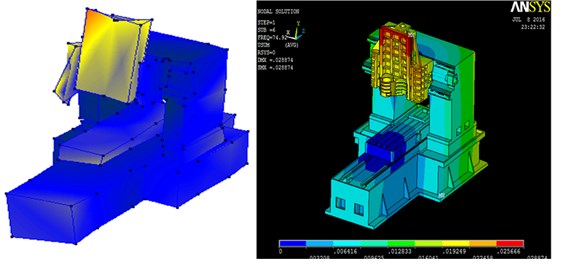
In the experimental modal analysis and finite element analysis, the natural frequency was divided into five groups; because of the size of the hammer, natural frequency error resulted in a signal interference of mode shape in the first group. The five groups corresponding to the natural frequency of mode shape are shown in Fig. 15.
4.3. Analysis of results for a precision grinding machine
In this study, the operating speed of the precision grinding machine was 15.000-26.000 rpm; therefore, model shapes from 250-500 Hz were discussed. For the given operating speed, the spindle head causes larger vibration than do any other structures. The relative movement of the structure is shown in Table 6.
Table 6The relative movement of the structures
Model | EMA Frequency | FEA Frequency | Relative movement of the structure |
First group | 37.5 Hz | 40.6 Hz | The machine tool does back and forth rigid body motion, no relative movement between the structure. |
Second group | 75.6 Hz | 74.6 Hz | The machine tool does left and right rigid body motion, no relative movement between the structure. |
Third group | 268 Hz | 259.6 Hz | The relative movement of the interface is the spindle head and the workplane. |
Fourth group | 302 Hz | 308.2 Hz | The relative movement of the interface is the spindle head, the workplane and the bottom. |
Fifth group | 438 Hz | 413.3 Hz | The relative movement of the interface is the spindle head, the workplane and the vertical column. |
5. Conclusions
In this paper, the vibration characteristics of a precision grinding machine were obtained through experiment modal analysis and finite element analysis. The following conclusions can be drawn from this study: (1) The axial rigidity of the three-axis support bearing was 980 N/μm. (2) The natural frequencies of five groups were compared through experimental modal analysis and finite element analysis. The error of 1.3 % in the second group was the optimal result. (3) The operating speed of the precision grinding machine was 15.000-26.000 rpm; therefore, the model shapes from 250 to 500 Hz were discussed.
References
-
Hijink J. A. W., Van A. C. H. Analysis of a milling machine: computed results versus experimental data. Proceedings of the Fourteenth International Machine Tool Design and Research Conference, 1973, p. 553-558.
-
Taylo S. R., Toias S. A. Lumped-constants method for the prediction of the vibration characteristics of machine tool structures. Proceedings of the Fifth International Machine Tool Design and Research Conference, 1964, p. 37-42.
-
Sato H., Kuroda Y., Sagara M. Development of the FEM for vibration analysis of machine tool structure and its application. Proceedings of the Fourteenth International Machine Tool Design and Research Conference, 1973, p. 545-552.
-
Zhang G. P., Huang Y. M., Shi W. H., Fu W. P. Predicting dynamic behaviours of a whole machine tool structure based on computer-aided engineering. International Journal of Machine Tools and Manufacture, Vol. 43, Issue 7, 2003, p. 699-706.
-
Sahoo S. S., Panda S. K., Mahapatra T. R. Static, free vibration and transient response of laminated composite curved shallow panel – an experimental approach. European Journal of Mechanics – A/Solids, Vol. 59, Issue 1, 2016, p. 95-113.
-
Kono D., Nishio S., Yamaji I. A method for stiffness tuning of machine tool supports considering contact stiffness. International of Machine Tools and Manufacture, Vol. 90, Issue 1, 2015, p. 50-59.
-
Ewins D. J. Modal Testing: Theory and Practice. Imperial College London, 1984.
-
Wang Y. M., Li G. X. The Influence Produced by the Structure of Head and Precise Linear Guideway to the Structural Rigidity of Gantry-Type High-Speed Machining Center. Master Thesis, Department of Mechatronics Engineering, National Changhua University of Education, 2010, (in Taiwan).
-
Rigidity Discussion. THK Corporation, http://tech.thk.com/ct/products/pdf/tc_a15_043.
-
Feng G. H. Investigation of ball screw preload variation based on dynamic modeling of a preload adjustable feed-drive system and spectrum analysis of ball-nuts sensed vibration signals. International Journal of Machine Tools and Manufacture, Vol. 52, Issue 1, 2012, p. 85-96.
-
Ball Screw Technical Information S99TE16-1003. HIWIN Corporation, http://www.hiwin.com.tw/.
-
Ballscrew, Linear Guideway, Mono Stage General Catalog. PMI-Group Corporation, http:www.pmi-amt.com/data/Catolog/Ballscrews/General%20Catalog_TC_BS.
-
Zhou C. G., Feng H. T., Chen Z. T., Ou Y. Correlation between preload and no-load drag torque of ball screws. International Journal of Machine Tools and Manufacture, Vol. 102, Issue 1, 2016, p. 35-40.
About this article
The authors gratefully acknowledge the financial support of the Ministry of Science and Technology of the Republic of China under Grant No. MOST 104-3011-E-018-001.

