Abstract
In current studies, growing up of treatment of the knee joint damage such as arthritis, the research to prevent knee joint is under way. As knee joints could be damaged by various types of motion, one of the most influential factor of the abrasion on the knee joint is progressed by walking. It could be classified as 3 types of walking, 1. Walking plain, 2. Climbing stairs or uphill and 3. Going down. In this study, to find the damaged point of knee joint, the following ways would be used. After comparing the knee joint angle with interior and exterior movement of the knee in accordance with the joint dynamics of typical height, the walking pattern for walking up the stairs can be comprehended. It could be shown the variation of the center of rotation of knee joint. From this, the contact point which is pressed on the knee joints in accordance with each walking pattern could be derived. The numerical modeling could be made by quantifying the variety that is caused by the center of mass of knee bone. It would be expected to calculate the contact point on the knee joint through walking patterns. This numerical model is considered of the kinematics system in our knee.
1. Introduction
In general, arthritis is a chronic disease that appears more frequently with aged people. In addition to the external shock, it is more likely to be exposed to the risk of arthritis from increasing incidence of the joint friction due to increased usage in daily life. Knee is one of the most currently performed part for treatment by arthritis in our body. Arthritis from knee is occurred by not only unexpected shocks but also repetitive walking. Among them, the location of the friction part of the knee joints by gait pattern will be identified in this paper.
The research which is related to knee joint and walking pattern is proceeded with three devices representatively. One of the research is by attaching the electrodes around the knee [1, 2]. The magnitude force that generates from surrounding muscles could be measured by these electrodes. And the position which affects to the joint could be seemed from them. Through this, the knee moment while walking would be verified. Another is to use ground reaction force (GRF) systems [3-9]. By using GRF system, the ground reaction force value could be measured. Also, the moments which is occurred in the knee joint is derived according the gait cycle. The other is the method of using motion capture system [3-5, 10-13]. This serves to measure the variation of the node displacement. And the most similar walking pattern could be identified. However, those are the method of seizing the pattern and would not be a fundamental reason to prevent arthritis.
In this paper, the numerical model would be composed to determine the point of knee abrasion by gait pattern for the fundamental arthritis prevention. In this point, the knee flexion angle will be referred for a reference data (Fig. 1). The model for verification will be used the bone model. By utilizing these, the difference between level walking and climbing stairs would be confirmed. In this case, the contact point between femur and tibia should be identified for checking the abrasion point. The numerical model would be composed to get the contact point in accordance with the gait pattern. This model is considered of the kinematics of knee and the kinetics is not considered. Through this study, the risk of wear position in kinematics of knee model would be determined.
Fig. 1Angle variation during ascent and descent through walking pattern (The unit of angle is ‘°’) [5]
![Angle variation during ascent and descent through walking pattern (The unit of angle is ‘°’) [5]](https://static-01.extrica.com/articles/18889/18889-img1.jpg)
2. Methods
The methods are consisted of three steps. The sequence is shown in Fig. 2. As the first step is to confirm the angle variation between femur and tibia by gait cycle. It would be shown in Fig. 1. Fig. 1 is a graph of the variation of knee flexion angle according to walking pattern. Considerable difference were observed of the knee joint flexion angles during level walking and stair ascent. (Fig. 1) [5] 0 % of cycle time in Fig. 1 means the knee joint are fixed. And it is at the foot contact while walking stairs. Through this figure, it is confirmed that the knee flexion angle in kinematics in our body is affected by the pattern of the angle of walking surface. And a similar patterns are shown as in other studies [2-4, 9, 12]. Based on this, the regression curve was used to reconstruct the level walking and stair ascent.
Fig. 2The flow chart of the methods

The second step is to measure the distance between femur and tibia by using bone model. The outline of the side view could be extracted from the bone model. Through the outline, the distance between the femur and tibia would be measured. The third step is to make the numerical model. The numerical model could be constructed through the measured values. It will be represented the section of the knee.
2.1. Modeling concept
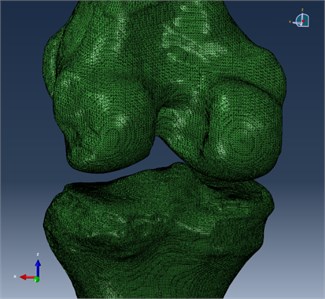
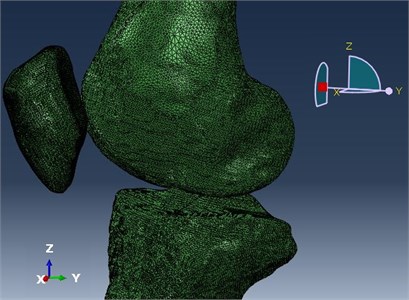
Fig. 3 is a knee bone model which is used in simulation. This bone model was used to utilize the measurement CT data from a general man. The height of used bone model was 174 cm. And the weight is 69 kg. According to the statics, the average height and weight of adult male is 174 cm, 72 kg. 3-D bone model was programmed by using mimics. 3-dimensional model was formed to the threshold function in the program. After this, the surface of bone model was meshed. To pick the outline of a bone, the meshing operation was done. The simulation way of meshing the model and configuring the axis is referred to J. H. Heegaaed et al. [14].
It was to find the distance between the node of the femur and tibia. The distance would be determined a contact position of knee bone. The lower limb knee bones in body structure are consist of femur, tibia and patella. However, for the numerical model, the range of knee bone in this paper was limited to femur and tibia. To find the distance to each node the head of tibia was fixed. On the other hand femur bone is considered of bending and rotation while the angle between femur and tibia changes.
Fig. 3Knee bone model for simulation
a) Knee model in the frontal plane
b) Knee model in the sagittal plane
Fig. 4Knee joint kinematics in the sagittal plane during gait pattern: a) extension: when femur and tibia paired with a straight line, b) early flexion: femur moves posteriorly, c) deep flexion: the angle between femur and the tibia is 90° [15]
![Knee joint kinematics in the sagittal plane during gait pattern: a) extension: when femur and tibia paired with a straight line, b) early flexion: femur moves posteriorly, c) deep flexion: the angle between femur and the tibia is 90° [15]](https://static-01.extrica.com/articles/18889/18889-img5.jpg)
a)
![Knee joint kinematics in the sagittal plane during gait pattern: a) extension: when femur and tibia paired with a straight line, b) early flexion: femur moves posteriorly, c) deep flexion: the angle between femur and the tibia is 90° [15]](https://static-01.extrica.com/articles/18889/18889-img6.jpg)
b)
![Knee joint kinematics in the sagittal plane during gait pattern: a) extension: when femur and tibia paired with a straight line, b) early flexion: femur moves posteriorly, c) deep flexion: the angle between femur and the tibia is 90° [15]](https://static-01.extrica.com/articles/18889/18889-img7.jpg)
c)
The geometry of the knee joint and the actions define the path of articulation. It would be seen that the center of rotation of knee joint moves. The outline of the femur in the sagittal plane is longer than the anterior and posterior dimension of the tibia. It could be checked in Fig. 4. It means that the femur would roll off the surface of the tibia faster than the knee bended with full flexion when the flexion occurs by the motion of rolling. Through this knee structure, the sagittal plane of knee model should be expressed to elliptic structure.
At the extent knee model, the surface of femur has a large contact area with the tibia. While knee bends, the contact area moved to dimensional horns and the range decreases. The radius of the rotating parts could be shown as to be increased. As the flexion happens in the knee, the contact area would be moving posteriorly towards the posterior meniscal horns. And the contact area with the tibial plateaus would be reduced as lesser radii of curvature of the femoral condyles are sequentially coming into contact. This physical phenomenon is described in detail in papers et al S. D. Masouros (2010) [15] The angle between each bone is be considered as taking three points on the femur and two points on the tibia depending upon the articular kinematics simulations.
2.2. Numerical modeling
The coordinate value of the femur should be extracted in the 3-dimensional shape on meshed model in Fig. 3. This process of meshing the knee bone is to get an outline of sagittal plane. Meshed initial shape is when femur and tibia paired with a straight line shown in Fig. 4(a). The distance between femur and tibia would be calculated at this time. It is considered of the contact when standing. The value is used to get the contact point as the ligament between two bones.
When the number to the node of femur is given, it is granted in accordance with sectioned parts of each angle. It would be granted in special angles (0°, 30°, 45°, 60°, 90°) in this paper. It comes out five cases. Horizontal section should be made up to the fixed tibia model and overlapped to the femur. At this time, the section must be horizontal to the x-y plane on the simulation. From now on, the femur part would get movement as the knee joint kinematics in the sagittal plane (Fig. 4) depending on their own angle. The numerical model would be represented the sagittal plane of the femur.
3. Results
In order to obtain the distance between femur and tibia, node that meshed femur is given the number. At this time x-y coordinate value should be the same. The distance is the difference of z-axis coordinate between femur and tibia. The thickness of the ligament is 5 mm in general [16]. The z-axis distance is substituted as the thickness of the ligament. The red box in Fig. 5 is about the point that the distance is longer than 5 mm. It is when femur and tibia paired with a straight line. The displayed part of more than 5 mm, it could be seen that the epicondyle on femur. The maximum value of the displayed part is nearly 10 mm.
Table 1The distance between femur and tibia
Angle (°) | Distance (mm) |
0 | 5 |
30 | 2.24 |
45 | 1.33 |
60 | 0.53 |
90 | Nearly 0 |
Meanwhile the value of the thickness of the ligament ‘5 mm’ is when standing. The thickness value becomes narrowed while bending the knees. The case that the angle between femur and tibia increases, the node distance seemed to be closer. In case of 30°, the distance between femur and tibia expect red part in Fig. 5 is about 2.24 mm. In case of 45° is about 1.33 mm. When 60°, the value is about 0.53 mm and 90° is close to 0 mm.
All the value is to calculate the result rounded up to the second digit after decimal point. And the red part in Fig. 5 is the excluded. In order to configure the numerical model, the center of epicondyle is needed. Fig. 6 is about the center of epicondyle. It is guided to the Donald Eckhoff et al., 2007. The axis of lateral epicondyle and medical epicondyle has no difference by Donald Eckhoff et al., 2007 [17].
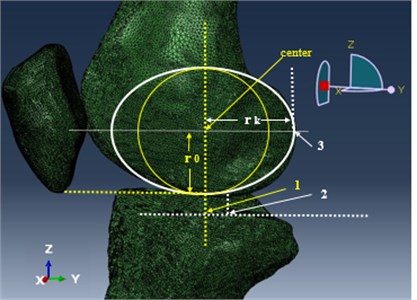
It was modeled through simulation results and the previous study. This model is for identifying the thickness between femur and tibia from the influence of the knee joint kinematics during walking. The center of rotation of knee joint will be on the femur, which is on the sagittal plane. The yellow circle on Fig. 7 is the center of rotation point when standing. The white oval on Fig. 7 is when the angle between femur and tibia is 90°. Numbered 1, 2, 3 are considered knee joint kinematics in the sagittal plane during gait pattern.
As the bone size of medial condyle and the lateral condyle is different. It is represented on Fig. 3(a). It is needed to consider for the each case, when construct the equations. On the other hand, in the case of the sagittal plane section, both part of medial condyle and the lateral condyle are an oval shape, it should be followed the equation:
Fig. 5When the distance between femur and tibia is longer than 5 mm (when femur and tibia paired with a straight line)
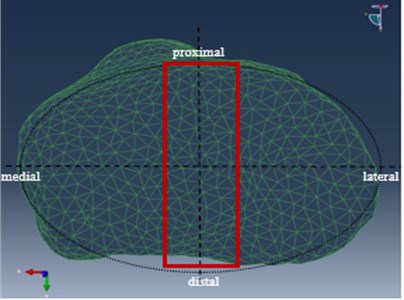
Fig. 6The center of epicondyle [17]
![The center of epicondyle [17]](https://static-01.extrica.com/articles/18889/18889-img9.jpg)
Eq. (1) is the concept of modeling part. It refers to the white oval on Fig. 7. The initial value of the distance of femur and tibia is ‘r0+5’. The value 5 is from the thickness of the ligament, ‘5 mm’. As mentioned ahead, this equation is considered the shape of the sagittal section. The contact point of this equation is y-value. Obtain the y-value from Eq. (1), is:
Through this equations, when the thickness is T:
When we know the center of epicondyle, the trace would be configured as Eq. (3). The case of medial part and the lateral part, r0 and rk would be applied to each case.
Fig. 7The concept of modeling to analysis the abrasion of knee joint
4. Conclusions
The contact point between femur and tibia during the special angle was investigated in this paper. To confirm the derived the numerical model, it was compared with the values of simulation results. From numerical model, each of results showed that the extent consistent by the parametric equations of the ellipse. On the other hand, it was simplified model to identify the predicted position of the knee. The limitations in this study is the number of angles that can be compared is limited.
Fig. 8The flow chart of future research
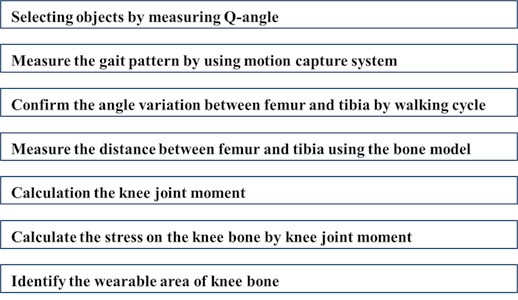
From this result, it is needed to confirm the accuracy in any random angle. However, the significance of result is reflected to the kinematics of bone model. In addition, as the numerical model is assigned to a regression curve of Fig. 1, the trace that a contact point could be presented on a bone model. And in this paper, the weight of a human and the knee rotation moment was not considered. For further study, the study would be progressed as shown in Fig. 8. First of all, the experimental group would be further subdivided. It will be started from measuring Q-angle of subjects before measure the gait pattern.
Fig. 9The flow chart of future research
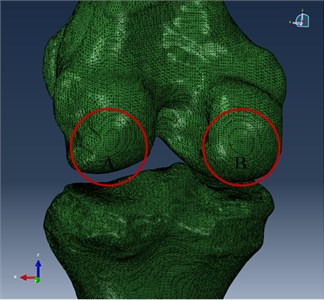
And for not only kinematics of bone model but also the kinetics would be considered in the model, knee joint moment would be calculated. And the stress on the knee bone by knee joint moment would be also calculated. It will be a process of identifying the wearable area of knee joint. The area would be divided to medial condyle and the lateral condyle which are shown in Fig. 9. The result inferred from this study could be used in future studies. Furthermore, this study can be affected to the prevention of increased osteoarthritis and the posture correction while walking.
References
-
Kobetic Rudi, To Curtis S., Schnellenberger John R., Audu Musa L., Bulea Thomas C., Gaudio Richard, Pinault Gilles, Tashman Scott, TrioloRonald J. Development of hybrid orthosis for standing, walking, and stair climbing after spinal cord injury. Journal of Rehabilitation Research and Development, Vol. 46, Issue 3, 2009, p. 447-462.
-
Nadeau S., Mcfadyen B. J., Malouin F. Frontal and sagittal plane analyses of the stair climbing task in healthy adults aged over 40 years: what are the challenges compared to level walking? Clinical Biomechanics, Vol. 18, Issue 10, 2003, p. 950-959.
-
Protopapadaki Anastasia, Drechsler Wendy I., Cramp Mary C., Coutts Fiona J., Scott Oona M. Hip, knee, ankle kinematics and kinetics during stair ascent and descent in healthy young individuals. Clinical Biomechanics, Vol. 22, Issue 2, 2007, p. 203-210.
-
Costigan Patrick A., Deluzio Kevin J., Wyss Urs P. Knee and hip kinetics during normal stair climbing. Gait and Posture, Vol. 16, Issue 1, 2002, p. 31-37.
-
Riener Robert, Rabuffetti Macro, Frigo Carlo Stair ascent and descent at different inclinations. Gait and Posture, Vol. 15, Issue 1, 2002, p. 32-44.
-
Yu Bing, Growney Eric S., Schultz Fred M., An Kai-Nan Calibration of measured center of pressure of a new stairway design for kinetic analysis of stair climbing. Journal of Biomechanics, Vol. 29, Issue 12, 1996, p. 1625-1628.
-
Schipplein O. D., Andriacchi T. P. Interaction between active and passive knee stabilizers during level walking. Journal of Orthopaedic Research, Vol. 9, Issue 1, 1991, p. 113-119.
-
D’Lima Darryl D., Patil Shantanu, Steklov Nikolai, Chien Shu, Colwell Jr. Clifford W. In vivo knee moments and shear after total knee arthroplasty. Journal of Biomechanics, Vol. 40, 2007, p. 11-17.
-
Zachazewski James E., Riley Patrick O., Krebs David E. Biomechanical analysis of body mass transfer during stair ascent and descent of healthy subjects. Journal of Rehabilitation Research and Development, Vol. 30, Issue 4, 1993, p. 412-422.
-
Lin Chii-Jeng, Lai Ko-An, Chou You-Li, Ho Chin-Shan The effect of changing the foot progression angle on the knee adduction moment in normal teenagers. Gait and Posture, Vol. 14, Issue 2, 2001, p. 85-91.
-
Li Guoan, Van de Velde Samuel K., Bingham Jeffrey T. Validation of a non-invasive fluoroscopic imaging technique for the measurement of dynamic knee join motion. Journal of Biomechanics, Vol. 41, Issue 7, 2008, p. 1616-1622.
-
Guo Mengtao, Axe Michael J., Manal Kurt The influence of foot progression angle on the knee adduction moment during walking and stair climbing in pain free individuals with knee osteoarthritis. Gait and Posture, Vol. 26, Issue 3, 2007, p. 436-441.
-
Kowalk David L., Duncan Jeffrey A., Vaughan Christopher L. Abduction-Adduction moments at the knee during stair ascent and descent. Journal of Biomechanics, Vol. 29, Issue 3, 1996, p. 383-388.
-
Heegaard J. H., Leyvraz P. F., Hovey C. B. A computer model to simulate patellar biomechanics following total knee replacement: the effects of femoral component alignment. Clinical Biomechanics, Vol. 16, Issue 5, 2001, p. 415-423.
-
Masouros S. D., Bull A. M. J., Amis A. A. Biomechanics of the knee joint. Orthopaedics and Trauma, Vol. 24, Issue 2, 2010, p. 84-91.
-
Neumann Donald A. Kinesiology of the Musculoskeletal System: Foundations for Rehabilitation. Elsevier, 2016.
-
Eckhoff Donald, Hogan Craig, DiMatteo Laura, Robinson Mitch, Bach Joel Difference between the epicondylar and cylindraical axis of the knee. Clinical Orthopaedics and Related Research, Vol. 461, 2007, p. 238-244.
About this article
This work was supported by the National Research Foundation of Korea (NRF) Grant funded by the Korea Government (NRF-2016R1C1B2008460).

