Abstract
Engine knock limits the thermal efficiency improvement of spark-ignition (SI) engines. Thus, the extract research of the knock characteristics has a great significance for the development of gasoline engines. The research proposes a novel knock detection and diagnosis method in SI engines using the CEIITD (Complementary Ensemble Improved Intrinsic time-scale decomposition) and Bi-spectrum algorithm. The CEIITD algorithm is used to extract the knock characteristics. The results show that the CEIITD algorithm can effectively and clearly extract the knock shock characteristics (including light knock) through the vibration signals. A Bi-spectrum analysis can further distinguish between the light knock signal and normal combustion signal. The Bi-spectrum results also show that knock characteristic has a strong non-Gaussian property. At last, the Band pass filter and Improved ITD method were employed to identify the knock characteristics from these cylinder block vibration signals. The comparison result shows that the CEIITD method proposed in this paper is more suitable to detect the knock characteristic.
1. Introduction
Nowadays, the small strengthening technology (Downsizing) represented by gasoline direct injection pressure and turbocharging is an important technical way to improve the thermal efficiency of gasoline engines, but, with the enhancement of the small strengthening technology, the occurrence probability of engine knock increased significantly [1]. Heavy knock will lead to reduced engine power, increased fuel consumption, emissions deterioration, and severe knock problem can cause engine component damage, so the engine knock restricts the down-sizing of gasoline engine severely [2]. But on the other hand, the light knock is nearly constant volume combustion, in favor of the engine thermal efficiency and improved fuel economy, and is the ideal working condition. Therefore, the research of extracting knock characteristics (including light knock) is a great significance for the development of gasoline engine [3].
There are several types of methods which can be used to detect engine knock. The most commonly used methods are divided into the direct detection and indirect detection methods. The direct methods include the cylinder pressure analysis, and ion current analysis, etc. [4]. These methods can measure the combustion parameters inside the combustion chamber, which can be influenced by knock. So, these methods can identify engine knock more accurately. However, they cannot be widely used in the production engines because of high cost of sensors and limitation of engine structure. The indirect method is used for assessing the knock intensity by measuring vibration signals of cylinder block. Due to durability and low cost, the vibration signal analysis has become the most widely used method to determine the engine knock.
High frequency oscillation pressure waves will be created in the combustion chamber when knock happens. This pressure waves can excite engine block vibrations and cause the knocking noise. But the engine block has a lot of vibration sources, as compared to methods based on the cylinder pressure, the accuracy of the results acquired from vibration signal cannot be guaranteed because of its low signal to noise ratio (SNR). So, the vibration signals need to be re-processed.
In recent years, the development of signal processing technology is very fast, many new signal processing algorithms have been proposed [5, 6] and they were widely used in many fields. Fuzzy C-means algorithm (FCM) and Robust dense reconstruction were used in image processing [7, 8], the collaborative optimization and artificial bee colony (ABC) algorithm were used in optimization design [9-10], and the support vector regression (SVR) was used in the regression analysis [11, 12]. And the least significant bit matching (LSB) was applied for information Security [13, 14]. In the field of knock feature recognition, signal processing methods also achieved many results. Many signal processing methods such as band-pass filter, fast Fourier transform (FFT [15]), short-time Fourier transform (STFT [16]), continuous wavelet transform (CWT [17]), discrete wavelet transform (DWT [18]), wavelet packet transform (WPT [19]) and nonlinear wavelet transform (NWT [20]) have been utilized to extract knock features from vibration signals. The filtering method based on the Fourier transform is widely used in knock detection because the calculation is simple, but it is difficult to detect the light knock when the Signal to Noise Ratio (SNR) is low. The premise of Fourier transform is that the signal is assumed to be stationary and periodic. However, engine knock is the performance of resonant vibrations on a cylinder head and cylinder block, these vibration signals has non-stationary and nonlinear properties. The CWT and DWT were found to be more suitable for non-stationary signal analysis than the FFT as a result of its high time-frequency resolution. But both of them cannot extract non-linear relationships within the signal clearly.
The empirical mode decomposition (EMD) is a self-adaptive time-frequency signal analysis method. This method can decompose a complicated signal into several intrinsic mode functions (IMFs), and each IMF represents an oscillatory mode embedded in the signal, which is determined by the original signal adaptively [21]. In essence, this method consists in a stable processing of non-stationary signals. But there are some inherent deficiencies of EMD, such as the end effects, mode mixing problem [22].
Intrinsic time-scale decomposition (ITD) is a novel signal processing method developed in recent years, which could decompose a complex signal into several proper rotation components (PRCs) based on the local time-scale of signal characteristics [23, 24]. The ITD algorithm can decompose complex signals into a number of proper rotations (PR) based on signals’ local characteristics adaptively. As compared with the EMD method, the baseline signals are only determined at the local extremum point, by the ITD method using piecewise linear transformation. So it can use more local information of original signals that means the ITD method can reveal the essential characteristics of the original signal more effectively [24]. However, relative to the complex vibration signals of engines, the ITD method still has problems of interpolation method and mode mixing. Therefore, to overcome these drawbacks, some researchers have improved the ITD algorithm [25, 26], and developed the improved ITD method using cubic spline interpolation instead of linear interpolation to obtain the baseline signal. And in this method, they use the cumulative variance contribution rate as the termination criterion of PRC component; in addition, apply the mirror extension method for the endpoint extension to solve the extremum series. The improved ITD method has achieved good results in the diesel engine fault diagnosis and antifriction bearing fault diagnosis.
Although the improved ITD method can extract the original signal components more accurately, this method is still affected by mode mixing. So, in this article, a new improved ITD algorithm of CEIITD (Complementary Ensemble Improved Intrinsic time-scale decomposition) is proposed. Compared with the improved ITD method, this method adds white noise in the original signal in pairs, and solves the problem of mode mixing in the case of using less iteration.
Higher order spectra (HOS) analysis is a mathematical tool to describe the high order statistical characteristics of random variables. This theoretical approach can suppress Gaussian noise. If a non Gaussian signal contains Gaussian noise, the noise will be eliminated through the HOS calculation. And the phase coupling relationship between two signals can be analyzed by the HOS [27]. So, the higher order spectral (HOS) analysis can be used as a powerful tool for a non-linear, non-Gauss dynamical analysis. The Bi-spectrum is the lowest order in the HOS analysis methods. The calculation of Bi-spectrum is the simplest, and it contains all the features of the higher-order spectrum, that makes it more convenient to be used to analyzing the vibration signals to obtain the characteristic information.
Due to the complex structure of the gasoline engine, there are many kinds of vibration signals in it, the knock feature is mixed inside, and when the engine is working in a light knocked state, the energy of the knocking feature is weak and less likely to be detected. The CEIITD method can decompose a complex signal into high-low PRC components of multiple frequency components and can avoid mode mixing. Therefore, the knock feature hidden in the vibration signals can be decomposed into a specific PRC component. And the Bi-spectrum analysis to this PRC component can further obtain the frequency characteristics of knock feature. So, in this article, a novel approach to the basis on CEIITD and Bi-spectrum is proposed for the detection of engine knock.
2. Method
2.1. CEIITD
2.1.1. Improved ITD
The detailed improved ITD method is described as follows [28]:
Step 1: Given the composite signal , all extremum points (, ) (1, 2, …, ) of the signal are determined, where is the number of extreme points.
Step 2: For any three consecutive local extremum points (, ), (, ) and (, ) the baseline control point L corresponding to time T can be calculated by the following twice linear transformation:
where the second term in the brackets is the linear interpolation of the local extremum points (, ) and (, ) at time . From Eq. (1) it can be found that the value of the baseline control point is from 2 to 1. Therefore, it is necessary to extend the local extrema of the signal and estimate the baseline control point near the end point.
Step 3: Two new local extremum points (local maximum point and local minimum point) are extended at each end of the signal local extremum sequence by using the mirror extension method. Baseline control points , , and are calculated according to Eq. (1).
Step 4: Assuming that the time values of the baseline control points are , ..., , , ..., , the magnitude of the corresponding point is , ..., , , ..., . The interval [, ] is divided into 1 subintervals [, ] by , ..., , , ..., , and magnitude of the corresponding subinterval endpoint point. The baseline is obtained by using cubic spline interpolation to fit all control points .
Step 5: The residual signal is obtained by separating the baseline signal from the original signal :
In theory, can be considered as the first-order component, but for engine vibration signals, a single decomposition cannot ensure the physical significance of the component. Therefore, the standard deviation (SD) criterion is selected as the component criterion. is regarded as the original signal, so steps 1-5 shall be repeated times until satisfies the SD criterion, is the first-order PRC component.
Step 6: The is separated from the original signal to obtain the residual signal . As compared to , is smoother, mainly because the highest frequency impact component has been separated:
is treated as the original signal and steps 1-6 are repeated times until the cumulative variance contribution rate is greater than 0.99. The cumulative variance contribution rate, , reflects the contribution of all the PRC components that have been obtained for the original signal:
Finally, the original signal is decomposed into several PRCs and residual signal :
2.1.2. CEIITD
Although the improved ITD method can extract the original signal components more accurately than EMD method, it also has the mode mixing problem. This phenomenon can be observed as the different time scales of the feature components appear in the same PRC function, or the same scale of the feature components is decomposed into different PRC functions. This phenomenon is particularly evident when the improved ITD algorithm is applied to analyze a time-scale jumping signal. As the gasoline engine has many vibration sources, the cylinder vibration signal contains shocks, jumping components, vulnerable to modal aliasing, and is more susceptible to mode mixing.
To solve this problem, the original signal can be added to the white noise, and then decomposed.
The mode mixing problem can be solved by adding white noise to the original signal. However, in order to remove the white noise residual component from the decomposition result, the average number times are needed as much as possible (more than 100 times). This will greatly increase the computational burden and will be detrimental to the engine knock real-time detection. In 2010, a new white noise assistant method is proposed by Huang [29]. In this method, white noise is added in pairs to the original data. The results show that this method can quickly eliminate the white noise from the decomposition results. So, in this article, a new improved ITD method CEIITD (Complementary Ensemble Improved Intrinsic time-scale decomposition) is proposed. The analysis result shows that, as compared to the improved ITD method, the CEIITD method can obtain better results only using 20 times of iterations, and at the same time, it can eliminate the residual white noise from the analysis results. The CEIITD algorithm is composed of the following steps:
Step 1: A pair of white noise was added to the original data (one positive and one negative) as follows:
In the above equation, is the original signal; represents added white noise; and represent the original signal with added positive noise and negative noise.
Step 2: The newly generated signal is decomposed by the improved ITD method, and two sets of ensembles PRCs are generated. Then, the ensemble PRCs obtained from those added positive noises signals contain residues of positive white noises, and the ensemble PRCs obtained from those added negative noises signals contain a set of negative added white noises.
Step 3: Step 1 and Step 2 are repeated with different white noise in the form of is fixed amplitude.
Step 4: The mean value of all PRCs is calculated as final CEIITD results.
To illustrate the advantage of CEIITD, a simulation signal is listed. The simulation signal is shown in Fig. 1:
Fig. 1Original signal

a)

b)

c)

c)
Where x1 is a cosine signal of amplitude 1, is a sinusoidal signal of amplitude 1, and is a high frequency component of amplitude 0.3.
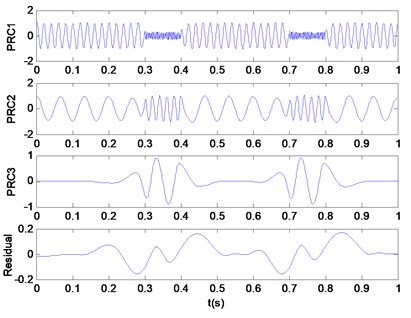
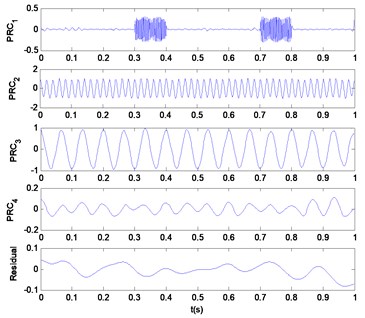
The decomposition result of improved ITD is shown in Fig. 2(a), and the CEIITD result is shown in Fig. 2(b). In the CEIITD method, the amplitude of added noise is 0.1 times to the standard deviation of and the ensemble number is 20, and Fig. 2(c) shows the residues of added white noise derived by CEIITD. The residue of added white noise can be determined by the difference between the original signal and reconstructed signal, and the reconstructed signal is the sum of all PRC components and residual component obtained by the CEIITD method.
From Fig. 2(a), it can be seen that PRC1 and PRC2 are two components with emerged mode mixing, and two sine components PRC1 and PRC2 have high-frequency components mixed. Mode mixing causes each PRC component to lose its physical meaning and does not reflect the true component of the original signal.
But it can be seen from Fig. 2(b) that, PRC1 corresponds to high-frequency components, PRC2 corresponds to and PRC3 corresponds to , and the Fig. 2(c) shows that the residue of white noise from CEIITD has average amplitude close to 0 (of the order of 10-9), that means the CEIITD method could represent the characteristics of the original signal accurately and eliminate the residual white noise in the analysis results effectively only using few times of iterations.
Fig. 2a) improved ITD result, b) CEIITD result, c) residues of added white noises derived by EEMD and CEEMD
a)
b)

c)
2.2. Bi-spectrum algorithm
2.2.1. Definition of Bi-spectrum
For a steady cycle vibration signal , its Bi-spectrum is defined as follows:
From this equation, it can be known that the Bi-spectrum has two frequency variables , , the Bi-spectrum amplitude at (, ) of is equal to the product of the Bi-spectrum amplitudes at , and (, ). The physical meaning of Bi-spectrum is not clear, in some degree; it is equivalent to the decomposition of the signal skewness in the frequency domain. It has phase and amplitude information, and can describe the signal nonlinear, non-Gaussian characteristic information. In case of a mechanical system breakdown or state change, the nonlinear system will change.
2.2.2. Bi-spectrum calculation
There are many different methods that can calculate the higher-order spectral. The direct calculation method has higher accuracy, and its algorithm steps are shown as follows [27]:
1) The original data is , the data is segmented into overlay records.
2) The mean value of each record is de-trended and removed.
3) Windows are added, and the fast Fourier transform (FFT) is calculated for each record.
4) The Bi-spectrum of the th order record is computed as:
where denotes the FFT of the th record.
5) Finally, average value of is calculated as the result of Bi-spectrum estimates.
Since the higher-order cumulant of the Gaussian process is equal to zero, the higher-order cumulant of the non-Gaussian process is not zero, whereas the Bi-spectrum analysis is a two-dimensional Fourier transform of the third-order cumulant of the signal and therefore the Gaussian background noise can be automatically suppressed to improve the extraction accuracy of the signal characteristics.
3. Proposed engine knock characteristic extraction approach based on CEIITD and Bi-spectrum
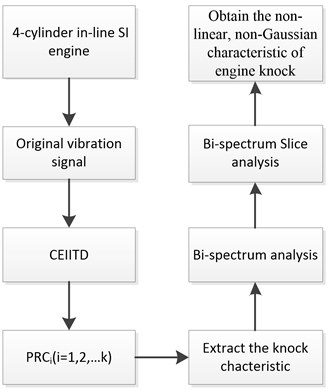
The engine knock detection approach for SI engine based on CEIITD and Bi-spectrum is given as follows:
Step 1: A 4-cylinder in-line SI engine was used to generate the test data. The cylinder block vibration data is measured by an acceleration sensor.
Step 2: The engine block vibration signal is decomposed into a series of PRCs by the CEIITD method to extract the engine knock characteristics.
Step 3: The PRC component which contains the knock characteristics analyzed by Bi-spectrum to obtain the non-linear, non-Gaussian characteristics.
The flow chart of the engine knock characteristic extraction approach is illustrated in Fig. 3.
Fig. 3Operation procedure of knock feature extraction
4. Engine test program and experimental data acquisition
The engine knock was tested in a four-cylinder turbocharged, direct injection gasoline engine, and the engine main parameters are shown in Table 1. The test bench mainly includes: 1.5 T gasoline engine, AVL electric power dynamometer, LMS Scada Ⅲ noise and vibration test system and computer. The power dynamometer is connected to the flywheel of the gasoline engine through the coupling. The power dynamometer is used to control the engine during a test to maintain a constant load and relatively stable speed. In this research, the engine knock was initiated by adjusting the spark advance. The knock signal is measured using a Dytran 621B40 acceleration sensor. The acceleration sensor is installed at the cylinder block. In order to directly monitor the occurrence of knock and to estimate the knock strength in each cylinder, four AVL GH13Z-31 spark plug cylinder pressure sensors were installed into the spark plug mounting hole to capture the cylinder pressure during normal operation and knock combustion. The signal acquisition is controlled by the LMS Scada Ⅲ noise and vibration test system, and the collected signals will be stored on the computer for a further analysis. The Schematic diagram of engine test system is shown in Fig. 4, the test engine and the location of acceleration sensor are shown in Fig. 5(a), and the cylinder pressure sensor and LMS Scada Ⅲ test system are shown in Fig. 5(b). The engine operating condition was within the range of 2800 rpm to 4000 rpm.
Table 1Test engine specifications
Cylinders/valves per cylinder | 4/4 |
Displacement | 1.5 L |
Intake type | Turbocharged |
4-stroke Gasoline engine | Direct injection |
Max power | 110 kW @ 5600 rpm |
Max torque | 210 Nm @ 2200-4500 rpm |
Fig. 4Schematic diagram of engine test system

Fig. 5Experimental set up

a) Test engine and the location of acceleration sensor

b) Cylinder pressure sensor and LMS Scada Ⅲ test system
5. Result
5.1. Knock feature extraction
In order to research the different characteristics of vibration signals between normal combustion, the heavy knock operating condition, light knock condition and normal combustion condition are to be chosen from test results for an analysis.
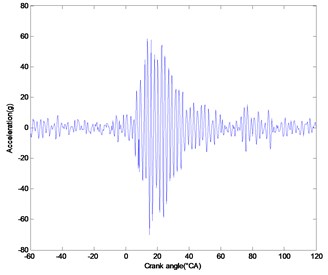
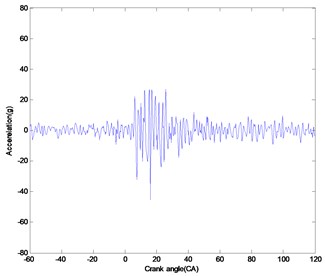
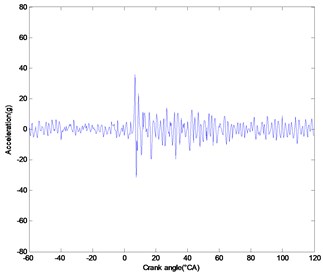
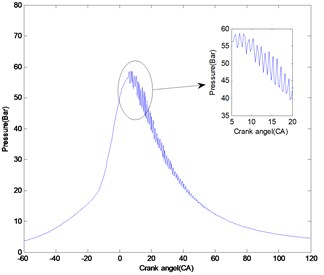
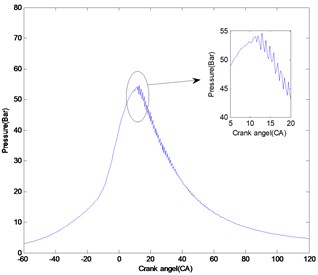
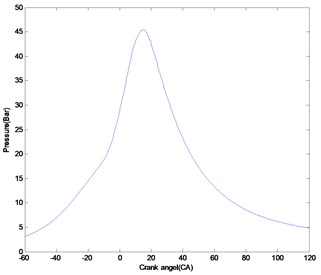
Fig. 6(a) to 6(c) show the vibration curves under a heavy knock condition, light knock condition and normal combustion condition, respectively. Fig. 7(a) to 7(c) show the cylinder pressure curves under these three conditions. In a heavy knock condition, the engine speed is 2800 rpm, and the ignition advance angle is 26°CA. In light knock and normal combustion conditions, the engine speed is 2800 rpm, and the ignition advance angle is 22°CA. And in the normal condition, the engine speed is 2800 rpm and the ignition advance angle is 19°CA.
Fig. 6a) heavy knock acceleration, b) light knock acceleration, c) normal condition acceleration
a)
b)
c)
Fig. 7a) heavy knock pressure, b) light knock pressure, c) normal condition pressure
a)
b)
c)
As it can be seen from Fig. 7(a), the cylinder pressure fluctuates sharply around the pressure peak, which is due to the violent turbulence of the cylinder pressure caused by the spontaneous combustion of the terminal mixture. It can also be determined that knocking occurs in this condition. In contrast to this, in the normal combustion state, from Fig.7(c), the engine cylinder pressure curve is smoother, and without significant fluctuations, indicating that the normal combustion condition exists. When the cylinder pressure reaches its peak, the pressure changes are not violently. And from Fig. 7(b), it can be seen that the cylinder pressure has a high frequency fluctuation near the peak value, but the fluctuation is not severe. Therefore, it can be assessed that this condition has light knock.
From Fig. 6(a), it can be seen that in the heavy knock condition, the cylinder vibration signal peak is more than 60 g, and Fig. 6(b), 6(c) shows that to the light knock and normal combustion, the peak value of vibration signal is about 30 g, which is much smaller than that of heavy knock. However, the amplitude of the vibration signal is similar to that between the light knock and normal combustion conditions. It is difficult to determine the light knock directly by the vibration signal.
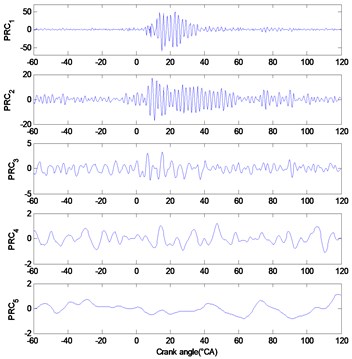
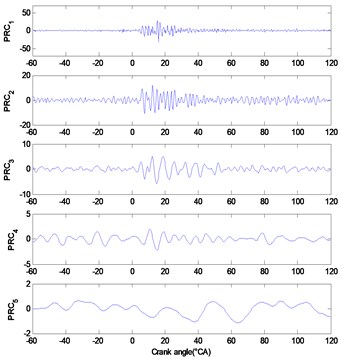
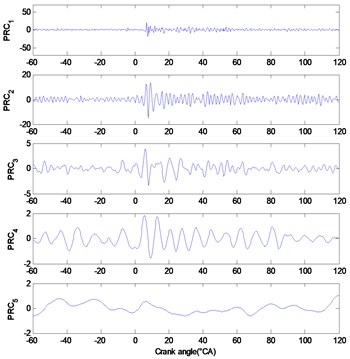
In order to extract the knock feature frequencies accurately, the engine surface vibration signal is decomposed by the CEIITD. The white noise amplitude to the standard deviation of original signal is set to 1.2, and ensemble number for the CEIITD is set to 20 times. Because the knock feature is mainly concentrated in the high frequency region, and the frequency of PRC component decomposed by CEIITD method is arranged from high to low, to save the computation time, only take first 5 order PRC components. If the decomposition results have more than 5 orders, this decomposition shall be stopped, the next iteration is entered. The CEIITD result of vibration signals is shown in Fig. 8(a)-(c).
In the CEIITD decomposition results, there are five PRC components that have been decomposed. From Fig. 8(a)-(c), it can be seen that the PRC1 amplitude of the heavy knock condition is greater than 50. This amplitude is significantly larger than that of the light knock condition and the normal condition. In addition, the PRC1 component amplitude of light knock condition is larger than the PRC1 amplitude of normal combustion condition obviously.
On the other hand, PRC1 of both heavy knock and light knock conditions have an obvious peak at the time of cylinder pressure fluctuation (10°-40° crank angle), while the PRC1 of normal combustion did not show significant peaks. So, it can be concluded that through the PRC1 of the CEIITD result the light knock characteristics can be identified from a vibration signal.
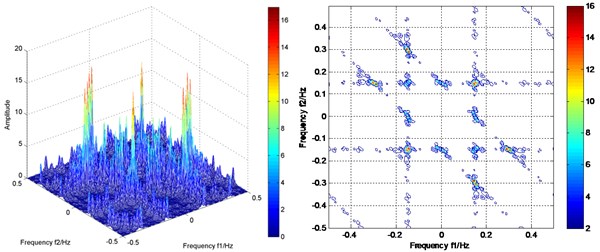
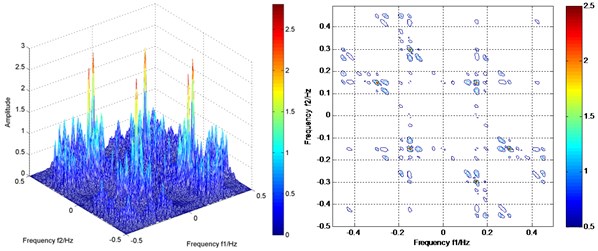
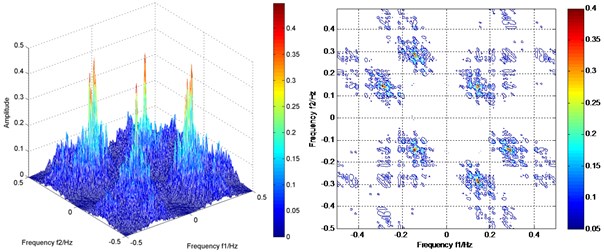
In order to further analyze the characteristics of engine knock, Bi-spectrum is used. The CEIITD results show that the knock characteristics are mainly concentrated in the PRC1. Therefore, the PRC1 is subjected to the Bi-spectrum analysis. Each data samples which range is from –60 to 120 crank angles, the length of data segment is 256; each piece of data between the overlap degrees is 0. The frequencies of and (0 to 0.5 Hz) are actually normalized to the frequencies of 0 to 25600 Hz, and the frequencies of and are the same as the reference frequency. That means the frequency band [0, 0.5 Hz] is actual corresponding to the band [0, 25600 Hz]. The results are shown in Fig. 9(a)-(c).
From Fig. 9, it can be seen that after the Bi-spectrum analysis, the amplitude of heavy knock and light knock is significantly larger than the normal combustion, and with the increase of the knock intensity, the Bi-spectrum distribution becomes simpler. Under normal combustion condition, the Bi-spectrum image is complex, the peak is not very prominent, and for light knock and heavy knock conditions, the Bi-spectrum image distribution only have a little difference, and the peak amplitude is very prominent.
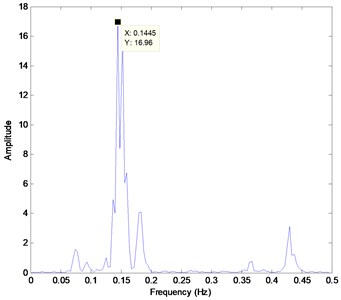
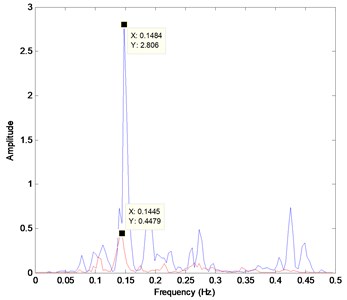
Bi-spectrum is a two-dimensional vector, and it is complicated to be analyzed and dealt directly. One-dimensional slice can be used to reduce the dimension of detonation data and detonation feature. After a lot of experimental analyses, the Bi-spectrum diagonal is selected for a slice analysis. The Bi-spectrum slice results are shown in Fig. 10(a), (b).
Fig. 8a) heavy knock signal with CEIITD decomposition results, b) light knock signal with CEIITD decomposition results, c) normal combustion signal with CEIITD decomposition results
a)
b)
c)
From Fig. 10, it can be seen that, after the Bi-spectrum analysis, the maximum amplitude in the slice figure of heavy knock condition is 16.96, the maximum amplitude of light knock condition is 2.81, and the normal combustion condition of the maximum amplitude is 0.45, the distinction between these three statuses is higher than CEIITD results.
In heavy knock, the main peak appears at a frequency of (0.1445, 0.1445), which is equivalent to 7398 Hz, and in the light knock condition, the main peak appears at (0.1484, 0.1484), and is equivalent to 7598 Hz. For automotive engines, vibration mode frequencies of knock are typically within the range of 6-20 kHz [2]. And the engine knocks are from the chamber resonances excited by abnormal combustion. The resonance frequency of the combustion chamber is got by the following formula [30]:
where c is the sound speed inside the combustion chamber, represents the cylinder bore and is the corresponding wave number. The sound speed depends on the chamber combustion temperature. So, for this gasoline engine, the 1st order of resonance (1st wave number 1.84) is at 7000 Hz-8000 Hz, the 2nd order of resonance (2nd wave number 3.05) is at 12000-13000 Hz. The Bi-spectrum slice analysis result shows that the frequency of peak value in Bi-spectrum result is coincides with the 1st order resonance, that indicating that the dominant peak in the Bi-spectrum results is the knocking feature result.
Since the Bi-spectrum can suppress the Gaussian distribution in the signal completely, the distribution and intensity information of the non-Gaussian component in the dual frequency domain is revealed. So, the Bi-spectrum image shows the distribution of the non-Gaussian components in the dual-frequency domain. And the results shown in Fig. 8 and Fig. 9 mean that the knock feature belongs to a non-Gaussian signal, with the knock intensity increases, the non-Gaussian nature of the cylinder block vibration signal increases significantly.
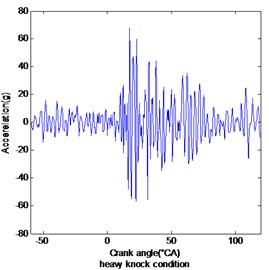
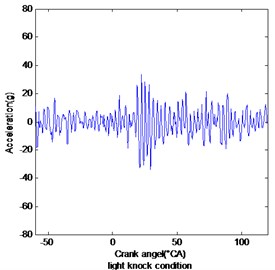
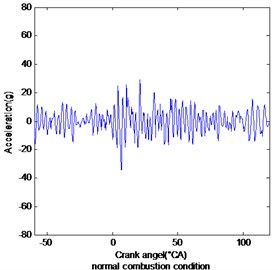
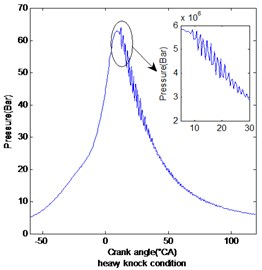
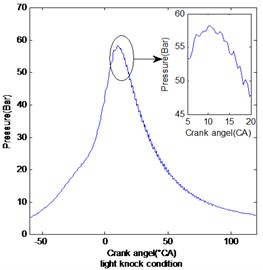
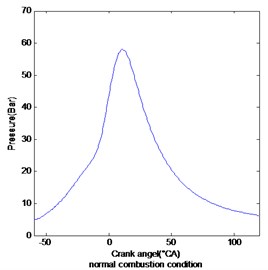
In order to illustrate the adaptability of the proposed method in this paper under different working conditions, another three conditions include heavy knock, light knock and normal combustion running under 4000 rpm as shown in Fig. 11. And the cylinder pressure signals of these three conditions are shown in Fig. 12. The ignition advance angle of heavy knock, light knock and normal combustion are 27°CA, 24°CA and 20°CA, respectively. Figures from left to right contain heavy knock condition, light knock condition and normal combustion condition.
Fig. 9a) Bi-spectrum estimation of PRC1 of heavy knock condition, b) Bi-spectrum estimation of PRC1 of light knock condition, c) Bi-spectrum estimation of PRC1 of normal combustion condition
a)
b)
c)
Fig. 10a) Bi-spectrum slice of PRC1 of heavy knock, b) Bi-spectrum slice of PRC1 of light knock and normal combustion
a)
b)
Fig. 11Cylinder block vibration signal of three conditions under 4000 rpm
a)
b)
c)
Fig. 12Cylinder pressure signal of three conditions under 4000 rpm
a)
b)
c)
From the cylinder pressure signals shown in Fig. 12, it can be seen that, in the heavy knock condition, the cylinder pressure fluctuates sharply around the peak value, which means knocking occurred in this condition. In contrast to this, in the normal combustion condition shown in the right picture of Fig. 12, the engine cylinder pressure curve is smoother, and without significant fluctuations, indicating it is the normal combustion condition. And from the middle picture in Fig. 12, it can be seen that the cylinder pressure has a high frequency fluctuation near the peak value, but the fluctuation is not severe as the heavy knock condition. Therefore, it can be assessed that this condition has light knock.
From Fig. 11, it can be seen that in the heavy knock condition, the cylinder vibration signal peak is more than 60 g, obviously larger than in light knock and normal combustion conditions. But the peak value of vibration signal of light knocks, and normal combustion conditions are all about 30g. It is difficult to determine the light knock directly only by a vibration signal.
Fig. 13CEIITD decomposition results of vibration signal of three conditions under 4000 rpm
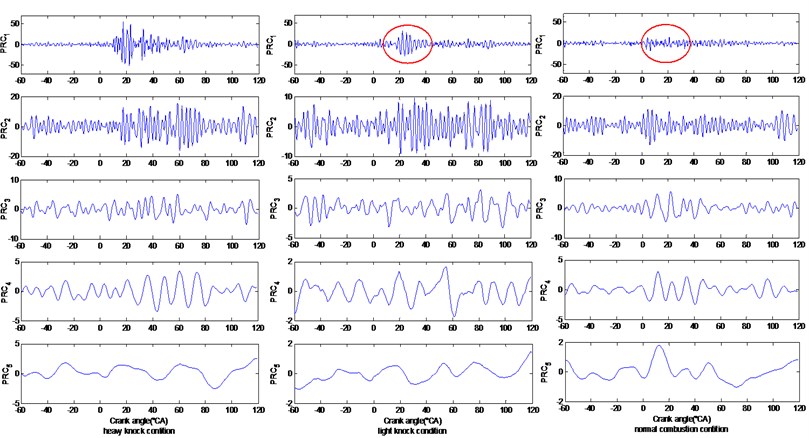
Then the vibration signals of these three conditions are decomposed by the CEIITD method, the white noise amplitude to the standard deviation of original signal is set to 1.2, and ensemble number for the CEIITD is set to 20 times. The results are shown in Fig. 13. From Fig. 13, it can be seen that the PRC1 amplitude of the heavy knock condition is greater than 50. This amplitude is largest in these three conditions. And the PRC1 component amplitude of light knock condition is also obviously larger than the normal combustion condition. In addition, in the PRC1 component, when the cylinder pressure fluctuates sharply (10°-40° crank angle), both heavy knock and light knock conditions have an obvious impact, while the PRC1 of normal combustion does not show significant peaks at that crank angle. So, it can be concluded that in the 4000 rpm conditions, the CEIITD method can also identify light knock characteristics from vibration signals.
5.2. Comparison and discussion
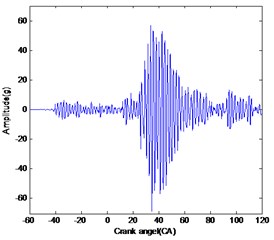
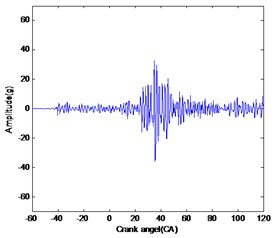
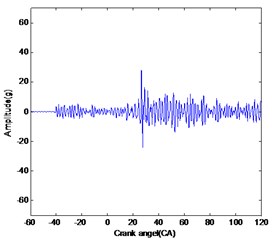
To verify the effectiveness of the proposed method, the Band Pass Filter and improved ITD were applied to detect the knock characteristics from cylinder block vibration signals shown in Fig. 6.
First of all, the band-pass filter method was used to analyze the cylinder block vibration shown in Fig. 6(a)-(c). This is a common method for processing knock sensor signals on a gasoline engine. For automotive engines, the knock vibration mode frequencies are typically within the range of 6-20 kHz, so the band pass frequency is set to 6-20 kHz. The results are shown in Fig. 14.
From Fig. 14, it can be seen that in the heavy knock condition, the peak amplitude is still larger than light knock and normal combustion obviously, but the amplitude difference between light knock and normal combustion is not very obvious, that means the band pass filter cannot identify the light knock characteristics very clearly.
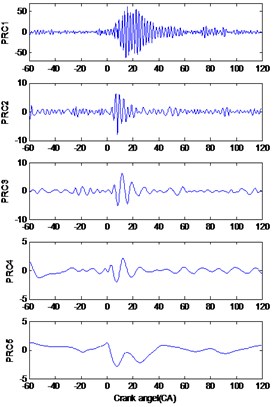
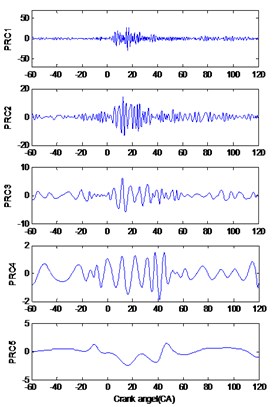
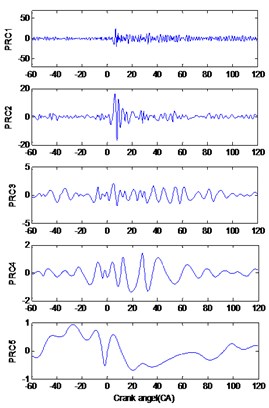
Then, these vibration signals were analyzed by using the improved ITD method. In this work, the improved ITD results of vibration signals are illustrated in Fig. 15.
Fig. 14Band pass filter result for these three conditions
a)
b)
c)
Fig. 15Improved ITD result for these three conditions
a)
b)
c)
From the figure, it can be found that the entire PRC1 components of these three conditions showed obvious peaks, and no obvious peaks can be found in other IMFs. So, it can be concluded that the knock features are concentrated in PRC1. From PRC1 components of these conditions, it can be found that the amplitude of heavy knock was significantly larger than that of the other two conditions. However, there is no significant difference of the amplitude of PRC1 component between the light knock and normal combustion conditions. That means the improved ITD method is not as effective as the CEIITD and Bi-spectrum methods in extracting light knock features.
6. Conclusion
In this paper, a new knock feature detection method is proposed for spark ignition engines based on the Complement Ensemble Improved Intrinsic Time-scale Decomposition (CEIITD) and Bi-spectrum. The CEIITD technique is a noise-assisted signal analysis method with the addition of white noise in pairs to the original signal. Relative to improved ITD method, this method could keep the advantages of the ITD method, solve the mode mixing problem and eliminate the residual white noise in the analysis results effectively only using few times of iterations.
Bi-spectrum can suppress the Gaussian distribution in the signal completely, and it is also used to detect non-linearity signals accurately. These features can be used to separate different conditions of engine, like knock conditions.
In order to prove the reliability of the method proposed in this paper, this method is examined in extracting the knock features on a test gasoline engine. The observations and conclusions of the study are summarized as follows:
1) The CEIITD algorithm can effectively extract the knock shock characteristics (including light knock) from a cylinder block vibration signal, and the knock characteristics are concentrated in PRC1.
2) The PRC1 component of CEIITD result is analyzed by Bi-spectrum. The result shows that the non-Gaussian properties of knock conditions are significantly larger than normal combustion conditions. The knock characteristic signal shows a strong non-Gaussian character.
3) At last, the Band pass filter and Improved ITD method were employed to identify the knock characteristics from these cylinder block vibration signals. The comparison result shows that the CEIITD method proposed in this paper can receive better results
References
-
Lang O., Geiger J., Habermann K., Wittler M. Boosting and direct injection -synergies for future gasoline engines. SAE Technical Papers, 2005-01-1144, 2005.
-
Galloni E. Dynamic knock detection and quantification in a spark ignition engine by means of a pressure based method. Energy Conversion and Management, Vol. 64, Issue 12, 2012, p. 256-262.
-
Zhen X., Wang Y., Xu S., Zhu Y., et al. The engine knock analysis – an overview. Applied Energy, Vol. 92, Issue 2, 2012, p. 628-636.
-
Siano D., Bozza F. Knock detection in a turbocharged SI engine based on ARMA technique and chemical kinetics. SAE Technical Papers, 2013-01-2510, 2013.
-
Gu B., Sun X., Sheng V. S. Structural minimax probability machine. IEEE Transactions on Neural Networks and Learning Systems, Vol. 28, Issue 7, 2016, p. 1646-1656.
-
Gu B., Sheng V. S. A robust regularization path algorithm for ν-support vector classification. IEEE Transactions on Neural Networks and Learning Systems, Vol. 28, Issue 5, 2016, p. 1-8.
-
Zheng Y., Byeungwoo J., Xu D., Wu Q. M. J., et al. Image segmentation by generalized hierarchical fuzzy c-means algorithm. Journal of Intelligent and Fuzzy Systems, Vol. 28, Issue 2, 2016, p. 4024-4028.
-
Chen Y., Hao C., Wu W., Wu E. Robust dense reconstruction by range merging based on confidence estimation. Science China Information Sciences, Vol. 59, Issue 9, 2016, p. 1-11.
-
Deng W., Zhao H., Zou L., Li G., Yang X., Wu D. A novel collaborative optimization algorithm in solving complex optimization problems. Soft Computing, Vol. 21, Issue 5, 2017, p. 4387-4398.
-
Xue Y., Jiang J. M., Zhao B. P., Ma T. H. A self-adaptive artificial bee colony algorithm based on global best for global optimization. Soft Computing, 2017, p. 1-18.
-
Gu B., Sheng V. S., Tay, K. Y., Romano W., Li S. Incremental support vector learning for ordinal regression. IEEE Transactions on Neural Networks and Learning Systems, Vol. 21, Issue 5, 2017, p. 1403-1416.
-
Gu B., Sheng V. S., Wang Z., Derek Ho, Osman S., Li S. Incremental learning for ν-support vector regression. Neural Networks, Vol. 67, 2015, p. 140-150.
-
Xia Z., Wang X., Sun X., Wang B. Steganalysis of least significant bit matching using multi-order differences. Security and Communication Networks, Vol. 7, Issue 8, 2014, p. 1283-1291.
-
Xia Z., Wang X., Sun X., Liu Q., Xiong N. Steganalysis of LSB matching using differences between nonadjacent pixels. Multimedia Tools and Applications, Vol. 75, Issue 4, 2016, p. 1947-1962.
-
Kearney M. J. Knock signal conditioning using the discrete Fourier transform and variable detection window length. SAE Technical Papers, 2007-01-1509, 2007.
-
Vulli S., Dunne J. F., Potenza R., Richardson D., King P. Time-frequency analysis of single-point engine-block vibration measurements for multiple excitation-event identification. Journal of Sound and Vibration, Vol. 321, Issue 3, 2009, p. 1129-1143.
-
Zhang Z., Tomita E. Knocking detection using wavelet instantaneous correlation method. JSAE Review, Vol. 23, Issue 4, 2002, p. 443-449.
-
Cocchi A., Andreini P., Cassitto L., Siano D., Agostino D. Knock detection in SI engines by using the discrete wavelet transform of the engine block vibrational signals. Energy Procedia, Vol. 81, 2015, p. 673-688.
-
Liu C., Gao Q., Jing Y. Application of wavelet packet transform in the knock detection of gasoline engines. Proceedings of the International Conference on Image Analysis and Signal Processing, 2010, p. 686-690.
-
Li N., Yang J., Zhou R., Wang Q. Knock detection in spark ignition engines using a nonlinear wavelet transform of the engine cylinder head vibration signal. Measurement Science and Technology, Vol. 25, Issue 11, 2014, p. 1-11.
-
Huang N. E., Shen Z., Long S. R., Wu M. C., Shih, H. H., Zheng Q., et al. The empirical mode decomposition and the Hilbert spectrum for nonlinear and non-stationary time series analysis. Proceedings of the Royal Society a Mathematical Physical and Engineering Sciences, Vol. 454, Issue 1971, 1997, p. 903-995.
-
Chen B., He Z., Chen X., Cao H., Cai G., Zi Y. A demodulating approach based on local mean decomposition and its applications in mechanical fault diagnosis. Measurement Science and Technology, Vol. 22, Issue 5, 2011, p. 704-716.
-
Mark G., Frei Intrinsic time-scale decomposition: time-frequency-energy analysis and real-time filtering of non-stationary signals. Proceedings of the Royal Society a Mathematical Physical and Engineering Sciences, Vol. 463, Issue 2078, 2007, p. 321-342.
-
An X., Jiang D., Chen J., Liu C. Application of the intrinsic time-scale decomposition method to fault diagnosis of wind turbine bearing. Journal of Vibration and Control, Vol. 18, Issue 2, 2012, p. 240-245.
-
Liu Y., Zhang J., Bi F., Lin J., Ma W. A fault diagnosis approach for diesel engine valve train based on improved ITD and SDAG-RVM. Measurement Science and Technology, Vol. 26, Issue 2, 2015, p. 1-14.
-
Yang Y., Li J., Pan H., Cheng J. Research on combined intelligent diagnostic method based on VPMCD and improved ITD. Journal of Vibration Engineering, Vol. 26, Issue 4, 2013, p. 608-616, (in Chinese).
-
Liang B., Iwnicki S. D., Zhao Y. Application of power spectrum, cepstrum, higher order spectrum and neural network analyses for induction motor fault diagnosis. Mechanical Systems and Signal Processing, Vol. 39, Issues 1-2, 2013, p. 342-360.
-
Liu Y., Zhang J., Ma L. A fault diagnosis approach for diesel engines based on self-adaptive WVD, improved FCBF and PECOC-RVM. Neurocomputing, Vol. 177, 2016, p. 600-611.
-
Yeh J. R., Shieh J. S., Huang N. E. Complementary ensemble empirical mode decomposition: a novel noise enhanced data analysis method. Advances in Adaptive Data Analysis, Vol. 2, Issue 2, 2011, p. 135-156.
-
Brunt M. F. J., Pond C. R., Biundo J. Gasoline engine knock analysis using cylinder pressure data. SAE Technical Paper 980896, 1998.
Cited by
About this article
This research is supported by the National Science and Technology Support Program of China: Vibration and Noise Reduction Technology Research and Application of Bulldozers and Other Earth Moving Machinery (Grant No. 2015BAF07B04).
