Abstract
A feature extraction of fault bearing has attracted considerable attention in recent years. However, weak fault feature is difficult to extract under heavy background noise. To solve this problem, a novel multi-layer filtering method is proposed to filter out noise and extract weak fault feature. The first layer introduces a metric based on de-trended fluctuation analysis (DFA) to identify intrinsic mode function (IMF) that reflect period impulsive information for vibration signal adaptively. The second layer uses non-local mean (NLM) method as a pre-filter of the third layer to realize extraction of singular value decomposition (SVD) which reflect the most information of IMFs. The last layer introduces a relative energy difference criterion of a singular value to extract important feature of Hankel matrix of IMFs. The filtered signal is obtained by re-constructed signal from identified singular value of SVD. Experiment results on simulation and real vibration signals indicate that the hybrid filtering method removes heavy noise successfully and extract weak fault feature of rolling bearing effectively.
Highlights
- It proposes criterion of the smallest Hurst exponent to identify the periodic impulse adaptively.
- It introduces the non-local meaning filter to filter out noise in the intrinsic mode functions.
- The relative energy difference spectrum is proposed to remove the weak noise component.
1. Introduction
Bearing is a critical component in rotary machine. The reliability directly affects machine health status. Thus, an effective condition monitoring (CM) and fault diagnosis (FD) method is required to detect and recognize potential abnormalities which reduce risk of unexpected severity and other disastrous events [1-4].
Vibration analysis technology is a key topic in CM and FD research domain. This technology may extract fault feature of rolling bearing effectively. Conventional methods, such as fast Fourier transform (FFT), are used to address stationary and linear signals [5] widely. However, FFT is unsuitable to extract fault feature on account of characteristic of non-linear and non-stationary for vibration signal. Wavelet transform is a typical application in bearing fault diagnosis [6-8]. This technique has attracted considerable attention of researchers in the past two decades. However, wavelet transform is difficult to select wavelet base function. Recently, empirical mode decomposition (EMD) has been proposed to process complex non-linear and non-stationary signal [9]. EMD is an adaptive decomposition method that decomposes complicated signals into a set of multi-component with intrinsic mode function (IMF). Every IMF indicates a mono-component amplitude- and frequency-modulated signal. EMD has been applied to bearing [10], gearbox [11], and rubbing [12] fault diagnoses. However, EMD have several limitations, such as mode mixing and end effect. To solve the problem, Huang [13] proposed an ensemble EMD (EEMD) to alleviate the limitations of EMD. This method reflected the frequency of every IMF accurately and effectively. Moreover, EEMD has attracted significant attention in fault diagnoses domain. For example, Wang [14] proposed a method based on multi-scale principal component analysis to extract fault frequency of slewing bearing. Chen [15] improved EEMD by adding white noises and adaptively determining an ensemble number to extract fault features. However, EEMD has caused spurious mode and residual noise because of interaction of noise and signal. Subsequently, Torres [16] introduced a complete EEMD with adaptive noise (CEEMDAN) to overcome this drawback. CEEMDAN has been applied to fault diagnoses [17, 18] successfully.
For vibration signal being immersed by heavy noise, it is important to develop a de-noised method to extract the early detection of weak fault. However, filtering method based on EMD or its improved versions (EEMD and CEEMDAN) do not filter out noise in vibration signal fully. The reason is that IMF do not effectively reflect frequency component of fault because of noise interference. Recently, the hybrid filtering method based on singular-value decomposition (SVD) and EMD or its improved versions have been proposed to extract weak fault feature. Cheng [19] used EMD to decompose impulse signal, and used SVD and support vector machine to extract fault feature and classify fault pattern of gearbox and bearing. Yang [20] adopted EEMD with sample entropy and SVD to diagnose fault by acoustic emission signal. It is found that SVD is an effective method to filter out noise and extract fault feature. However, important fault information losses because of spurious mode and heavy noise interference in IMF.
To solve this problem, this study introduces a multi-layer filtering (hybrid filtering) method to extract weak fault feature of bearing. In the first layer, vibration signal is decomposed to obtain IMFs by CEEMDAN. Then, a de-trended fluctuation analysis (DFA) is utilized to identify effective IMF and spurious mode adaptively. In second layer, a non-local mean (NLM) de-noised method is used to filter out noise in each IMF. In last layer, SVD is used to remove residual noise in vibration signal. The hybrid filtering method is applied to simulated and measured vibration signal from rolling bearing. The result indicates that this method extracts weak fault effectively and operate well for bearing fault diagnose.
The remainder of this paper is organized as follows: Section 2 introduces the CEEMDAN algorithm. Section 3 describes the hybrid filtering algorithm. Section 4 verifies the effectiveness of the proposed algorithm for fault extraction. Section 5 presents the conclusion.
2. CEEMDAN algorithm
Traditional EEMD have high computational cost and residue noise because of interaction of signal and added noise. To solve this problem, CEEMDAN is introduced in reference [16]. Principle of CEEMDAN is as follows:
(1) Generate the noisy signal xi(t), xi(t)=x(t)+ω0ξi(t) (i=1,…, N), where ξi(t) is white noise with unit variance, and ω0 is coefficient of added white noise.
(2) Obtain the first IMF (ci1(t)) of each noisy signal xi(t) by EMD;
(3) Obtain the first decomposed IMF (c1(t)) by taking average of each ci1(t):
(4) Compute the first residue by Eq. (2);
(5) Apply EMD to decompose r1(t)+w1E1(εi(t)), and extract the first IMF to obtain the decomposed second IMF (c2(t)), where Em(⋅) signifies that EMD is used to decompose xi(t) to get the mth IMF:
(6) Compute the mth residue (m= 2,…, K), and extract the first decomposed IMF to obtain (m+1)th decomposed IMF by Eq. (4):
(7) Repeat above steps until the residue R(t) contain less than two extrema:
The signal x(t) can be written as:
3. Hybrid filtering method
3.1. Selection of spurious IMFs
When CEEMDAN is used to decompose vibration signal, the obtained IMF contains periodic impulsive component (IPIC) and non-IPIC (NIPIC). The IMF with impulsive component can reflect physical meaning of vibration signal, and the residue is a non-effective IMF, which is called “spurious mode” or “spurious IMF”. It is necessary to develop a method to distinguish IPIC and NIPIC effectively. It is found that there is obvious fluctuation difference between IPIC and NIPIC. Recently, DFA [21-23] has been regarded as analysis tool of scale and is suitable to analyze fluctuation of non-linear and non-stationary time series. Thus, DFA is proposed to evaluate the fluctuation of IPIC and NIPIC. The following is the principle of DFA:
(1) Generate the integrated time series, where ˉx indicates the mean of time series x(i):
(2) Divide y(k) into n length sections;
(3) Use least square method to determine the local trend yn(k);
(4) Get fluctuation function F(n) by yn(k):
(5) Obtain different F(n) using different length segments;
(6) Calculate slope between log(F(n)) and logk, where the slope is called Hurst exponent α:
Reference [24] indicated that the larger value of Hurst exponent (α) is, the smoother a time series is. Numerous experiments found that NIPIC is smoother than IPIC. It means that Hurst exponent (α) decreases with the increase of IMF index. When the Hurst exponent (α) of the (k+1)th IMF become large suddenly, and the IMF that corresponds to the index is a spurious mode. Then, effective vibration signals with impulsive components are adaptively constructed by subtracting first kth IMFs. The identified steps are summarized as follows:
(1) Decompose signal x(t) into a set of IMFs by CEEMDAN:
(2) Calculate Hurst exponent (αi) of every IMF by DFA (i= 1,…, N);
(3) Identify index of the relevant kth from αi:
(4) Extract all IMFs up to index kth.
To verify the effectiveness of proposed method, the following simulated vibration signal [25] is used to identify IPIC and NIPIC:
where, y(t) is noisy signal, x(t) indicates the real signal and n(t) is the noise. Eq. (13) and (14) is expression of x(t):
here, a is the modulated factor, and T is the sample period. k is the sample points (k= 1000), fm is fault frequency of bearing, fr is the rotation frequency, fc1 and fc2 are the carrier frequencies from system resonance. Table 1 are the parameters of simulated vibration signal. Where the sample rate is 1.6 kHz, and the input signal-to-noise ratio (SNRin) is −10 dB.
Table 1Parameters of the simulated vibration signal
a | T (s) | fm (Hz) | fr (Hz) | fc1 (Hz) | fc2 (Hz) |
800 | 1/16000 | 160 | 30 | 2000 | 7000 |
Fig. 1(a) and (b) are the simulated noisy signal and the corresponding fast Fourier transform (FFT), respectively. It is found that FFT cannot identify characteristic frequency of simulated fault signal, and extract only the carrier frequencies (fc1 and fc2).
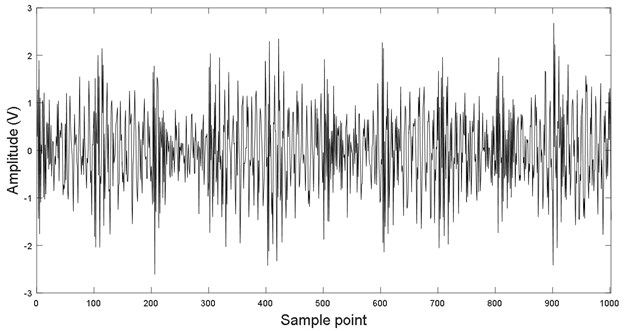
To extract the fault frequency, CEEMDAN is first used to decompose noisy vibration signals. Fig. 2 are the decomposed IMFs. It is found that there are nine IMFs and residue. The first five IMFs contain PICs obviously, and periodic information of fifth IMF is shown red box in the fifth IMF. However, it is obvious that the sixth IMF mainly contains NPIC. To identify the PIC, DFA is used to calculate Hurst exponent (α) of each IMF to distinguish PIC and NPIC. Fig. 3 demonstrates the DFA of IMF1, and Fig. 4 exhibits the Hurst exponent (α) for all IMFs. It is found that Hurst exponent (α) decreases with increase of IMF index. The Hurst exponent (α) of IMF6 rapidly become large when Hurst exponent (α) of IMF5 is smallest. It indicates that the spurious modes are from IMF6 to IMF10 (expected residue). The identified result is in accordance with the analysis result in Fig. 2. It means that the proposed DFA method is suitable to identify IPIC and NIPIC. Fig. 5 presents the combination of signals with first five IMFs. It is found that the signal still contains heavy noise.
Fig. 1Noisy signal and corresponding FFT
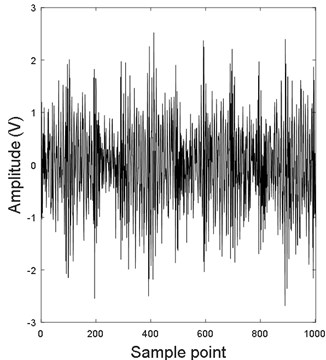
a) Noisy signal
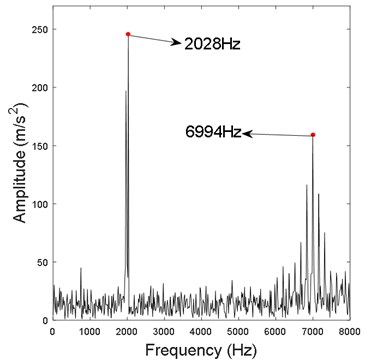
b) Noisy signal FFT
Fig. 2CEEMDAN decomposed IMFs for simulation vibration signal
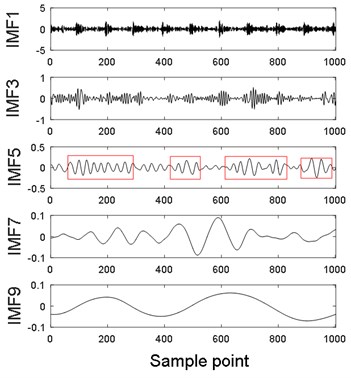
a)
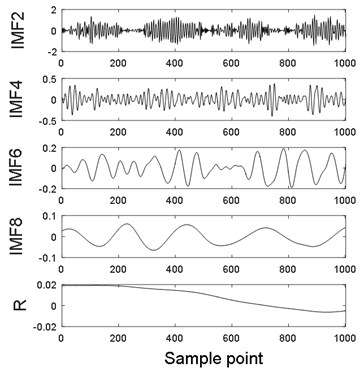
b)
Fig. 3DFA of IMF1
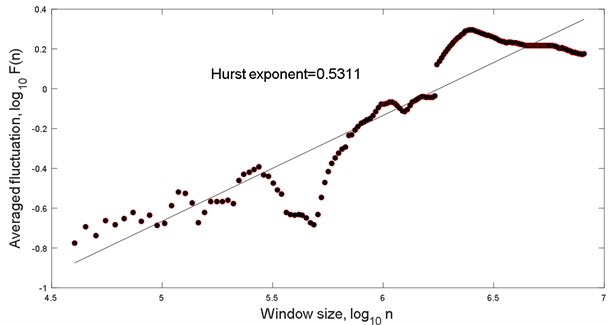
Fig. 4Hurst exponent of each IMF
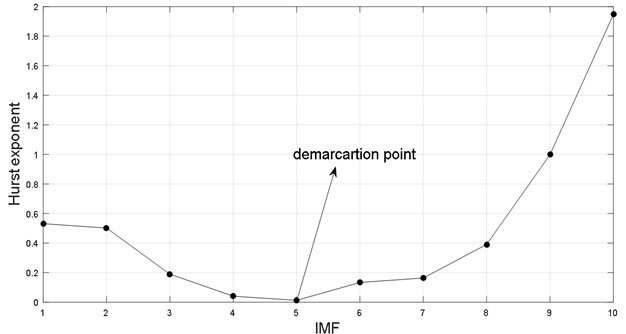
Fig. 5Summed signal of the first five IMFs
3.2. Non-local mean (NLM) de-noising method
In this section, NLM method is used to filter out noise in each IMF. Furthermore, the method also improves effectiveness of third layer filtering to enhance feature extraction of fault signal. NLM [26-28] is first used in image processing to process 2D signal rather than 1D signal. In this paper, NLM is introduced to be considered as pre-filter of third layer filtering. The following is the principle of NLM:
where x(t) is the real signal, and n(t) is the noisy signal. Recovered signal ˜x(t) is the weighted sum of value at point t being located in “search neighborhood” N(s) and is expressed as:
where, s is sample point. The expression of Z(s) is the following:
The weights w(s,t) are as follows:
where, λ is the bandwidth, Δ is the local patch of surrounding s and contains LΔ length samples.
The second filtering layer principle is expressed as follows:
(1) The NLM method is used to filter out noise of identified PIC;
(2) The filtered PIC are combined to obtain the second layer de-noised signal.
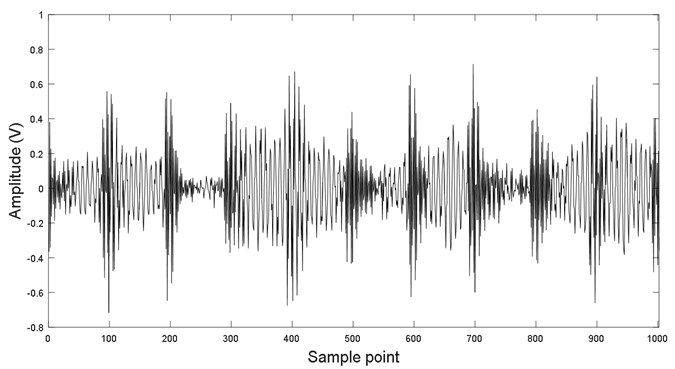
Fig. 6 depicts filtered result. It is found that periodic impulse component is more obvious than signal in Fig. 5 (parameter in NLM is determined on the basis of SURE criterion [29]).
3.3. Singular value decomposition de-noising
3.3.1. Singular value decomposition principle
The final layer filtering utilizes SVD to remove extra noise. SVD demonstrates an excellent performance in noise removal and is extensively used in fault extraction of rolling bearing [30-32]. It is assumed that noisy series x(k) is expressed as:
Fig. 6Second filtering layer
Signal x(k) is consisted of real signal and noise. It is expressed as follows:
where, s(k) is real signal, and n(k) is noise. The following is Hankel matrix H(H∈Rp×q) of signal x(k):
where, p+q-1=N, p≥q, and H(i,j)=x(i+j-1). Eq. (21) is furtherly expressed as:
The Eq. (22) is simplified as:
here, Hs(i,j)=s(i+j-1) and Hn(i,j)=n(i+j-1) are Hankel matrices of the real signal and noisy signal, respectively. Thus, the main task is to found Hs to obtain de-noised signal ˆs(k). Here, H is first decomposed into the following expression:
here, U(U∈Rp×q) and V(V∈Rp×q) are two orthogonal matrices, D is a diagonal matrix and defined as D=[diag(σ1,σ2,⋯,σq),O], O is a zero matrix, and σ1>σ2,⋯,σi,⋯,>σq>0. Here, σi is assumed to be last singular value of Hankel matrix Hs. Other values are set to zero if the previous i singular values are preserved. Then, reverse re-construction can obtain the de-noised signal. Thus, parameter i must be determined. The next part uses a relative energy difference spectrum of a singular value to identify important parameter i.
3.3.2. Relative energy difference spectrum
In principle, real signal s(k) and noise n(k) are non-correlated. The energy of the real signal is concentrated. However, the noise is relatively decentralized. It indicates that the singular values of real signal components are rounded to certain numerical value, and singular value of noise components are around other numerical value. It means that the energy of first i singular value (singular value of real signal component) is different from energy of the others (r-i) singular value (noise component). If the energy difference of adjacent singular value is done, it is found that the energy difference of singular value are almost same as energy for real signal component or noise component, respectively. However, the energy difference of singular value is biggest in demarcation point of real signal component and noise component. It proves that the relative energy difference spectrum of SVD changes at the demarcation point of singular value of the real and noise signal components abruptly. This paper introduces the following relative energy difference spectrum to identify singular value σi:
when the singular value of real signal components are extracted by identifying demarcation point by proposed method, the de-noised signal can been obtained by Eq. (24). It means that the signal can been re-constructed by finding the maximum σi. Here, the size of Hankel matrix is determined on the basis of Reference [33].
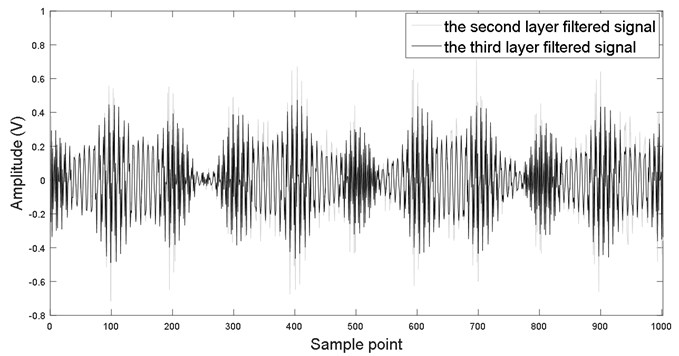
Now, the proposed de-noising method is used to filter out residual noise of vibration signal in Fig. 6. Fig. 7 displays singular value of Hankel matrix. Figs. 8(a) and (b) depict the local large of singular value (first 50 singular values are displayed) and the corresponding relative energy difference spectrum, respectively. It is found that the 10th singular value is the maximum in all different spectra. Thus, the first 10 singular values are selected to re-construct the de-noised signal. Fig. 9 are comparison result of second-layer and third-layer filtered signal. It is found that periodical information of the third layer filtered signal is more obvious than that of the second layer.
Fig. 7Singular value
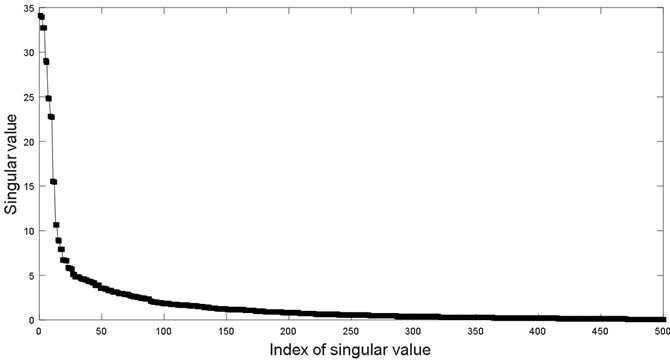
Fig. 8Singular value and corresponding difference spectrum
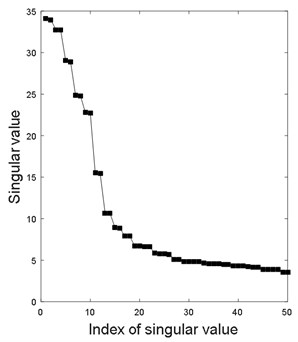
a) Singular value
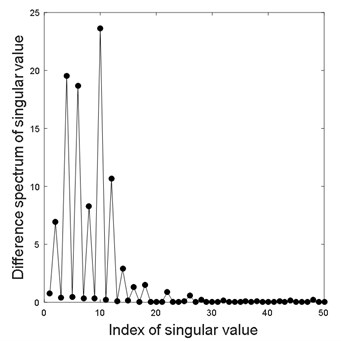
b) Difference spectrum of singular value
Fig. 9Comparing of filtered signal with second the third layer filtering method
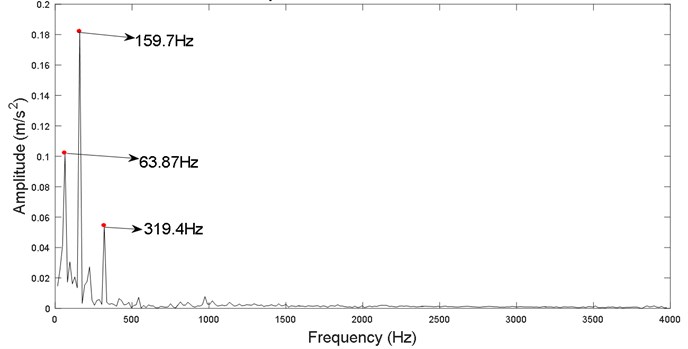
Analysis technique of envelope spectrum is used to extract fault feature. Fig. 10 presents the envelope spectrum of the filtered signal. It is found that fault characteristics 1X and 2X (159.7 and 319.4 Hz, respectively) and rotational frequency 2X (63.87 Hz) are extracted in the envelope spectrum. It indicates that the proposed hybrid filtering method is effective in extracting fault frequency of bearing.
Fig. 10Envelope spectrum of hybrid filtered signal
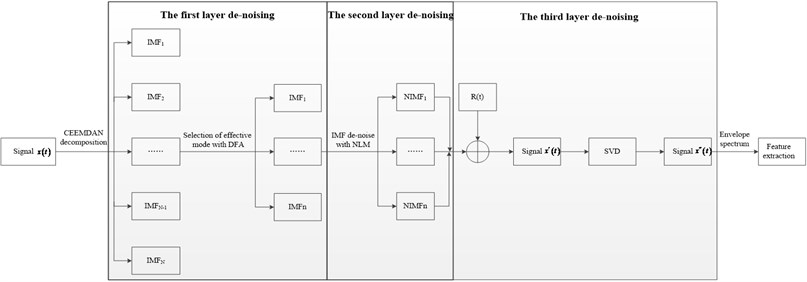
Finally, the three-layer de-noising method is presented as follows:
(1) Decompose vibrated signal x(t) into a set of IMFs by CEEMDAN;
(2) Select the real and spurious IMF component by DFA adaptively;
(3) Filter out noise in each real IMF by NLM;
(4) Combine the filtered IMFs to obtain effective signal x'(t);
(5) Use SVD to filter out noise to obtain signal x''(t);
(6) Calculate the envelope spectrum of signal x''(t);
(7) Extract the weak feature of vibration signal x''(t);
Fig. 11 is flow chart of the hybrid filtering method.
Fig. 11Flow chart of hybrid filtering method
4. Results and discussions
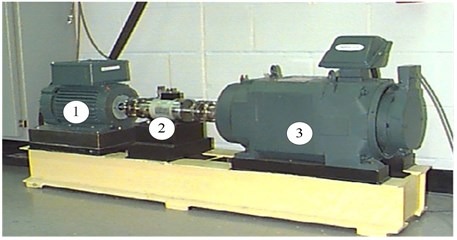
In this section, the fault data from the website of Case Western Reserve University [34] is used to evaluate the performance of proposed method. Fig. 12 exhibits the experiment rig which consists of a 2 HP motor, a torque transducer, a dynamometer, and control electronics. The test bearing is 6205-2RS SKF deep groove ball bearing. Table 2 is the bearing parameters.
Table 2Bearing parameters for 6205-2RS deep groove ball bearing
Bearing type | Ball number n | Pitch diameter D (mm) | Ball diameter d (mm) | Contact angle α (°) |
6205-2RS | 9 | 52 | 8 | 0 |
Fig. 12Bearing experiment rig: (1) – motor, (2) – torque transducer, (3) – dynamometer
The theoretical characteristic frequency of inner race fin can be calculated using the following expression:
where, fr is the rotation frequency.
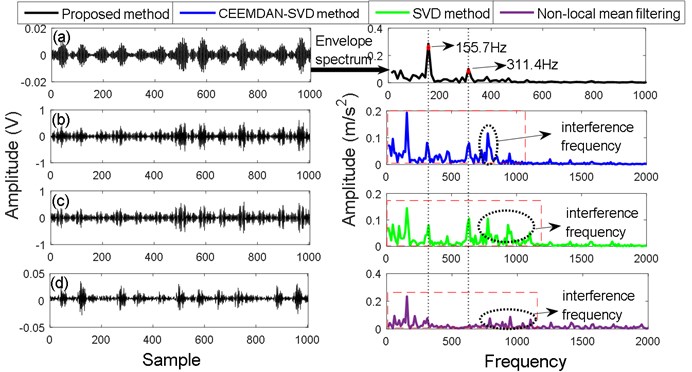
In this experiment, single point fault is introduced to the test bearing using electro-discharge machining with fault diameters of 0.018, 0.036, 0.054, and 0.072 mm. Fault data from fault diameter of 0.018 mm is used to identify fault recognition as early as possible. The sample rate is 12 kHz. The selected data length is 1000. Figs. 13(a) and (b) display the time domain signal and corresponding FFT, respectively. It is found that FFT of vibration signal do not extract frequency feature of vibration signal, and the vibration signal contain heavy noise. Here, the proposed method is first used to remove noise by flow chart in Fig. 11, then analysis technology of envelope spectrum of vibration signal is employed to extract fault feature. Moreover, typical filtering methods, namely, EMD-SVD [25], SVD, and NLM, are also used to extract fault feature for the same vibration signal. The filtered result and the corresponding envelope spectrum are demonstrated in Figs. 14(b), (c), and (d). It is found that more noise is observed using EMD-SVD, SVD, and NLM methods than proposed method (CEEMAN-DFA-NLM-SVD) for a time domain waveform. Moreover, for envelope spectrum, it also has similar result and contains a noisy frequency component (high-frequency component or interference frequency as shown elliptical annotation in red box in Fig. 14) among EMD-SVD, SVD, and NLM methods (envelope spectrum is only displayed in the first 2 kHz). However, the envelope spectrum of the proposed method does not reflect a high frequency and only reflect fault frequency of bearing (low-frequency information in Fig. 14). It indicates that the proposed method more effectively remove noise than other de-noising methods. The envelope spectrum of the CEEMAN-DFA-NLM-SVD presents the maximum frequency (155.7 Hz) and multiplication frequency (311.4 Hz). The identified frequency is nearly consistent with the theoretical frequency (151.44 Hz) by Eq. (26). For the EMD-SVD, SVD method, although the fault frequency and corresponding multiplication frequency can be reflected in Fig. 14, the multiplication frequency is difficult to identify because of interference frequency. For NLM method, it is not found fault frequency and multiplication frequency in the envelope spectrum, and it also produce the interference frequency in red box in Fig. 14. In addition, the amplitude of envelope spectrum of proposed method is bigger than the other methods. It makes the fault frequency be more identified. Based on above analysis, the proposed method demonstrates an outstanding performance than the other filtering methods.
Fig. 13Noisy signal and corresponding FFT
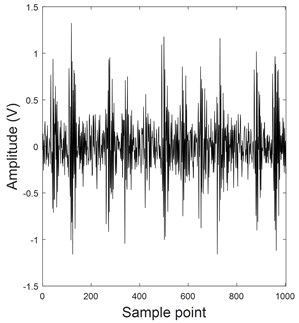
a) Noisy signal
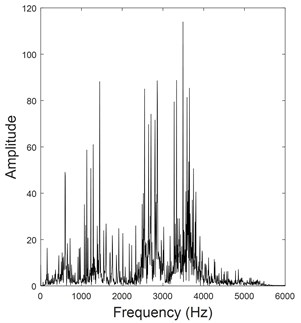
b) Noisy signal FFT
Fig. 14Comparing of filtered results and feature extraction
5. Conclusions
This study proposes a novel hybrid filtering method based on the CEEMDAN-DFA-NLM-SVD to extract weak fault features under heavy background noise. On the basis of the abovementioned research results, the conclusions are as follows:
1) The first layer filtering introduces criterion of the smallest Hurst exponent to identify the periodic impulse among the IMFs by CEEMDAN adaptively.
2) The second filtering layer uses NLM to filter out noise in each IMF that contains a PIC.
3) In the final layer filtering, the relative energy difference spectrum, which identifies the singular value of Hankel matrix of real signal, is applied to adaptively remove noise for the second-layer filtered signal.
Finally, the proposed method is used to effectively filter out noise and extract weak fault features of the simulation and measured signal. Furthermore, the method is also compared with typical filtering methods, respectively. The result indicates that the proposed method demonstrates the optimum performance among the filtering methods for extracting fault feature of bearing.
References
-
Zhang L., Xiong G., Liu H., et al. Bearing fault diagnosis using multi-scale entropy and adaptive neuro-fuzzy inference. Expert Systems with Applications, Vol. 37, Issue 8, 2010, p. 6077-6085.
-
Rai V. K., Mohanty A. R. Bearing fault diagnosis using FFT of intrinsic mode functions in Hilbert-Huang transform. Mechanical Systems and Signal Processing, Vol. 21, Issue 6, 2007, p. 2607-2615.
-
Khadersab A., Shivakumar S. Vibration analysis techniques for rotating machinery and its effect on bearing faults. Procedia Manufacturing, Vol. 20, 2018, p. 247-252.
-
Deng F., Yang S., Tang G., et al. Self adaptive multi-scale morphology AVG-Hat filter and its application to fault feature extraction for wheel bearing. Measurement Science and Technology, Vol. 28, Issue 4, 2017, p. 045011.
-
Bluestein L. I. A linear filtering approach to the computation of discrete Fourier transform. IEEE Transactions on Audio and Electroacoustics, Vol. 18, Issue 4, 1970, p. 451-455.
-
Aminian M., Aminian F. Neural-network based analog-circuit fault diagnosis using wavelet transform as preprocessor. IEEE Transactions on Circuits and Systems II: Analog and Digital Signal Processing, Vol. 47, Issue 2, 2000, p. 151-156.
-
Lou X., Loparo K. A. Bearing fault diagnosis based on wavelet transform and fuzzy inference. Mechanical Systems and Signal Processing, Vol. 18, Issue 5, 2004, p. 1077-1095.
-
Wu J. D., Chen J. C. Continuous wavelet transform technique for fault signal diagnosis of internal combustion engines. NDT & E International, Vol. 39, Issue 4, 2006, p. 304-311.
-
Huang N. E., Shen Z., Long S. R., et al. The empirical mode decomposition and the Hilbert spectrum for nonlinear and non-stationary time series analysis. Proceedings Mathematical Physical and Engineering Sciences, Vol. 454, Issue 1971, 1998, p. 903-995.
-
Yu D., Cheng J., Yang Y. Application of EMD method and Hilbert spectrum to the fault diagnosis of roller bearings. Mechanical Systems and Signal Processing, Vol. 19, Issue 2, 2005, p. 259-270.
-
Cheng J., Yu D., Tang J., et al. Application of frequency family separation method based upon EMD and local Hilbert energy spectrum method to gear fault diagnosis. Mechanism and Machine Theory, Vol. 43, Issue 6, 2008, p. 712-723.
-
Qi K., He Z., Zi Y. Cosine window-based boundary processing method for EMD and its application in rubbing fault diagnosis. Mechanical Systems and Signal Processing, Vol. 21, Issue 7, 2007, p. 2750-2760.
-
Wu Zhaohua, Huang Norden E. Ensemble empirical mode decomposition: a noise-assisted data analysis method. Advances in Adaptive Data Analysis, Vol. 1, Issue 1, 2009, p. 1-41.
-
Yang J., Chen J., Hong R., et al. Multi-scale fault frequency extraction method based on EEMD for slewing bearing fault diagnosis. Lecture Notes in Electrical Engineering, Vol. 334, 2015, p. 363-370.
-
Chen L., Tang G., Zi Y., et al. Improved EEMD applied to rotating machinery fault diagnosis. Applied Mechanics and Materials, Vols. 128-129, 2011, p. 154-159.
-
Torres M. E., Colominas M. A., Schlotthauer G., et al. A complete ensemble empirical mode decomposition with adaptive noise. IEEE International Conference on Acoustics, Speech and Signal Processing, 2011, p. 4144-4147.
-
Kuai M., Cheng G., Pang Y., et al. Research of planetary gear fault diagnosis based on permutation entropy of CEEMDAN and ANFIS. Sensors, Vol. 18, Issue 3, 2018, p. 782.
-
Guo T., Deng Z. An improved EMD method based on the multi-objective optimization and its application to fault feature extraction of rolling bearing. Applied Acoustics, Vol. 127, 2017, p. 46-62.
-
Cheng J., Yu D., Tang J., et al. Application of SVM and SVD technique based on EMD to the fault diagnosis of the rotating machinery. Shock and Vibration, Vol. 16, Issue 1, 2013, p. 89-98.
-
Yang Z. X., Zhong J. H. A hybrid EEMD-based SampEn and SVD for acoustic signal processing and fault diagnosis. Entropy, Vol. 18, Issue 4, 2016, p. 112.
-
Chen Z., Hu K., Carpena P., Bernaola Galvan P., Stanley H. E., Ivanov P. C. Effect of nonlinear filters on detrended fluctuation analysis. Physical Review E, Vol. 71, 2005, p. 011104.
-
Chen Z., Ivanov P. C., Hu K., Stanley H. E. Effect of nonstationarities on detrended fluctuation analysis. Physical Review E, Vol. 65, 2002, p. 041107.
-
Horvatic D., Stanley H. E., Podobnik B. Detrended cross-correlation analysis for non-stationary time series with periodic trends. Europhysics Letters, Vol. 94, 2011, p. 18007.
-
Leistedt S., Dumont M., Lanquart J. P., et al. Characterization of the sleep EEG in acutely depressed men using detrended fluctuation analysis. Clinical Neurophysiology, Vol. 118, Issue 4, 2007, p. 940-950.
-
Han T., Jiang D., Wang N. The fault feature extraction of rolling bearing based on EMD and difference spectrum of singular value. Shock and Vibration, Vol. 2016, 2016, p. 5957179.
-
Buades A., Coll B., Morel J. M. A Review of image denoising algorithms, with a new one. Siam Journal on Multiscale Modeling and Simulation, Vol. 4, Issue 2, 2005, p. 490-530.
-
Yang J., Fan J., Ai D., et al. Local statistics and non-local mean filter for speckle noise reduction in medical ultrasound image. Neurocomputing, Vol. 195, 2016, p. 88-95.
-
Said A. B., Hadjidj R., Melkemi K. E., et al. Multispectral image denoising with optimized vector non-local mean filter. Digital Signal Processing, Vol. 58, 2016, p. 115-126.
-
Ville D. V. D., Kocher M. SURE-based non-local means. IEEE Signal Processing Letters, Vol. 16, Issue 11, 2009, p. 973-976.
-
Qiao Z., Pan Z. SVD principle analysis and fault diagnosis for bearings based on the correlation coefficient. Measurement Science and Technology, Vol. 26, Issue 8, 2015, p. 085014.
-
Jiang H., Chen J., Dong G., et al. Study on Hankel matrix-based SVD and its application in rolling element bearing fault diagnosis. Mechanical Systems and Signal Processing, Vols. 52-53, Issue 1, 2015, p. 338-359.
-
Golafshan R., Sanliturk K. Y. SVD and Hankel matrix based de-noising approach for ball bearing fault detection and its assessment using artificial faults. Mechanical Systems and Signal Processing, Vols. 70-71, 2016, p. 36-50.
-
Zhao X., Ye B. Selection of effective singular values using difference spectrum and its application to fault diagnosis of headstock. Mechanical Systems and Signal Processing, Vol. 25, Issue 5, 2011, p. 1617-1631.
-
Loparo K. A. Bearing data Center. Case Western Reserve University, 2000. http://csegroups.case.edu/bearingdatacenter/home.

