Abstract
In this paper, PATRAN software was used to establish a complete 3D finite element model of human ears, and it was then combined with NASTRAN software to analyze frequency responses. This paper conducted a detailed analysis on the dynamic parameters including umbo and stapes displacements of normal human ears under sound pressures 90 dB and 105 dB. The numerically computational results were compared with experimental data. When the analyzed frequency was less than 1000 Hz, the computational result of numerical simulation was well consistent with the upper limit. When the analyzed frequency was more than 1000 Hz, the computational result of numerical simulation was well consistent with the lower limit. Therefore, the numerically computational model was reliable. In addition, based on the verified model, this paper studied vibration characteristics of spiral basilar membrane after replacing artificial auditory ossicle based on the whole hearing system, and found that vibration characteristics of spiral basilar membrane had an obvious change at low and high frequencies after replacing artificial auditory ossicle TORP. Using finite element method to analyze vibration characteristics of spiral basilar membrane can well predict the hearing recovery effect after replacing artificial auditory ossicle. Compared with normal ears, the vibration level of spiral basilar membrane after replacing artificial auditory ossicle has slowed down in 100 Hz-600 Hz, 2000 Hz-4000 Hz and 7000 Hz-10000 Hz, and has been strengthened in 600 Hz-2000 Hz and 4000 Hz-7000 Hz, which provided some help for the hearing recovery at the high-frequency band.
1. Introduction
The hearing system of human ear is a dynamical system with very exquisite and complex structures, whose researches have to depend on mechanics. A mechanical analysis on the hearing system of human ears will provide a good theoretical basis for the clinical medicine of ears. The combination of mechanics, acoustics and medicine can offer a better help to the long-term hearing recovery effect of patients after operation.
With the continuous development of clinical medical researches on ears, a number of scholars have conducted studies on such complex and exquisite structures of human ears in the aspect of ear clinical medicine, theoretical and numerical analysis and obtained some achievements. Gan [1] used finite element method to build a finite element model including outer ear canal, middle ears and middle ear cavity, and conducted a simulation analysis on the influence of tympanic membrane perforation on the transmission characteristics of middle ears. Results showed that changes in the sound pressure of middle ear cavity were not only related to the shape and position of perforation, but also greatly responded to frequency. Gan [2] again established a complete 3D finite element model of total human ears including external auditory canal, tympanic membrane, auditory ossicle, ligament, muscle, middle ear cavity and cochlear model, used the model to conduct a numerical computation for sound-solid-liquid coupling, made an analysis on frequency responses and obtained some vibration characteristics of spiral basilar membrane. Then, Gan [3] used finite element model to simulate the influence of middle ear effusion on the sound conduction of human ears firstly. Yao [4] built a finite element mode of middle ears based on clinical CT scanning data, applied the conduction and vibration principle of dynamics to carry out a numerical computation and analysis on middle ear structures and obtained the distribution of tympanic membrane amplitude and the stress field of auditory ossicle chain structure. Then, Yao [5] established the geometric model of human ear structures through writing C++ program to read the solid element of CT data, and studied the impact of auditory ossicle ligament, tendon sclerosis and resection and artificial stapes replacement on sound conduction. Simulating the computational result of pathological ears could explain the influence of lesions on sound conduction from the perspective of mechanics and provide references for the treatment of pathological ears. In recent years, a large number of scholars have conducted in-depth studies on the material properties and constitutive relationship of various tissues of human ears [6], providing a lot of valuable materials for researches on human ears. In addition, some structural and nonlinear constitutive relationships of human ears started to be introduced into finite element model [7].
Conductive deafness was one of the main diseases of an auditory system, so it is urgent to find better treatment approaches for the conductive deafness. Therefore, researches on artificial auditory ossicle become very important. In recent years, many experts have conducted clinical researches and finite element simulation analysis to artificial auditory ossicle. Coffey [8] researched postoperative auditory recovery after replacement of TORP with different materials. Beutner [9] applied new technologies to achieve firmer and more stable connection of artificial auditory ossicle TORP. Huttenbrink [10] conducted an experimental research on ear audition improvement after the TORP replacement operation. However, the mentioned researches mainly studied the middle ears. Compared with middle ears, inner ears are a more complex structure. A lot of studies have been conducted on middle ears. Currently, researches on ear structure should focus on inner ears. Researches which make breakthroughs in inner ears will greatly contribute to the subject. Some experts and scholars have conducted experimental studies, numerical analysis and analytical derivation on inner ears [11-16]. Currently, geometrical characteristics of previous finite element models have been very simplified and most of finite element models have simulated and analyzed the influence of sound conduction characteristics of middle ears. A complete model of human ears has seldom been reported. In addition, studies on dynamic characteristics of spiral inner ears and basilar membrane are very few.
This paper applied PATRAN software to establish a complete finite element model of human ear hearing system which contained outer ears (auricular and external auditory canal), middle ears (tympanic membrane, malleus, incus, stapes, all ligaments and tendons), and spiral inner ears (spiral basilar membrane, scala vestibuli, scala tympani, membranous cochlea, vestibular membrane, helicotrema, oval window and round window). Then, NASTRAN software was used to analyze frequency responses of the finite element model. An analysis on dynamic parameters including umbo and stapes displacements of normal human ear under sound pressures 90 dB and 105 dB was conducted. The numerically computational results were compared with experimental data and verified the correctness of finite element model. In addition, this paper also studied vibration characteristics of spiral basilar membrane after replacing artificial auditory ossicle based on the whole hearing system, and found that vibration characteristics of spiral basilar membrane had an obvious change at low and high frequencies after replacing artificial auditory ossicle TORP and had more help for the auditory recovery at the high-frequency band.
2. Establishment of the finite element model
2.1. Governing equations of coupling effects
In this study, the commercial software NASTRAN was used to compute the coupling of human ears between fluid and solid. The governing equations can be written, as below.:
In this equation, [Me] is mass matrix of the coupled solid, [Mfs] is node mass matrix, [Mpe] is mass matrix of the coupled fluid, [Ce] is the structural damping matrix, [Cpe] is damping matrix of the coupled fluid, [Ke] is stiffness matrix of the coupled solid, [Kpe] is stiffness matrix of the coupled fluid, [Kfs] is stiffness matrix of the coupling, [Re] is transition matrix of the coupling interface, ue is the displacement matrix, and pe is pressure matrix.
In the coupling model, the air in the auditory canal, ear cavity and lymph fluid were considered as the coupled fluid, while the other structures in this coupling model were considered as the coupled solid. The interface between the fluid and solid were considered the coupled surface. In order to realize the coupling between the fluid and solid, the solid elements will be mapped to the fluid elements. Therefore, the fluid elements will obtain all the characteristics of the solid elements. All the processes will be completed in the commercial software NASTRAN.
2.2. Material properties
Through referring to material properties of middle ears and inner ears in published papers [17-22], values of material properties in the finite element model of inner ears were as follows: Oval window: elastic modulus E= 0.2 MPa, Poisson’s ratio μ= 0.1, density ρ= 1200 kg/m3 and damping coefficient β= 0.5×10⁻⁴; Round window: elastic modulus E= 0.35 MPa, damping coefficient β= 0.5×10⁻⁴ and Poisson’s ratio μ= 0.3. Fluid (scala vestibuli, scala tympani, cochlear duct, 3 semicircular canals and lymph in vestibule): density ρ= 1000 kg/m3, sound velocity C= 1400 m/s, viscous damping D= 0.001 N·S/m and damping coefficient β= 1.0×10⁻⁴. Spiral basilar membrane: With changes in the length direction of spiral basilar membrane, elastic modulus linearly reduced from 50MPa at the bottom of cochlea to 15 MPa in the middle of cochlea and then to 3 MPa at the top of cochlea. With a linear change, damping coefficient β increased from 0.2×10⁻³ at the bottom to 0.1×10⁻² at the top. Poisson’s ratio was about 0.3.
2.3. Boundary conditions
As boundary conditions were required in the computation of finite element models, we appropriately set boundary conditions for some tissues of human ears according to structural characteristics of human ears, connection relationship and correlated characteristics between various structures of human ears. The following was specific boundary conditions:
1) Applied surface pressures including 90 dB SPL (0.632 Pa) and 105 dB SPL (3.56 Pa) to the external auditory canal or tympanic membrane to simulate pure tone (100 Hz-10000 Hz).
2) The connection between soft tissues (tympanic membrane tensor, malleus suspensory ligament, anterior ligament of malleus, malleus collateral ligament, incus suspensory ligament, posterior ligament of incus and stapedius) and temporal bone was considered as a fixed constraint (constrained all displacements and rotations).
3) The external rim of tympanic membrane ring ligament was considered as a hinge constraint (constrained all displacements rather than rotations).
4) The external rim of stapes bottom ring ligament was considered as a fixed constraint (constrained all displacements and rotations).
5) The external rim of oval window and round window was considered as a fixed constraint (constrained all displacements and rotations).
6) The edge of three sides of basilar membrane (both sides and cochlear bottom) was considered as a hinge constraint (constrained all displacements rather than rotations).
7) The wall of external auditory canal and labyrinthine wall of inner ears were set as relatively rigid walls.
8) Tympanic membrane, stapes and ring ligament were fluid-solid coupling interfaces.
2.4. The finite element model
PATRAN software was used to reconstruct a complete 3D finite element model of human ears including outer ears (auricula and external auditory canal), middle ears (tympanic membrane, malleus, incus, stapes, incudomalleolar joint, incudostapedial joint, ligaments and tendons), and spiral inner ears (vestibuli, 3 semicircular canals, scala vestibuli, scala tympani, cochlear duct, helicotrema, spiral basilar membrane, vestibular membrane, membrane tectoria, oval window and round window). In order to obtain a finite element model with better mesh quality and amount, we have established four sets of meshes, and their computational results were shown in Table 1.
Table 1Influences of different mesh amounts on computational results
Mesh | Mesh amount | Stapes amplitude at 1000 Hz (mm) | Computational time (s) |
1 | 168907 | 4.5603E-05 | 1335 |
2 | 230866 | 5.1014E-05 | 1408 |
3 | 278960 | 5.9032E-05 | 1500 |
4 | 430877 | 5.9122E-05 | 3060 |
It was shown in Table 1 that the computed stapes amplitude accuracy of the second set of meshes increased by 11.8 % compared with the first set of meshes, while the computational time increased by 5.4 %; the computed stapes amplitude accuracy of the third set of meshes increased by 15.7 % compared with the second set of meshes, while the computational time increased by 6.5 %; the computed stapes amplitude accuracy of the fourth set of meshes increased by 0.15 % compared with the third set of meshes, while the computational time increased by 104 %. Computational accuracy of the third set of meshes increased greatly compared with the top two sets of meshes while the computational time only increased slightly. Computational accuracy of the fourth set of meshes was only improved slightly compared with the third set of meshes while the computational time was doubled. Therefore, dimensions of the third set of meshes were finally adopted for mesh division. In this way, computational accuracy could be ensured, and computational time could be reduced. A complete finite element model of human ear was shown in Fig. 1. Finally, this paper applied NASTRAN software to conduct a dynamic analysis on three-dimensional fluid-solid coupling.
Fig. 1A complete finite element model of human ear
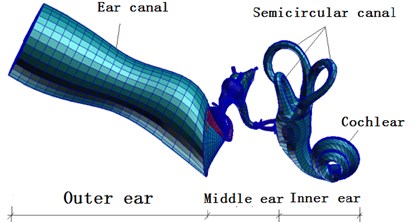
Meshes of finite element model of external auditory canal were divided into as follows: 7581 nodes, 600 six-node pentahedral elements and 6600 eight-node hexahedral elements whose attribute was defined as fluid. Meshes of finite element model of middle ears were divided into as follows: (1) Tympanic membrane: 361 nodes, 30 three-node triangle elements and 330 four-node quadrangular elements whose attribute was defined as 2D-Membrane. (2) Tympanic membrane-malleus connector: 264 nodes, 135 eight-node hexahedral elements whose attribute was defined as solid. (3) Auditory ossicle-ligament-tendon: 6254 nodes, 60 eight-node hexahedral elements and 26567 four-node tetrahedral elements whose attribute was defined as solid. Meshes of finite element model of inner ears were divided into as follows: (1) Scala tympani: 7878 nodes, 6200 eight-node hexahedral elements whose attribute was defined as fluid. (2) Scala vestibuli: 3131 nodes and 1900 eight-node hexahedral elements whose attribute was defined as fluid. (3) Cochlear duct: 7878 nodes and 6400 eight-node hexahedral elements whose attribute was defined as fluid. (4) Helicotrema: 990 nodes and 725 eight-node hexahedral elements whose attribute was defined as fluid. (5) Oval windows (vestibular window): 98 nodes and 83 four-node quadrangular elements whose attribute was defined as 2D-Membrane. (6) Round window: 78 nodes and 62 four-node quadrangular elements whose attribute was defined as 2D-Membrane. (7) Basilar membranes: 303 nodes and 400 four-node quadrangular elements whose attribute was defined as 2D-Membrane. (8) Osseous spiral plates: 808 nodes and 600 four-node quadrangular elements whose attribute was defined as 2D-Membrane. (9) Vestibular membranes: 1111 nodes and 1000 four-node quadrangular elements whose attribute was defined as 2D-Membrane. (10) Cover: 4670 nodes and 4240 four-node quadrangular elements whose attribute was defined as 2D-Membrane.
3. The computational result and discussion
3.1. Verification of the finite element model
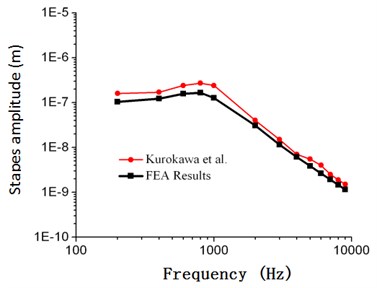
Without considering the influence of external auditory canal, sound pressures including 90 dB SPL (0.632 Pa) and 105 dB (3.56 Pa) were applied to tympanic membrane to analyze frequency responses. A simulation analysis was conducted to obtain the frequency-response curve of umbo and stapes, and the computational results were compared with the experimental data of Gan and Kurokawa [23, 24], as shown in Fig. 2 to Fig. 5.
As shown in Fig. 2, frequency response curves of umbo amplitudes obtained through numerical simulation were within the scope of upper and lower limits obtained by Gan. When the computational frequency was less than 1000 Hz, the computational result of numerical simulation was well consistent with the experimental data. When the computational frequency was within 1000 Hz-2000 Hz, the computational result was within the scope of upper and lower limits. When the analyzed frequency was within 2000 Hz to 10000 Hz, the result of numerical simulation was slightly lower than the experimental data of Gan, and the maximum error was less than 18.7 %. As shown in Fig. 3, frequency responses of stapes amplitudes obtained through numerical simulation were also within the scope of upper and lower limits obtained by Gan. Similar to Fig. 2, when the analyzed frequency was less than 1000 Hz, the computational result of numerical simulation was well consistent with the upper limit. When the analyzed frequency was more than 1000 Hz, the computational result of numerical simulation was well consistent with the lower limit. As shown in Fig. 4 and Fig. 5, frequency responses of umbo amplitudes obtained through numerical simulation was well consistent with the experimental data obtained by Kurokawa. The maximum error was only 6.5 %. Therefore, based on the comparison between the numerical and experimental data, the numerically computational model was reliable.
As the external sound caused the vibration of stapes through the vibration of eardrum and ossicular chain, the vibration of stapes caused the response of spiral basilar membrane through cochlear lymph. Therefore, the vibration of stapes was directly related to the response of spiral basilar membrane. The ratio of spiral basilar membrane amplitude to stapes amplitude represented the response of spiral basilar membrane caused by the unit vibration of stapes and clearly reflected amplification characteristics and frequency selectivity of spiral basilar membrane. The spiral basilar membrane was introduced into cochlea, and the sound pressure 90 dB was applied to the entrance of external auditory canal to analyze the frequency response.
Fig. 2Comparison between the numerical and experimental umbo amplitude of Gan (90 dB)
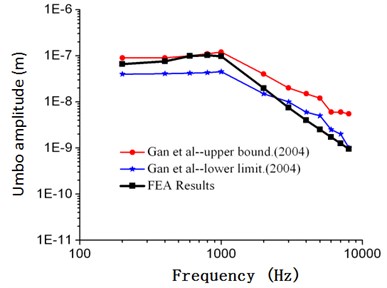
Fig. 3Comparison between the numerical and experimental stapes amplitude of Gan (90 dB)
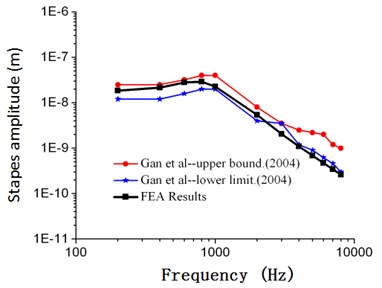
Fig. 4Comparison between the numerical and experimental umbo amplitude of Kurokawa (105 dB)
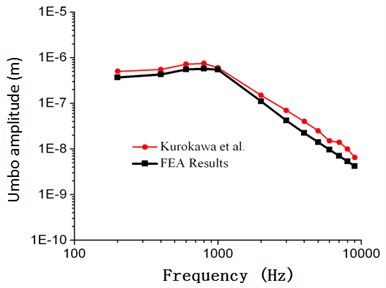
Fig. 5Comparison between the numerical and experimental stapes amplitude of Kurokawa (105 dB)
A simulation analysis was conducted to obtain frequency responses of amplitudes in the center of stapes and at the node of 12 mm from the top to the bottom of spiral basilar membrane. The amplitude ratio of spiral basilar membrane and stapes at the position of 12 mm from the top to the bottom of spiral basilar membrane with frequency was obtained to compare with the experimental data of inner ears, as shown in Fig. 6.
Fig. 6Comparison between the numerical and experimental data of Gundersen and Stenfelt (90 dB)
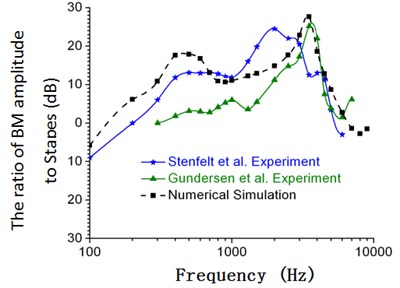
As displayed from Fig. 6, the numerical simulation was slightly higher than the experimental data of Gundersen and Stenfelt. When the analyzed frequency was within 100 Hz to 700 Hz, the maximum error was 15 %. The peak value in this frequency band appeared in 400 Hz. The peak value was between experimental peak values of Gundersen and Stenfelt. When the analyzed frequency was within 700 Hz to 3000 Hz, the numerical simulation was between the experimental data of Gundersen and Stenfelt. When the analyzed frequency was within 3000 Hz to 8000 Hz, the numerical simulation was close to the experimental data of Gundersen. In addition, the change trend and peak values of the numerical simulation were consistent with those of experimental data in the analyzed frequency band. Peak values appeared at 3500 Hz. The maximum error in the frequency band was about 6 %.
Based on the previous analysis, the stapes and umbo data of finite element model in this paper was close to the experimental data in the aspect of peaks and trends, which thus verified the correctness of the computational model. Additionally, this paper verified the correctness of connecting spiral basilar membrane to spiral cochlea through simulating and comparing the vibration of nodes in the spiral basilar membrane with the experimental data of Gundersen and Stenfelt.
3.2. Mechanical characteristics of the fluid-solid coupling
This paper has introduced the spiral basilar membrane into cochlea. The sound pressure 90 dB was applied to the finite element model of the whole hearing system to compute frequency responses at 100 Hz to 10000 Hz. The characteristic frequency 3500 Hz of spiral basilar membrane was obtained, and contours (displacements of ossicular chain, basilar membrane, oval window membrane and round window membrane, and pressures of external auditory canal air and inner ear lymph) of fluid-solid coupling of the whole hearing system at 3500 Hz were extracted, as shown in Fig. 7 to Fig. 10.
Fig. 7Contour of fluid-solid coupling of the whole hearing system
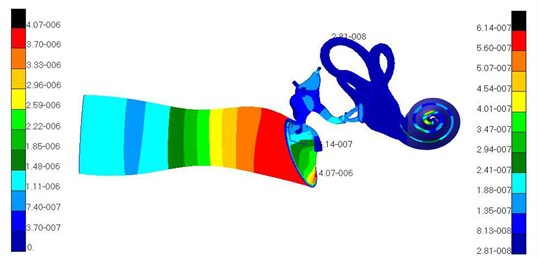
Fig. 7 showed the pressure distribution of air in the external auditory canal. As can be seen from different colors of the contour, it could be found that pressure increased gradually from the entrance of the external auditory canal to tympanic membrane and the pressure of the external auditory canal was the maximum in the tympanic membrane. Thus, it could be seen that the external auditory canal played an important role in boosting pressure.
Fig. 8 showed the displacement distribution of ossicular chain and basilar membrane in middle ears and the maximum displacement in the tympanic membrane. Thus, it could be seen that tympanic membrane was damaged easier than other structures and perforation phenomenon usually appeared in clinical medicine. Fig. 9 presented the displacement distribution of oval window membrane and round window membrane. The maximum displacement of oval window membrane did not appear in the center of oval window membrane, but in one side of oval window membrane, which proved that the motion of oval window membrane maybe lateral or twist vibrations rather than simple vibration vertical to oval window membrane. The displacement distribution of oval window membrane gradually decreased from the center to four directions. The peak value of displacements would appear in one side of oval window membrane. It was a hazardous area where oval window membrane was damaged. In addition, the displacement distribution of round window membrane gradually decreased from the center to four directions under the vibrational excitation of scala tympani lymph. The peak value of displacements appeared in the center of round window membrane. It was predictable that round window membrane was easily damaged in the center.
Fig. 8Displacements of ossicular chain and basilar membrane of middle ears
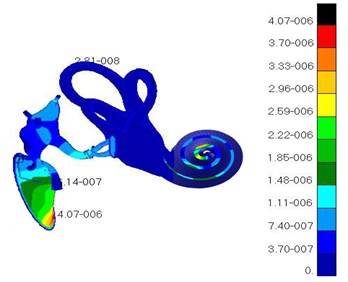
Fig. 9Displacements of different details in the ear
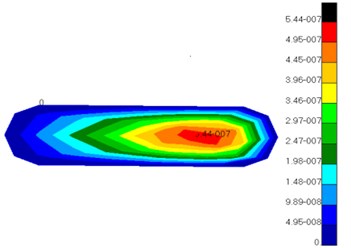
a) Oval window membrane
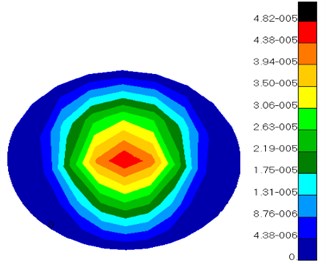
b) Round window membrane
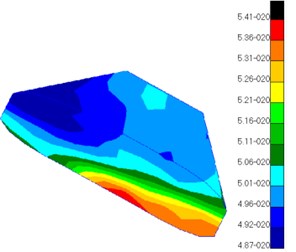
c) Helicotrema
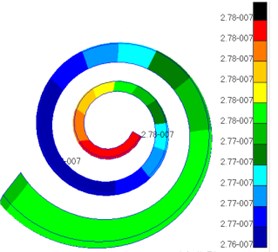
d) Cochlear duct
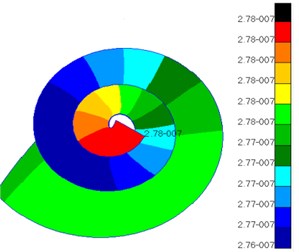
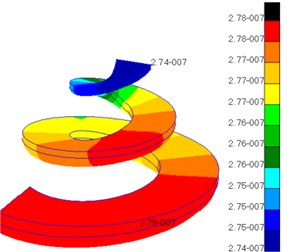
Fig. 10 presented the pressure distribution of inner ear lymph. The pressure of fluid in scala vestibuli gradually increased from the bottom to the top of scala vestibuli and was the maximum at the top. In addition, the pressure distribution of fluid was also different at different positions of cochlear duct. The pressure value of fluid in helicotrema was much smaller than those in cochlear duct, scala vestibuli and scala tympani. The pressure value of fluid in cochlear duct was at e-020 grade while the pressure value of fluid in other positions was at e-007 grade. Compared with the pressure of fluid in other positions, the pressure of fluid in cochlear duct was negligible. The pressure of fluid in scala tympani gradually increased from the bottom to the top of scala tympani and was the maximum at the top. In addition, the pressure distribution of fluid was also different at different positions of scala tympani.
Fig. 10Pressures of lymph in scala vestibul and scala tympani
a) Scala vestibuli
b) Scala tympani
3.3. Analysis on vibration characteristics of spiral basilar membrane after replacing the artificial auditory ossicle
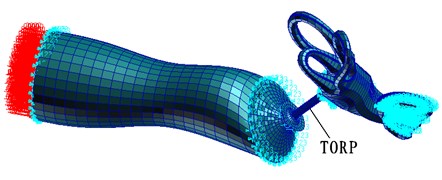
With considering introducing the spiral basilar membrane into the cochlea, this paper applied 90 dB SPL to the entrance of the external auditory canal to compute the frequency response of the whole hearing system with replacing titanium artificial auditory ossicle TORP within 100 Hz-10000 Hz, as shown in Fig. 11. (Meshes of the artificial auditory ossicle TORP were divided into 539 nodes, 100 eight-node hexahedral elements and 325 six-node pentahedral elements whose attribute were defined as solid. Top plate of TORP connected with tympanic membrane and its pommel connected with stapes. Titanium TORP material property [25-29]: Elastic modulus was 116 GPa, density was 4500 kg·m-3 and Poisson’s ratio was 0.33).
Fig. 11Finite element model after replacing the artificial auditory ossicle TORP
As the external sound caused the vibration of stapes through the vibration of eardrum and ossicular chain, the vibration of stapes caused the response of spiral basilar membrane through cochlear lymph. Therefore, the vibration of stapes was directly related to the response of spiral basilar membrane. To clearly reflect amplification characteristics and frequency selectivity of spiral basilar membrane after the replacement of titanium artificial auditory ossicle TORP, this paper used the ratio of basilar membrane amplitude to stapes amplitude which represented the response of spiral basilar membrane caused by unit of stapes vibration. This paper obtained frequency responses of amplitudes in the center of stapes and at the node of 12 mm from the top of spiral basilar membrane to the bottom of cochlea through simulation analysis. Ratio of spiral basilar membrane amplitude to stapes amplitude at the position of 12 mm from the top of spiral basilar membrane to the bottom of cochlea were computed and compared with the basilar membrane of normal human ear, as shown in Fig. 12.
Fig. 12Comparison of characteristics for two kinds of spiral basilar membranes
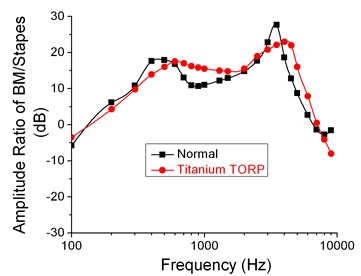
As shown in Fig. 12, the frequency response curve after replacing artificial auditory ossicle TORP was very closer to that in spiral basilar membrane of normal ears when the analyzed frequency was within 100 Hz–10000 Hz. In addition, two peak values of frequency response curves appeared at 600 Hz and 4000Hz respectively. The peak value of frequency responses after replacing artificial auditory ossicle TORP lagged a little behind that of normal ears. Two peak values of normal ears probably appeared at 400 Hz and 3500 Hz.
When the analyzed frequency was within 100 Hz to 600 Hz, ratio of spiral basilar membrane to stapes amplitudes after replacing artificial auditory ossicle TORP gradually increased with frequency, whose curve was slightly lower than that of normal ears. Compared with the computational result of normal ears in the analyzed frequency band, the difference was about 1.03 dB to 3.72 dB and the maximum error was around 5.2 %. When the analyzed frequency was within 600 Hz to 2000 Hz, the computational result after replacing artificial auditory ossicle TORP decreased slowly with frequency, whose curve was higher than that of normal ears. Compared with the computational result of normal ears in the analyzed frequency band, the difference was about 0.67 dB to 5.33 dB and the maximum error was around 8.3 %. When the analyzed frequency was within 2000 Hz to 4000 Hz, the computational result after replacing artificial auditory ossicle TORP increased slowly with frequency, whose curve was slightly lower than that of normal ears. Compared with the computational result of normal ears in the analyzed frequency band, the difference was about 2.01 dB to 5.54 dB and the maximum error was around 10.7 %. When the analyzed frequency was within 4000 Hz to 7000 Hz, the computational result after replacing artificial auditory ossicle TORP linearly decreased with frequency, whose curve was a little higher than that of normal ears. Compared with the computational result of normal ears in the analyzed frequency band, the difference was about 1.89 dB to 9.22 dB and the maximum error was around 9.1 %. When the analyzed frequency was within 7000 Hz to 10000 Hz, the computational result after replacing artificial auditory ossicle TORP was lower than that of normal ears. Compared with the computational result of normal ears in the analyzed frequency band, the difference was about 1.32 dB to 6.43 dB.
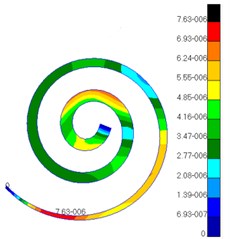
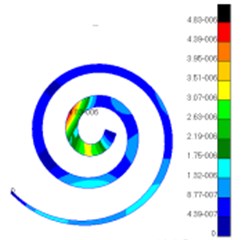
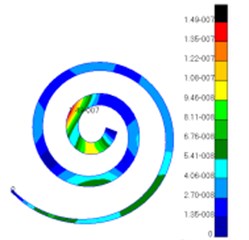
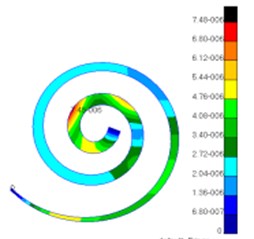
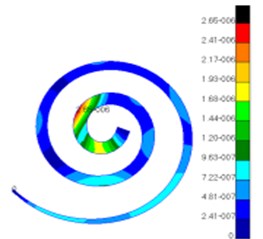
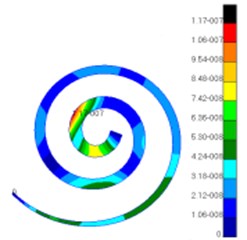
Through simulation, this paper obtained the displacement contour of spiral basilar membrane after replacing artificial auditory ossicle TORP at different frequencies (500 Hz, 1000 Hz and 4000 Hz) to compare with that of normal ears, as shown in Fig. 13 and Fig. 14.
According to the comparison between Fig. 13 and Fig. 14, the displacement value and distribution of spiral basilar membrane after replacing artificial auditory ossicle TORP were very close to that of normal ears at the same frequency and position. The displacement value of normal ears was between 0 mm to 4.83e-006 mm. In addition, the maximum displacement at this moment was close to cupula cochlea and amplitude was 4.83e-006 mm. The displacement value of spiral basilar membrane of human ears after replacing artificial auditory ossicle TORP was between 0 mm to 2.65e-006 mm. In addition, the maximum displacement at this moment was also close to cupula cochlea and amplitude was 2.65e-006 mm. The positions of the maximum displacement were very approximate, but values were a little different. They were not at the same order of magnitude. However, values and displacement distribution were very close.
Fig. 13Displacements of spiral basilar membrane of normal ears at different frequencies
a)
b)
c)
Fig. 14Displacements of spiral basilar membrane after replacing artificial auditory ossicle TORP
a)
b)
c)
4. Conclusions
This paper has established a complete 3D finite element model of human ears, and it was then combined with NASTRAN software to analyze its frequency response. The cochlear model was improved from the previously simplified and straight shape, and the correctness of the model in this paper was verified through comparison with the published experiment data. Some conclusions can be drawn as follows:
1) When the analyzed frequency was less than 1000 Hz, the computational result of numerical simulation was well consistent with the upper limit. When the analyzed frequency was more than 1000 Hz, the computational result of numerical simulation was well consistent with the lower limit. Therefore, the numerically computational model was reliable.
2) Vibration characteristics of spiral basilar membrane after replacing artificial auditory ossicle had some obvious changes at low and high frequencies. Compared with normal ears, the vibration level of spiral basilar membrane after replacing artificial auditory ossicle has slowed down in 100 Hz-600 Hz, 2000 Hz-4000 Hz and 7000 Hz-10000 Hz, and has been strengthened in 600 Hz-2000 Hz and 4000 Hz-7000 Hz, which provided some help for the hearing recovery at the high-frequency band.
3) The position and value of the displacement amplitude in the spiral basilar membrane changed with frequency. However, the displacement amplitude and distribution of spiral basilar membrane after replacing artificial auditory ossicle TORP were close to those of normal ears at the same frequency and position. The displacement value of normal ears was between 0 mm to 4.83e-006 mm. In addition, the maximum displacement at this moment was close to cupula cochlea and amplitude was 4.83e-006 mm. The displacement value of spiral basilar membrane of human ears after replacing artificial auditory ossicle TORP was between 0mm to 2.65e-006 mm. In addition, the maximum displacement at this moment was also close to cupula cochlea and amplitude was 2.65e-006 mm. Therefore, using finite element method to analyze vibration characteristics of spiral basilar membrane can well predict the hearing recovery effect after replacing artificial auditory ossicle.
4) Using finite element method, combining with mechanics principle and structural engineering analysis to study the whole hearing system would provide some theoretical references for predicting the hearing recovery effect of human ears.
References
-
Gan R. Z., Reeves B. P., Wang X. Modeling of sound transmission from ear canal to cochlea. Annals of Biomedical Engineering, Vol. 35, Issue 12, 2007, p. 2180-2195.
-
Gan R. Z., Cheng T., Dai C., et al. Finite element modeling of sound transmission with perforations of tympanic membrane. The Journal of the Acoustical Society of America, Vol. 126, Issue 1, 2009, p. 243-253.
-
Zhang X., Gan R. Z. A comprehensive model of human ear for analysis of implantable hearing devices. IEEE Transactions on Biomedical Engineering, Vol. 58, Issue 10, 2011, p. 3024-3027.
-
Yao W. J., Li W., Fu L. J., Huang X. S. Numerical simulation and transmitting vibration analysis for middle-ear structure. Journal of System Simulation, Vol. 21, Issue 3, 2009, p. 651-654.
-
Yao W. J. Advance in biomechanics of human ear as hearing system. Mechanics in Engineering, Vol. 35, Issue 6, 2013, p. 1-10.
-
Cheng T., Gan R. Z. Mechanical properties of stapedial tendon in human middle ear. Journal of Biomechanical Engineering, Vol. 129, Issue 1, 2007, p. 913-918.
-
Qi L., Funnell W. R. J., Daniel S. J. A nonlinear finite-element model of the newborn middle ear. Acoustical Society of America, Vol. 124, Issue 1, 2008, p. 337-347.
-
Coffey C. S., Lee F., Lambert P. R. Titanium versus nontitanium prostheses in ossiculo plasty. Laryngoscope, Vol. 118, 2008, p. 1650-1658.
-
Beutner D., Luers J. C., Huttenbrink K. B. Cartilage “shoe” a new technique for stabilisation of titanium total ossicular replacement prosthesis at centre of stapes footplate. The Journal of Laryngology and Otology, Vol. 122, 2008, p. 682-686.
-
Huttenbrink K. B., Beutner D., Zahnert T. Clinical results with an active middle ear implant in the oval window. Advances in Oto-Rhino-Laryngology, Vol. 69, 2010, p. 27-31.
-
Wang X., Cheng T., Gan R. Z. Finite-element analysis of middle-ear pressure effects on static and dynamic behavior of human ear. The Journal of the Acoustical Society of America, Vol. 122, Issue 2, 2007, p. 906-917.
-
Wang X. L., Zhou J. J., Ling L., Hu Y. J. FE simulation of sound transmission in human ear with an active cochlea model. Journal of Vibration and Shock, Vol. 31, Issue 21, 2012, p. 41-45.
-
Zhang D. G., Li W. B. Novel fusion computing method for bio-medical image of WSN based on spherical coordinate. Journal of Vibroengineering, Vol. 18, Issue 1, 2016, p. 522-538.
-
Ma Z. Shadow detection of moving objects based on multisource information in Internet of things. Journal of Experimental and Theoretical Artificial Intelligence, Vol. 29, Issue 3, 2017, p. 649-661.
-
Ma Z. A novel compressive sensing method based on SVD sparse random measurement matrix in wireless sensor network. Engineering Computations, Vol. 33, Issue 8, 2016, p. 2448-2462.
-
Ma Z. New AODV routing method for mobile wireless mesh network (MWMN). Intelligent Automation and Soft Computing, Vol. 22, Issue 3, 2016, p. 431-438.
-
Andrei S. S. Forces between clustered stereocilia minimize friction in the ear on a subnanometre scale. Nature, Vol. 474, Issue 16, 2011, p. 376-379.
-
Yoon Y. J., Steele C. R., Puria S. Feed-forward and feed-backward amplification model from cochlear cytoarchitecture: an interspecies comparison. Biophysical Journal, Vol. 100, 2011, p. 1-10.
-
Zhang D. G., Li G., Zheng K. An energy-balanced routing method based on forward aware factor for wireless sensor network. IEEE Transactions on Industrial Informatics, Vol. 10, Issue 1, 2014, p. 766-773.
-
Liu S., Zhang T. Novel unequal clustering routing protocol considering energy balancing based on network partition and distance for mobile education. Journal of Network and Computer Applications, Vol. 88, 2017, p. 1-9.
-
Liang Y. P. A kind of novel method of service-aware computing for uncertain mobile applications. Mathematical and Computer Modelling, Vol. 57, Issue 3, 2013, p. 344-356.
-
Zheng K., Zhang T. A novel multicast routing method with minimum transmission for WSN of cloud computing service. Soft Computing, Vol. 19, Issue 7, 2015, p. 1817-1827.
-
Gan R. Z., Wood M. W., Dormer K. J. Human middle ear transfer function measured by double laser interferometry system. Otology and Neurotology, Vol. 25, Issue 4, 2004, p. 423-435.
-
Kurokawa H., Goode R. L. Sound pressure gain produced by the human middle ear. Otolaryngology-Head and Neck Surgery, Vol. 113, Issue 4, 1995, p. 349-355.
-
Deafness and Hearing Impairment. World Health Organization Fact Sheet, http://www.who.int/mediacentre/factsheets/fs300/en/indexhtml, 2014.
-
Zhang D. G., Wang X., Song X. D. A novel approach to mapped correlation of ID for RFID anti-collision. IEEE Transactions on Services Computing, Vol. 7, Issue 4, 2014, p. 741-748.
-
Zhang X. D. Design and implementation of embedded un-interruptible power supply system (EUPSS) for web-based mobile application. Enterprise Information Systems, Vol. 6, Issue 4, 2012, p. 473-489.
-
Zheng K., Zhao D. X. Novel quick start (QS) method for optimization of TCP. Wireless Networks, Vol. 22, Issue 1, 2016, p. 211-222.
-
Kang X. J. A novel image de-noising method based on spherical coordinates system. Eurasip Journal on Advances in Signal Processing, Vol. 2012, Issue 1, 2012, p. 1-10.

