Abstract
In bio-medical field, embedded numerous sensing nodes can be used to monitor and interact with physical world based on signal analysis and processing. Data from many different sources can be collected into massive data sets via localized sensor networks. Understanding the environment requires collecting and analyzing data from thousands of sensors monitoring, this is big data environment. The application of bio-medical image fusion for big-data computing has strong development momentum, big-data bio-medical image fusion is one of key problems, so the fusion method study is a hot topic in the field of signal analysis and processing. The existing methods have many limitations, such as large delay, data redundancy, more energy cost, low quality, so novel fusion computing method based on spherical coordinate for big-data bio-medical image of WSN is proposed in this paper. In this method, the three high-frequency coefficients in wavelet domain of bio-medical image are pre-processed. This pre-processing strategy can reduce the redundant ratio of big-data bio-medical image. Firstly, the high-frequency coefficients are transformed to the spherical coordinate domain to reduce the correlation in the same scale. Then, a multi-scale model product (MSMP) is used to control the shrinkage function so as to make the small wavelet coefficients and some noise removed. The high-frequency parts in spherical coordinate domain are coded by improved SPIHT algorithm. Finally, based on multi-scale edge of bio-medical image, it can be fused and reconstructed. Experimental results indicate the novel method is effective and very useful for transmission of big-data bio-medical image, which can solve the problem of data redundancy, more energy cost and low quality.
1. Introduction
Advances in digital sensors, communications, computation, and storage have created huge collections of data. Trillions of bytes of data every day such as satellite images, driving directions, and image retrieval continually add new services. Digital data are being generated by many different sources in the field of signal analysis and processing, including digital imagers (telescopes, video cameras, MRI machines). Data from the many different sources can be collected into massive data sets via localized sensor networks, as well as the Internet. Understanding the environment requires collecting and analyzing data from thousands of sensors monitoring, this is big data environment. For example, modern medicine collects huge amounts of data about patients through imaging technology [1-3]. By applying data mining to data sets for large numbers of patients, medical researchers are gaining fundamental insights into the genetic and environmental causes of diseases, and creating more effective means of diagnosis. Big-data bio-medical image is one of important research focuses.
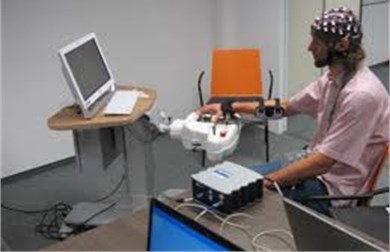
In bio-medical field, embedded numerous sensing nodes (as Fig. 1) can be used to monitor and interact with physical world, such as Pulse Oximeter, Glucose Meter, Electro- cardiogram (ECG), CT, MR, Social Alarm Devices, and so on. Wireless Sensor Network (WSN) can be used in all kinds of bio-medical applications [4-7]. WSN can do tele-monitoring of human physiological data, tracking and monitoring patients and doctors inside a hospital, drug administration in hospitals, and so on.
Fig. 1Embedded numerous sensing nodes in WSN
In WSN, data coming from multiple wireless sensor nodes are aggregated and they reach the same routing node to the sink [8-11]. The application of bio-medical image fusion for big-data computing has strong development momentum, especially in medical therapeutics, so the fusion method study is a hot topic. Generally, the fusion for big-data bio-medical image can be divided into 4 levels [12-15]: signal, pixel, feature and symbol. According to fusion different levels, there are relative specific fusion methods. For the pixel and the feature, the fusion methods have principal component analysis, pyramid-based, wavelet transform, etc.
Discrete Wavelet Transform (DWT) can decompose the image into different scales. The wavelet coefficients have the following characteristics [16-18]: low-frequency sub-bands contain most of the energy of the original image, while the high-frequency coefficients take less energy and mostly in the image edge. In the same direction, the sub-band coefficients of the same level show some correlations. The probability that the amplitude of each high frequency sub-band coefficient steps down is big. According to the band, the coefficients form a tree structure from low-frequency to high frequency.
For big-data bio-medical image, the existing methods have many limitations, such as large delay, data redundancy, more energy cost, and low quality.
Said [6] presented encoding implementation based on set partitioning in hierarchical trees (SPIHT), which is highly efficient in coding non-textured images. This encoding algorithm can be stopped at any compressed file size or let it run until the compressed file is a representation of a nearly loss-less image. However, SPIHT coding has a serious drawback: repeated scan. This disadvantage makes encoding efficiency less. In recent years, many researchers [19-23] proposed different improved SPIHT algorithm. However, those improvement methods for SPIHT algorithm only optimized the code scheme, but neglected the transform part.
Kassim [7] proposed SPIHT-WPT coder scheme, which selected an optimal wavelet packet transformation basis for SPIHT. The selected basis could efficiently compact the high-frequency sub-band energy into as few trees as possible and avoid parental conflicts. This algorithm achieved effectively results for highly textured images.
Ansari [9] introduced CSPIHT algorithm to reduce the bit rate. In this method the contextual part of the image was encoded selectively on the high priority basis with a very low compression rate and the background of the image is separately encoded with a low priority and a high compression rate and they were re-combined for the reconstruction of the image.
Paper [10] proposed high-throughput memory-efficient arithmetic coder architecture for the SPIHT image compression. Instead of using the list mechanism, this method used a breadth-firs-search algorithm to avoid re-scanning the wavelet transform coefficients.
Khan [11] introduced a novel method of no-reference objective quality assessment of wavelet coded images. This method was used to estimate the quantization errors in terms of MSE reduction in SPIHT coding algorithm. Many researches have proposed other improved algorithms about SPIHT.
We improve the SPIHT algorithm and optimize the transform part in this paper. In transform part, after analyzing the characteristics of the wavelet coefficients, we introduce a strategy to pre-process the coefficients. Firstly, the three high-frequency wavelet coefficients are transformed to spherical coordinate domain. In this way, the correlation between wavelet coefficients in the same decomposition scale can be further reduced. However, this strategy does not affect the correlation between wavelet coefficients in the different decomposition scales. Multi-Scale Model Product (MSMP) is used to control the wavelet shrinkage functions, which can remove the coefficients that have little effect on the visual and some noise information. This pre-processing strategy can reduce the redundant ratio of big-data bio-medical image. In coding part of bio-medical image, the low-frequency part contains the most energy of the image, and this part does not participate into the spherical transformation. Therefore, it can be encoded separately by DPCM. The high-frequency parts in spherical coordinate domain adopt the improved SPIHT coding algorithm. We introduce a matrix of maximum pixel (MMP) to overcome the re-scan disadvantage of traditional SPIHT algorithm. When the threshold is updated, we just compare the new threshold to the coefficients in MMP. This mechanism avoids the comparison between the new thresholds to every pixel. The improved SPIHT algorithm greatly improves the fusion efficiency.
The bio-medical image fusion with coding based on spherical coordinate domain contains the following steps: the image wavelet decomposition in different scale, the three high-frequency wavelet coefficients transforming to spherical coordinate domain, removing the coefficients by MSMP and encoding the image, transmitting to fusion center by WSN, making fusion in center, reconstructing the image by the processed coefficient.
2. Method
As we know, SPIHT algorithm is based on bit plane. It organizes the wavelet coefficients into spatial orientation trees. SPIHT with lists algorithm uses three different lists to store significant information of wavelet coefficients for image coding purpose [8-12]. Three lists are list of insignificant sets (LIS), list of insignificant pixels (LIP), and list of significant pixels (LSP). At first, SPIHT combines nodes into one set which is denoted as insignificant. With traveling each tree node, sets in the LIS are partitioned into four different subsets which are tested for significant state.
2.1. Basic principle
Discrete wavelet transform (DWT) can decompose the image into different scales. The wavelet coefficients have the following characteristics: low-frequency sub-bands contain most of the energy of the original image, while the high-frequency coefficients take less energy and mostly in the image edge. In the same direction, the sub-band coefficients of the same level show some correlations. The probability that the amplitude of each high frequency sub-band coefficient steps down is big. According to the band, the coefficients form a tree structure from low-frequency to high frequency (Fig. 2).
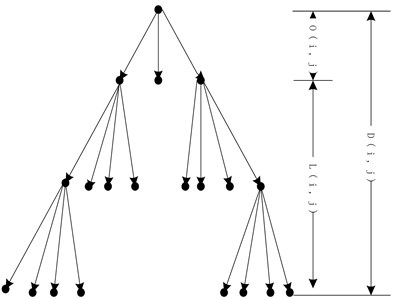
SPIHT algorithm is based on bit plane. This algorithm encodes following the importance of coefficients. It organizes the wavelet coefficients into spatial orientation trees (Fig. 3). SPIHT with lists algorithm uses three different lists to store significant information of wavelet coefficients for image coding purpose [6]. Three lists are list of insignificant sets (LIS), list of insignificant pixels (LIP), and list of significant pixels (LSP). At first, SPIHT combines nodes into one set which is denoted as insignificant. With traveling each tree node, sets in the LIS are partitioned into four different subsets which are tested for significant state [6].
Fig. 2Wavelet multi-scale decomposition
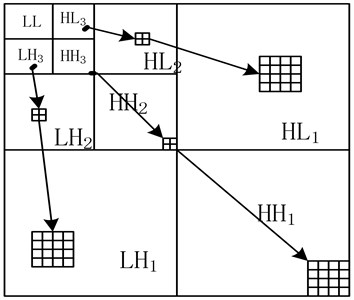
Fig. 3Spatial orientation tree
2.2. Wavelet domain to spherical domain for signal analysis and processing
The human visual system is characterized in observing an image signal analysis and processing. We are more sensitive to low frequency of an image, while less sensitive to the high frequency parts. Based on this characteristic of the human eyes, discrete wavelet transform decomposes the image into different scales and processes the image in different resolutions. The coefficients in the same scales are great relevance. If we can reduce the correlations and reserve the main information, we will achieve high compression ratio when compressing an image. And we will reduce the image storage space and improve the efficiency of the transmission channel. From this viewpoint, the three high frequency coefficients in wavelet domain are transformed into spherical domain.
The signal f(x) denotes an image. After DWT transformation, the image decomposes into a low frequency and three high frequencies. C(1)j,k is the horizontal high frequency, C(2)j,k is the vertical high frequency and C(3)j,k is the diagonal high frequency. This paper transforms the three high frequencies to spherical coordinate domain:
where, the j, k denote the coordinates of the coefficients.
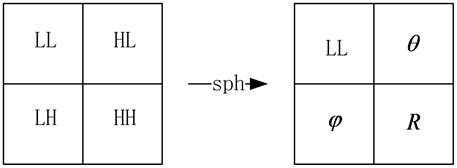
After the spherical transformation, the coefficients in the wavelet domain are mapped to spherical coordinate domain. The corresponding relationship between the various components is shown as Fig. 4.
Spherical transform can further remove the correlations of the wavelet coefficients in the same scales. The energy of the three high frequencies in the wavelet domain is totally transformed to the radial components in the spherical domain. While the phase angles just retain the pixel location information. Therefore, we just process the radial components and decrease the complexity of the algorithm. Also it avoids directly process the wavelet coefficients.
Fig. 4Transform from wavelet domain to spherical domain
2.3. Multi-scale module products in processing
Premise 1. In the wavelet domain, with the increase of decomposition scales, the wavelet coefficients of effective signal will increase or remain unchanged. While the wavelet coefficients of noise and unimportant coefficients will decrease.
Premise 2. Spherical transform reduces the correlation in the same scale. However, it does not change the correlation of the coefficients in different scales.
Based on the two premises mentioned above and inspired by the ideas of multi-scale product in the wavelet domain, multi-scale norm products (MSNP) in spherical domain are defined as follows:
Definition 1. The MSNP of pixel point (x, y) in spherical coordinates is as:
where k is the decomposition scales.
The MSNP can enlarge the distance between effective signal and unimportant signal. It avoids the shortcoming that smaller wavelet coefficients are wrongly removed by traditional methods. Therefore, it will effectively remove the noise information and unimportant coefficients without loss of the important feature of the original image.
Theorem 1. The signal to noise ratio (SNR) and peak signal to noise ratio (PSNR) of the fusion image is defined as follows. If PSNR>λ (noise ratio threshold, the default is 20 dB), the fusion result is valid:
Proof. Based on the above Eqs. (18) and (19), we can calculate the value of SNR and PSNR of the fusion image. Generally, if the PSNR of one image is larger than the noise ratio threshold λ ( the default value of λ is 20 dB), the image is clear and readable, otherwise, the image is vague. If PSNR > (noise ratio threshold, the default is 20 dB), so the fused image is readable and acceptable, that is to say, the fusion result is valid.
2.4. The processing of wavelet coefficients of image signal
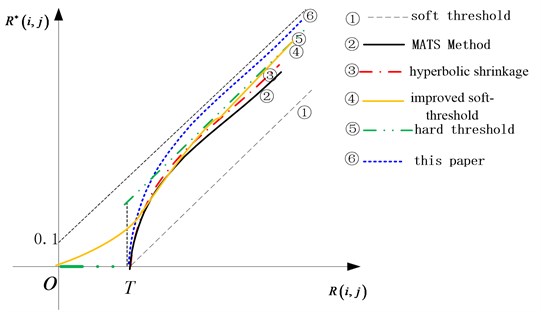
In the spherical domain, R(j,k) takes the energy of the pixel point (j, k). The greater the radial components |R(j,k)| is, the more important of the image information which contains. The radial components whose absolute value is small contain the secondary information and some noise information. In order to achieve large compression ratio and do not affect the visual effect, this paper processes the radial components by soft-threshold shrinkage:
where, T denotes the wavelet shrinkage threshold.
As Fig. 5, there are different shrinkage strategies, we take the threshold acting on the MSMP. This algorithm avoids killing the small amplitude coefficients and can effectively preserve the useful information of the original image.
In the spherical coordinates, angle and the radial components are independent to each other. Small angle does not always correspond to small energy. If the R(j,k) is zero, this indicate the point (j, k) signal energy is zero. Therefore, the corresponding two components θ(j,k) and φ(j,k) can be set to zero, which does not affect our recognition.
Fig. 5Several shrinkage threshold functions
2.5. Coding of Low-frequency part of image signal
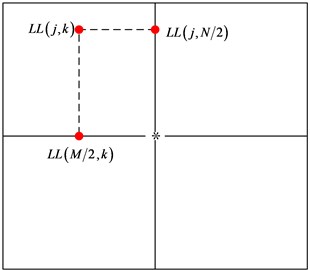
After wavelet transform, the energy carried by the low frequency almost closes to 90 % of the original image. In order to achieve a higher quality of the reconstructed image, we use the DPCM coding to process the low frequency coefficients. The size of the original image f(x,y) is M×N, LL(j,k) denotes the value of the pixel point (j, k) in the low frequency wavelet coefficients. We use the row M/2 and column N/2 to estimate other wavelet coefficients (as Fig. 6).
Firstly, keep LL(j,N/2) and LL(M/2,k) unchanged. Other coefficients are estimated by the following formula:
where, j=1,…,M, k=1,…,N.
Secondly, estimate the row M/2 and the column N/2:
Using the following formula to recover the low frequency coefficients:
Fig. 6DPCM coding in low-frequency part
2.6. Coding of High-frequency part of image signal
After being pre-processed, the coefficients of the high frequencies are transformed to spherical coordinate domain. The correlation between coefficients in the same scale is reduced. The radial components R(j,k) are processed by soft threshold function. A lot of zero points are produced. This promises a high compression ratio.
We suppose that MMP is for Matrix of Maximum Pixel. H is the set of coordinates of all spatial orientation tree roots (nodes in the highest pyramid level). O(j,k) is the set of coordinates of all offspring of node (j, k). D(j,k) is the set of coordinates of all descendants of the node (j, k). L(j,k) is the set of coordinates of all non-child descendants of the node (j, k), where L(j,k)=D(j,k)-O(j,k). T(j,k) is the spatial orientation tree whose root is the node (j, k). T is the maximum scan threshold 2n.
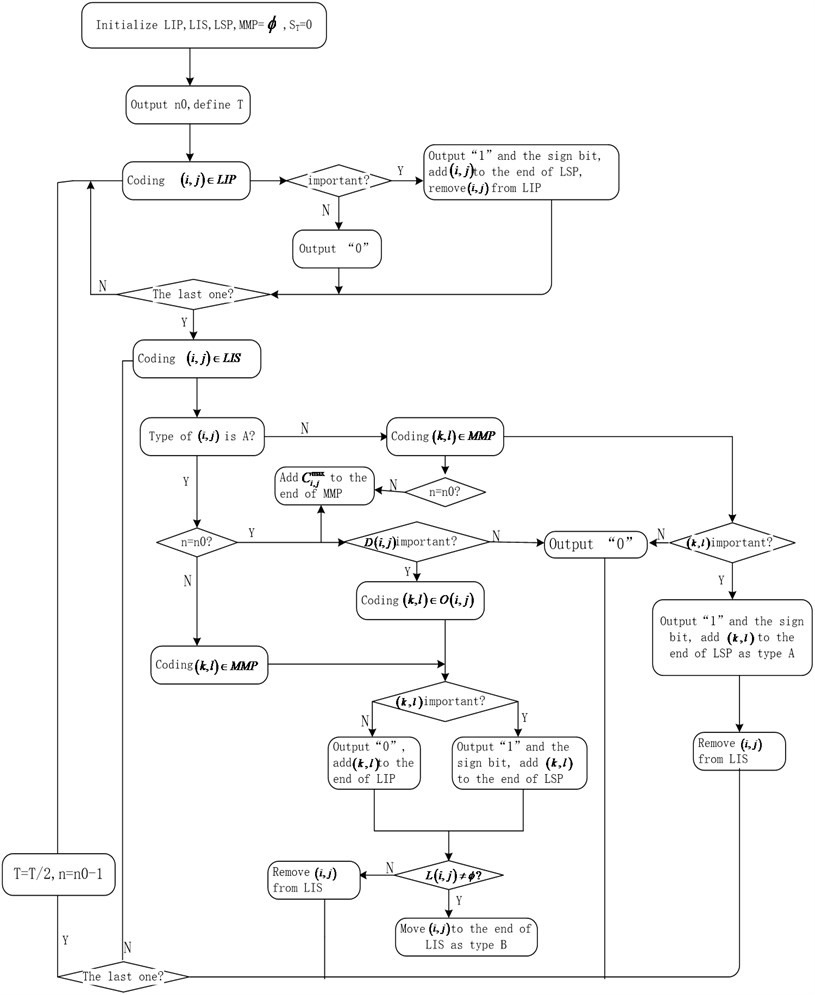
We introduce our improved algorithm, when scanning the list LIS, the matrix MMP will be established to preserve the largest pixel nodes of descendant of the set D(j,k) and L(j,k). Once the threshold updated, we just need to compare the new threshold with the corresponding coefficients of MMP. This method can effectively reduce the number of comparisons and improve scanning efficiency. The function used for testing set significant state is defined by the following formula:
where, M is a set of coordinates.
Improved algorithm is as Fig. 7.
Fig. 7Improved SPIHT algorithm
2.7. Fusion computing method for image signal
The fusion computing rule of bio-medical image is basically expressed by Eq. (10):
where, I(x,y) is the fused image, I1(x,y) and I2(x,y) are two input images, w(⋅) is the discrete wavelet transform method, w-1(⋅) is the inverse discrete wavelet transform method, ϕ is the fusion rule.
We use threshold T and shrinkage function to process the high frequency coefficients. Hard threshold function is as:
Soft threshold function is as:
where w(x,y) denotes wavelet coefficients, w*(x,y) is wavelet coefficients after processing, T is the threshold, sign(⋅) is sign function.
We process the low frequency and high frequency coefficients by inverse wavelet transform and reconstruct the image. We choose a class of orthogonal sample wavelets to be transformed. Dyadic wavelet transform in the direction of k defines as follows:
where I(x,y)∈L2(R2), 2j (j=1, 2,…) is the transform scale, ψ(x,y) for the wavelet of two directions, and using Eq. (13), we get:
where θ(x,y) is the continuous sample scale function, the smoothing level of the filter depends on it. Binary gradient in the image is as follows:
We define the edge point under the different scales in the image fusion. We can find the local maximum of the different types under the different scales about the above gradient. It is given by Eq. (16):
Along the gradient direction Aj2I (Eq. (17)), Mj2I in Eq. (16) reach the local maximum. Under each corresponding scale, we can find the corresponding edge points with the gradient modulus (wavelet transform values), these local maximum in a collective form is expressed as the Eq. (17):
P2j(I)={P2j,i=(xi,yi);∇2jI(xi,yi)}.
Along the direction of A2jI(xi,yi), the value of M2jI(xi,yi) gets the maximum (p2j,i=(xi,yi)). For a J-level dyadic wavelet transform, the multi-scale edge of the image is expressed as follows:
where S2jI(x,y) is the low-pass component of the image I(x,y) under the scale value 2J.
According to the above method, we obtain the maximum set P12j(I) and P22j(I) of the local gradient, that is the point (edge) representation of the image. The set contains the edge points of two images I1(x,y) and I2(x,y) in the same scale. In accordance with the above fusion rule Ф, then the image edge point set after point fusion is:
When the largest scale value is 2J, the approximation for the low-pass component after fusion is:
When the multi-scale point is confirmed, the image can be reconstructed.
The point-based fusion example is shown in the left part of Fig. 8. Based on the threshold T, Fig. 8 expresses the fused results of the head CT image (gray edge) and MR image (black edge), the left image for the transform scale j= 3, the right graph for the enlarged one of the domain.
Fig. 8Fusion by point under a certain scale
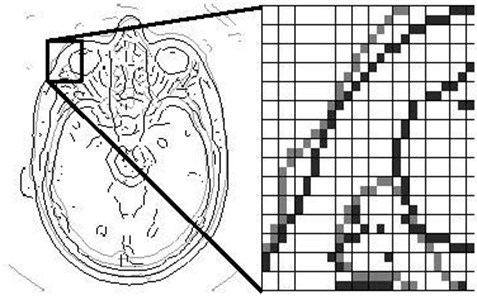
Fig. 9Fusion path based on curve line
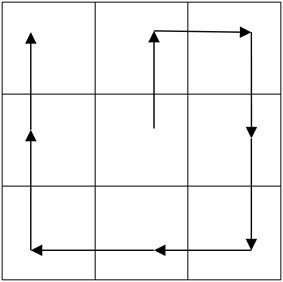
Two orthogonal and neighborhood maximum points can link up along the direction of A2jI(xi,yi), and it covers some edge curves of image profile, so the close maximum points, whose partial modulus M2jI(xi,yi) is in the threshold, can link up to form a chain set. In this set, fusion path can be computed as follows:
where s, t are pixel points, A(s), B(s), A(t), B(t) are coordinate values of s, t. ‖∙‖ is model value. Fig. 9 has shown one kind of fusion path. Figs. 10 and 11 have shown other kinds of fusion path, where 1, 2,..., 9 are pixel points, the curve line marked “cut” is fusion path.
Fig. 10Fusion by old graph cut method

Fig. 11Fusion by new graph cut method

The relative area of the fusion process is as Fig. 12. The method is that two images merge into an image, actually becomes the two area fuse into one area. The fusion method is as follows:
(1) Pre-process the original image to eliminate all interference by de-noising and smoothing process.
(2) Bio-medical image in each sensor does wavelet transformation in wavelet domain. Then the high-frequency coefficients of each image are transformed to the spherical coordinate domain to reduce the correlation in the same scale.
Fig. 12Relative area of the fusion process
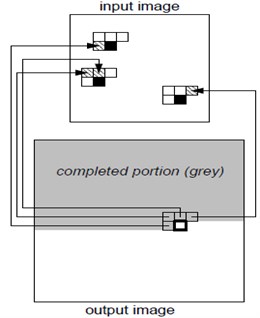
(3) Multi-scale model product (MSMP) is used to control the shrinkage function to make the small wavelet coefficients and some noise removed. The high-frequency parts in spherical coordinate domain are coded by improved SPIHT algorithm. The low-frequency part contains the most energy of the image, which can be encoded separately by DPCM.
(4) The coded image data in each sensor should be transmitted to fusion center by WSN. In fusion center, the coded image data should be decoded.
(5) Do edge processing for the decoded image by the above multi-scale edge detection method. Construct the point area and make the two area fuse into one area.
(6) By the principle that the important and continuous boundary generates the longer edge curve, we check the resulting area boundary by step (5). Is it OK? If it is, then the resulting image by this fusion method is valid, otherwise, repeat step (5) to continue.
(7) Based on the multi-scale edge of bio-medical image, the image can be reconstructed.
3. Results
Based on the above correlation fusion algorithm, we have done tests and analysis for the fusion application of the CT and MR image, in order to test the feasibility and applicability of this method.
Based on our fusion method, we have done a large number of fusion experiments by the CT and CT images and CT and MR images. The fusion steps are as follows:
(1) The corresponding pre-processing for two kinds of images, including image noise removal, image correction, and image alignment [20-22]. We have carried out image noise removal, image correction and image alignment in our own developed image processing software system [22]. Generally, data calibration involves space calibration, time calibration and measurement unit conversion. In view of the actual situation of this paper, we have mainly carried out space calibration. The so-called space calibration is to ensure that the coordinates of the measured data is consistent, the effect of coordinate transformation and error range is acceptable. The images to be merged, if not aligned, have been done rotation, translation, compression, stretching and other activities by the above descried software system.
(2) The pre-processed image in each sensor does wavelet transformation in wavelet domain. Then the high-frequency coefficients of each image are transformed to the spherical coordinate domain. After it coded by improved SPIHT and DPCM, they are sent to the fusion center by WSN and done fusion processing.
(3) Do edge processing for the decoded image by the above multi-scale edge detection method. Construct the point area and make the two area fuse into one area.
(4) Perform the sixth step and the seventh step of the aforementioned fusion method. The threshold of modulus M2jI(xi,yi) is 2.0, the threshold of the close distance T1 is 2.0, T2=3.0. When selecting different thresholds, the fusion result is slightly different.
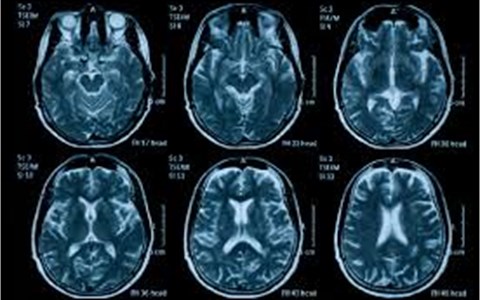
Fig. 13The original bio-medical images for experiments
(5) Reconstruct image by the processed coefficient and the reconstructed image is the fused image.
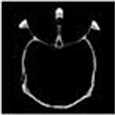
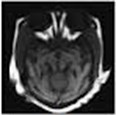
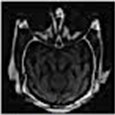
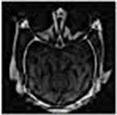
Fig. 13 is the original colorful bio-medical CT images for experiments. It are full of noise images. Based on this images, they can be processed according to the aforementioned fusion steps.
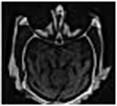
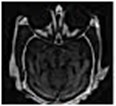
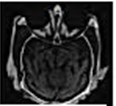
Fig. 14 is the edge detection example of bio-medical images. Fig. 15 is the fusion result of the CT bio-medical images. In Fig. 15(a) and (b) are two original CT bio-medical images. Fig. 15(g) is fused result by our method of this paper. Figs. 15(c), (d), (e) and (f) are fused results by the methods from reference [18-21], respectively. From the result of the examples of bio-medical image fusion, we can see that our method has good quality.
Based on the fusion results, we can know the above presented multi-scale correlation algorithm is feasible. In order to confirm the availability of the proposed method, we have done a large number of experiments. In comparison with the belief degree of other methods, the belief degree of the proposed method in this paper is much higher. In addition, by our project, we have done an on-the-spot practical application, it has been proved that its belief degree is as high as 95 % or more, it is now clear that for some application fields of demanding the high fusion quality like medical diagnosis, the method is very valuable.
Fig. 14Edge detection example of bio-medical images
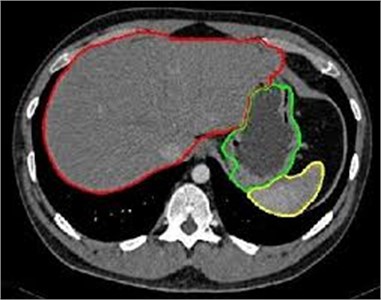
Fig. 15Fusion result of the CT bio-medical image
a)
b)
c)
d)
e)
f)
g)
4. Discussion
As we know, sample-based image fusion can be divided into pixel-based image fusion and patch-based image fusion [1-3]. Pixel-based image fusion can generate a pixel each time, while sample-based image fusion a patch. Generally, pixel-based image fusion can easily reflect image diversities but can’t keep image structures and it is slow, as patch-based image fusion fast and can better maintain image characteristic information within blocks but the color transition between blocks may not be smooth which will cause a decline in quality. Patch-based image fusion method is based on sample-based image fusion method, which divides the input image into blocks with fixed size. The constraint rule of overlapping regions between blocks is to select matching blocks and generate images that without repeat and continuous on arbitrarily large size. Patch-based image fusion changes synthesis unit from pixel into block which significantly improves synthesis rate compared to the pixel-based algorithm, and maintains the overall structure. Early image fusion is based on feature matching method which regards image as feature and by the sample matches feature to generate a new image. This algorithm operation is large, slow despite the increase in quality. In recent years, it mainly adopts Markov Random Field (MRF) model to fuse [4-10].
We do the comparison of relative method and give the experimental results of big-data bio-medical images in PSNR, MSE and run-time.
Fig. 16 is the comparison of PSNR for kinds of de-noising methods to Gaussian white noising of the same CT bio-medical image among our method and several relative methods from aforementioned references.
Fig. 17 is the comparison of MSE for kinds of de-noising methods to Gaussian white noising CT bio-medical image among our method and several relative methods from aforementioned references.
Fig. 16Comparison of PSNR for CT bio-medical image
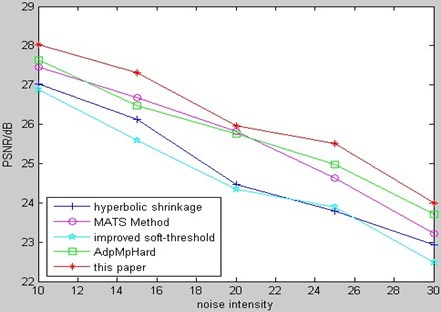
Fig. 17Comparison of MSE for CT bio-medical image
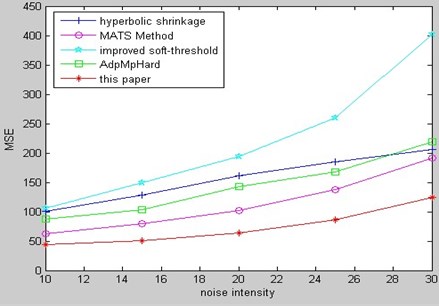
Fig. 18 is the comparison of PSNR for kinds of de-noising methods to Gaussian white noising of the same MR bio-medical image among our method and several relative methods from aforementioned references.
Fig. 19 is the comparison of MSE for kinds of de-noising methods to Gaussian white noising MR bio-medical image among our method and several relative methods from aforementioned references.
From the comparison of PSNR and MSE, we can see that our method in this paper has better results.
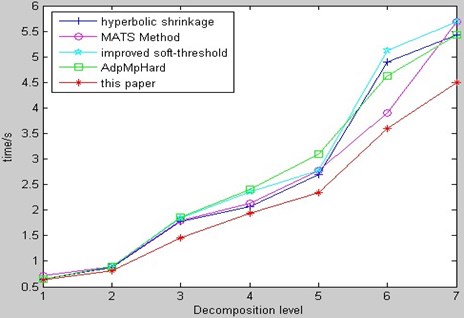
Fig. 20 is fusion run-time comparison of CT and MR image among our method and several relative methods from aforementioned references. Fig. 20 shows that our method retains the advantages in fusion quality and run-time in WSN. The results indicate the novel method is effective and very useful for transmission of big-data bio-medical image (especially, in the wireless environment).
Fig. 18PSNR comparison of MR bio-medical image
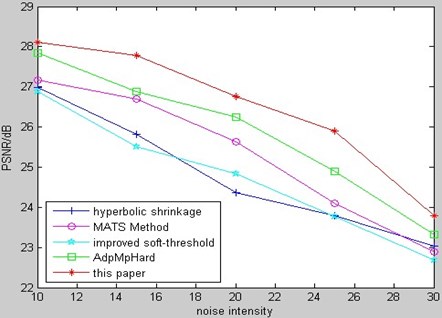
Fig. 19MSE comparison of MR bio-medical image
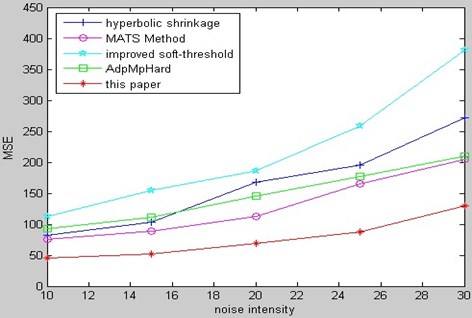
Fig. 20Fusion run-time comparison of CT & MR image
5. Conclusions
We have proposed novel fusion computing method Based on Spherical Coordinate for big-data bio-medical image of WSN in this paper. In this method, the three high-frequency coefficients in wavelet domain of bio-medical image are pre-processed. This pre-processing strategy can reduce the redundant ratio of big-data bio-medical image. Firstly, the high-frequency coefficients are transformed to the spherical coordinate domain to reduce the correlation in the same scale. Then, a multi-scale model product (MSMP) is used to control the shrinkage function so as to make the small wavelet coefficients and some noise removed. The high-frequency parts in spherical coordinate domain are coded by improved SPIHT algorithm. Finally, based on the multi-scale edge of bio-medical image, it can be fused and reconstructed. Experimental results indicate the novel method is effective and very useful for transmission of big-data bio-medical image, which can be especially used in wireless environment, which can solve the problem of data redundancy, more energy cost and low quality.
References
-
Zhang D. G., Kang X. J. A novel image de-noising method based on spherical coordinates system. EURASIP Journal on Advances in Signal Processing, Vol. 110, 2012.
-
Zhang D. G., Li G. An energy-balanced routing method based on forward-aware factor for wireless sensor network. IEEE Transactions on Industrial Informatics, Vol. 10, Issue 1, 2014, p. 766-773.
-
Veronika Olejnickova, Marie Novakova Isolated heart models: cardiovascular system studies and technological advances. Medical and Biological Engineering and Computing, Vol. 53, Issue 7, 2015, p. 669-678.
-
Zhang D. G. A new approach and system for attentive mobile learning based on seamless migration. Applied Intelligence, Vol. 36, Issue 1, 2012, p. 75-89.
-
Said Arnir, Pearlman William A new, fast and efficient image codec based on set partitioning in hierarchical trees. IEEE Transactions on Circuits and Systems for Video Technology, Vol. 6, Issue 3, 1996, p. 243-250.
-
Zhang D. G., Li G., Pan Z. H. A new anti-collision algorithm for RFID tag. International Journal of Communication Systems, Vol. 27, Issue 11, 2014, p. 3312-3322.
-
Chamila Dissanayaka, Eti Ben-Simon Comparison between human awake, meditation and drowsiness EEG activities based on directed transfer function and MVDR coherence methods. Medical and Biological Engineering and Computing, Vol. 53, Issue 7, 2015, p. 599-607.
-
Zhang D. G., Wang X., Song X. D. A novel approach to mapped correlation of ID for RFID anti-collision. IEEE Transactions on Services Computing, Vol. 7, Issue 4, 2014, p. 741-748.
-
Ansari M. A., Anand R. S. Context based medical image compression for ultrasound images with contextual set partitioning in hierarchical trees algorithm. Advances in Engineering Software, Vol. 40, Issue 7, 2009, p. 487-496.
-
Zhang D. G., Liang Y. P. A kind of novel method of service-aware computing for uncertain mobile applications. Mathematical and Computer Modeling, Vol. 57, Issues 3-4, 2013, p. 344-356.
-
Khan M. H., Moinuddin A. A., Khan E. No-reference image quality assessment of wavelet coded images. IEEE International Conference on Image Processing, ICIP, 2010, p. 293-296.
-
Ridhawi Karmouch Y. A. A. Decentralized plan-free semantic-based service composition in mobile networks. IEEE Transactions on Services Computing, Vol. 8, Issue 1, 2015, p. 17-31.
-
Chambolle Antonin, Devore Ronald, Lee Nam-yong, et al. Nonlinear wavelet image processing: variational problems, compression, and noise removal through wavelet shrinkage. IEEE Transaction on Image Processing, Vol. 7, Issue 3, 1998, p. 319-335.
-
Zhang D. G., Zhang X. D. Design and implementation of embedded un-interruptible power supply system (EUPSS) for web-based mobile application. Enterprise Information Systems, Vol. 6, Issue 4, 2012, p. 473-489.
-
Jain N., Lakshmi J. PriDyn: enabling differentiated I/O services in cloud using dynamic priorities. IEEE Transactions on Services Computing, Vol. 8, Issue 2, 2015, p. 212-224.
-
Zhang D. G., Zhu Y. N. A new constructing approach for a weighted topology of wireless sensor networks based on local-world theory for the internet of things (IOT). Computers and Mathematics with Applications, Vol. 64, Issue 5, 2012, p. 1044-1055.
-
Zhang D. G., Zhao C. P. A new medium access control protocol based on perceived data reliability and spatial correlation in wireless sensor network. Computers and Electrical Engineering, Vol. 38, Issue 3, 2012, p. 694-702.
-
Bao Paul, Zhang Lei Noise reduction for magnetic resonance images via adaptive multiscale products thresholding. IEEE Transactions on Medical Imaging, Vol. 22, Issue 9, 2003, p. 1089-1099.
-
Zhang D. G., Zheng K., Zhang T. A novel multicast routing method with minimum transmission for WSN of cloud computing service. Soft Computing, Vol. 19, Issue 7, 2015, p. 1817-1827.
-
Daniel Sanchez-Morillo Detecting COPD exacerbations early using daily telemonitoring of symptoms and k-means clustering: a pilot study. Medical and Biological Engineering and Computing, Vol. 53, Issue 7, 2015, p. 599-607.
-
Zhang D. G., Song X. D., Wang X. New medical image fusion approach with coding based on SCD in wireless sensor network. Journal of Electrical Engineering and Technology, Vol. 10, Issue 6, 2015, p. 709-718.
-
Zhang D. G., Zheng K., Zhao D. X. Novel quick start (QS) method for optimization of TCP. Wireless Networks, Vol. 5, 2015.
-
Zhang D. G., Wang X., Song X. D. A kind of novel VPF-based energy-balanced routing strategy for wireless mesh network. International Journal of Communication Systems, Vol. 10, 2014.
About this article
This research work is supported by National Natural Science Foundation of China (Grant Nos. 61170173, 61202169, 61571328), Tianjin Key Natural Science Foundation (No. 13JCZDJC34600), Training plan of Tianjin University Innovation Team (No. TD12-5016).
