Abstract
Using Tuned liquid damper is one of the passive control methods in structures. The system consists of some water tanks that are installed at the highest level of structure. The water turbulence created inside them is used to reduce the seismic oscillation of structure. Therefore, the damper characteristics (tank size and depth of water in it) should be selected in such a way that the frequency of water in the reservoir is tuned with the frequency of structural vibrations. The controlling force to reduce the structural vibrations is created by the pressure difference caused by the difference in surface levels of the liquid in the end chambers which acts as a shear force at the bottom of tanks. It is required to obtain the water surface level at different times to calculate the controlling force caused by tuned liquid dampers. In the present study, the parameters of damper have been simultaneously minimized by Genetic Algorithm (GA) method and based on single-purpose function (displacement of the top story) and multi-purpose functions (displacement and acceleration of the top story). Optimal Pareto Front objective functions are utilized to achieve optimal responses. A 20-story building has been investigated as a numerical example to carry out this study. In this study the comparisons between TLD system and TMD system, i.e. integrated TLD-TMD system is made with the application of Genetic Algorithms. The author codes all the numerical solutions and Genetic Algorithm program.
1. Introduction
The purpose of using a tuned mass damper (TMD) in a structure is similar to that of metallic dampers and equipment related to the energy dissipation, i.e. reducing energy dissipation in the elements of main structure by subjecting it to external forces. In this form, energy dissipation reduction (demand reduction) is done by transferring some amount of structural energy to the tuned mass damper (TMD), which is in its simplest way, is the system of mass-absorber-dashpot installed on the main structure.
In 1952, researchers attempted to use non-linear springs impact to increase the effect of a damper on the reduction of the maximum dynamic response of the system [1]. The Damped dynamic vibration absorbers in a parallel form (a mass tuned with secondary non-damper added in parallel form) were investigated in 1969 [1]. In 1969, Villaverde investigated the effect of TMD in response to a structure with 10 degrees of freedom under the earthquake of 1985 in Mexico City regarding narrow frequency zone and a long time [2]. In 2003, Pinkaew investigated the effect of TMD in building, after non-linearization of the structure under earthquake to reduce the damages of structure [3]. In 2005 Pinelli investigated various types of TMD and their effects under earthquakes of El Centro in 1940, Hachinohe in 1994, Northridge in 1994 and Kobe in 1995, which included different frequency contents [4]. In 2006, Ambrosini investigated the control of structures with geometric asymmetry which led to the displacement of the mass center from critical stress location. The earthquake displaced the structures, and the TMD was used to control their twist [5]. In 2008, M. Matsui investigated a hybrid vibration experiment system that can evaluate the performance of complicated vibration of TMD [6]. In 2013, Zhang investigated Passive control of bilinear hysteretic structures by tuned mass damper for narrowband seismic motions [7]. In 2013, Etedali et al. investigated an independent robust model proportional-integral-derivative (PID) control approach for seismic control of structures. The feedback gain was determined using genetic algorithms to create a good trade-off between the performance and robustness of the model controller [8]. In 2014, Casalotti investigated the effectiveness of the vibration absorber system, comparing both the onset of flutter and the post-flutter behavior without the control devices with the corresponding responses obtained when multiple absorbers are installed [9]. In 2015, Domaneschi investigated a suspension bridge model as a case study for performing numerical simulations and evaluating, at first, a wide collection of control strategies, including tuned mass dampers, for mitigating the buffeting dynamic vibrations induced by strong wind loading [10]. In 2015, Mrabet presented a continuous optimization nested loop method (COLM) is to provide the exact range of the optimum TMD parameters and their corresponding failure probabilities [11]. In 2015, Berardengo investigated a new layout for adaptively tuned mass dampers based on shape memory alloys [12]. In 2016, Etedali et al. developed multi-objective optimization design of proportional–derivative (PD) and proportional-integral-derivative (PID) controllers for seismic control of high-rise buildings. To create a good trade-off between the performance and robustness of the closed-loop structural system, a non-dominated sorting genetic algorithm, NSGA-II, is employed [13].
TLD works based on depreciation of vibration energy dissipation which impacts on the structure and is caused by earthquake & the wind. This dissipation is carried out by the turbulence of shallow water through some tanks. The inertia of liquid mass causes the liquid to move with a different phase from tank and structure, which have similar vibration. This displacement and turbulence lead to a difference in surface levels of liquid in the end chambers of the tank. The hydrostatic pressure difference caused by these different levels creates a shear force that enters into the structure at the bottom of the tank and is called controlling the force of TLD [14].
In 1992, Sun & Fujino investigated a nonlinear model for tuned liquid damper by which, it is possible to predict the responses of the structure under horizontal stimulations during wave breaking with high accuracy, by considering this non-linear model and resulted in experimental coefficients [15]. In 1994, Mahatama et al. investigated a combination of TLD which turned with some multiple degrees of freedom (MDOF) structures in different vibration frequencies. In this investigation, the rectangular TLDs were used to reduce the structural vibrations [16]. In 1995, Sun and Fujino proposed a non-linear model of a turbulent fluid damper for TLD, based on wave's theory in shallow water. The model was evaluated by Shaking Table Test [17]. In 1998, Reed et al. investigated tuned liquid damper for the range of great turbulence in numerical form using Shaking Table [18]. In 1999, Chang and Gu investigated the rectangular TLD effects that vibrated due to vortex turbulent [19]. In 2004, Frandsen presented a non-linear model based on equations of viscous fluid in rectangular tanks by the method of finite difference. Fluid equations are involved with a linear elastic anchor structure. The turbulence displacements in the simulated model were studied in resonance frequency range and during structural vibrations [20]. In 2005, Taita studied two models of linear and non-linear systems to specify TLDs containing several metals meshes and compared the achieved results with the experimental result [21]. In 2009, Mariani investigated an integrated fluid–structure numerical model to simulate the response of a single degree of freedom (SDOF) structure outfitted with a tuned liquid damper (TLD) [22].
In 2010, Rama et al. investigated TMD parameters’ optimization considering random system parameters [23]. In 2011, Love et al. investigated the use of a tuned liquid damper (TLD) as a cost effective method to reduce the wind-induced vibrations of base isolated structures [24]. In 2011, Love et al. investigated a tuned magnetic fluid damper (TMFD) is a dynamic absorber using a magnetic fluid. A characteristic of the TMFD is changing the natural frequency of a magnetic fluid sloshing under a magnetic field [25]. In 2011, Love investigated a non-linear multimodal model which describes the sloshing behavior of fluid in a flat-bottom tank of arbitrary geometry [26]. In 2013, Halder investigated the performance of unidirectional tuned liquid damper (TLD) that relies upon the motion of the shallow liquid in a rigid tank for changing the dynamic characteristics of a structure and dissipating its vibration energy under harmonic excitation [27]. In 2013, Love and Taita conducted a parametric shake table testing program which varied the fluid depth of a rectangular tank equipped with damping screens [28]. In 2015, Love and Taita investigated a method to estimate the nonlinear peak wave height using an equivalent mechanical model [29]. In 2016, Sonmez et al. investigated a new model for semi-active Tuned Liquid Column Damper (TLCDs) where the TLCDs is connected to the primary structure using an adaptive spring. [30]. In 2016, Abubaker et al. investigated a particle swarm optimizer (PSO) fuzzy controller, that was introduced into the TLCD-structure system. The PSO was optimizing the IF-THEN rules of fuzzy controller [31].
In the single-objective optimization problems, the role of the designer is to find a vector of designing variables to provide the best design. The vector provides the absolute minimum point or the absolute maximum point of the problem to the designer. Unlike to the single objective problems, in the multi-objective optimization problem, it is not possible to recommend a vector of variables as a response. It means that multi-objectives problem, unlike the single-objective problems doesn’t have a unique response, rather it has a set of replies in which none of them is superior to other. These responses are called Pareto responses. In the multi-objectives problem, there are several target functions, and the trend is to minimize or maximize them simultaneously. Therefore, no unique optimized response simultaneously optimizes all target functions; rather there is a series of reactions which are known as Pareto optimized responses or Pareto Front [32-34]. Different evolutionary algorithms have been provided for optimization of multi-objective function problems, until now [8]. The most important of them include Evaluated Genetic Algorithm Vector recommended by Schaffer [35], Genetic Algorithm of Fonseca and Fleming [NSGA], non-dominant Sorting Algorithm by Srinivas [34], Resistant Pareto Evolutionary Algorithm introduced by Zitzler [36] and the strategy of evaluating Pareto Archive by Coren [37].
2. Methodology
The tuning of the natural frequency of the structure with the frequency of stimulation leads to optimization of damper performance in controlling the structure response. The basic equations of fluid turbulence inside the rectangular tank have been extracted based on the theory of nonlinear waves in shallow water [38, 39]. These equations encompass the depreciation of friction in the boundary layer of the tank bottom. The statement is developed to consider various types of damping, after turning into viscous damping [40]. Finally, the equations have been modified to include the wave breaking [41]. The resulting equations are coupled, and two-variable nonlinear partial differential equations which can be numerically developed as a part of this study by the program are solved after discretization into some ordinary differential equations [42]. The output of the program is the time history of surface levels of liquid and horizontal velocity of liquid particles which are used to calculate the pressure when the particles are pressed to end chambers of the tank. The pressure difference on end chambers of the container is used to obtain the basic shear forces of TLD. In next step, the interaction of TLD and the structure with N degree freedom has been simulated as shown in Fig. 1. For this purpose, the dynamic equations of the structure and the turbulence equation are combined with each other and the resulting forces are combined numerically by the program. These are then solved to determine the time history of the structure – TLD system responses.
2.1. Natural frequency of fluid turbulence within the TLD
The turbulence displacement of fluid inside a tank has different vibration modes with its special natural frequencies which are caused by horizontal simulation of the tank. If a tank with a rectangular profile and following characteristics is taken into account, then the natural frequencies of different modes of fluid turbulence in it are achieved by following equation [39].
where, is the number of turbulence mode (integer), is the natural frequency of turbulence of liquid in the mode of, is the depth of liquid and is the length of the tank.
2.2. Obtaining the basic equations of fluid turbulence inside the rectangular tank
The equations of fluid turbulence inside the rectangular tank are obtained in nonlinear form. As shown in Fig. 2 the length of the tank is (along direction of stimulation) and its width is (perpendicular to the stimulation protraction) and the depth of liquid in the tank is . Both chambers of the tank are rigid and fully reflective (stranding); while the tank is rectangular. The tank is simulated along its length. The liquid flow is two-dimensional, and the particles move in the vertical and longitudinal directions and also parallel to each other [42].
Fig. 1TLD and a structure with single degree of freedom [43]
![TLD and a structure with single degree of freedom [43]](https://static-01.extrica.com/articles/17809/17809-img1.jpg)
Fig. 2View of local coordinates in the TLD tank [43]
![View of local coordinates in the TLD tank [43]](https://static-01.extrica.com/articles/17809/17809-img2.jpg)
For liquids with relative small viscosity, the effect of internal fluid friction is significant only in the boundary layer near to solid boundary as shown in Fig. 3. Accordingly, to this matter, the liquid flow out of boundary layer can be considered in potential flow form:
The above equations are known as two dimensional Navier-stokes equations.
Fig. 3Horizontal velocity fluid inside and outside the boundary layer [44]
![Horizontal velocity fluid inside and outside the boundary layer [44]](https://static-01.extrica.com/articles/17809/17809-img3.jpg)
2.3. Damping caused by liquid displacement
When a liquid flows into the tank a part of incoming stimulation energy is converted into kinetic energy and is dissipated in the fluid as heat. Different factors play a role in this dissipation. Damping in the liquid is in viscosity form and it can be stated in the shape of is – where is the damping coefficient and is velocity. By this way, the basic equations of liquid turbulence finally assume the following form:
where, is the horizontal component of velocity in the surface level of the liquid and is wave number (the number of radians per unit distance ()), which is a constant coefficient. In addition, three factors effect damping resulted by liquid flow which are: viscous depreciation in boundary layer near to solid boundaries, surface viscous depreciation resulted by surface pollution of liquid and hysterical capillary depreciation related to the meniscus surroundings of surface level of the liquid. The effects of above factors take into account depreciation statement by the coefficient of . In this coefficient, is the width of the tank and is equivalent coefficient of this damping in unit width. is the pollution coefficient that varies between 0 to 2 (it has been considered equal to 1 in the present study). The damping coefficient with above modification is given in Eq. (9), where, is the moment angular frequency of liquid turbulence and ν indicates the Kinematic viscosity of liquid [40]:
2.4. Modified equations for wave breaking phenomenon
Created waves in shallow liquid are faced with failure even under stimulation with small ranges. Eq. (9), was modified by Sun and Fojino et al. [38] to consider the wave breaking phenomenon in TLD simulation. The modified form of Eq. (9) is Eq. (11) in which is amplitude of simulation and [41]:
2.5. Obtaining dispersion relation in the liquid turbulence displacement
In the wave’s theory, the relationship between the wave number and the natural angular frequency of the wave is called dispersion relation. Dimensional dispersion relation is produced by discrete equation as follows [45]:
where, is the number of discrete tank divisions for discretization in the direction. Comparing the actual distribution with numerical dispersion relation, can be determined the number of tank divisions in a way that the actual distributions become equal to the numerical distribution [46]. In this case, we have:
The value of , from Eq. (13), is rounded to the largest integer.
2.6. Discretion of basic TLD equation
After dividing the tank into n parts, as shown in the Fig. 4, the mention Eqs. (14-26) are obtained [45]:
Fig. 4TLD division in X direction [41]
![TLD division in X direction [41]](https://static-01.extrica.com/articles/17809/17809-img4.jpg)
Thus, the basic equations that were of partial differential equations (PDE) type have now become ordinary differential equations (ODE). They are numerically solved with the desired time step having the stimulation acceleration time history and initial conditions by the program developed as a part of this study. Runge solves the equations-Kutta method [47, 48].
2.7. TLD base shear force
Fig. 5 shows how TLD damper controlling force is obtained by the difference of the loaded force to the side chambers of the tank. (In unit width):
Fig. 5Method of TLD operation [41]
![Method of TLD operation [41]](https://static-01.extrica.com/articles/17809/17809-img5.jpg)
2.8. The interaction of TLD and a structure with single degree of freedom
In general, the displacement equation of a single degree of freedom system is as follows:
In which , , , , , are displacements, velocity, acceleration, mass, damping coefficient and rigidity, respectively. The external force is loaded on, if the TLD is at the top of the structure:
where are stimulating force and base shearing force acting on the structure, respectively.
Stimulation force can be due to the base stimulation (earthquake) or direct stimulation (wind), sign of is considered as the opposite of acceleration sign in base simulation mode. For TLD system with single degree of freedom, equation of motion is as follows [21]:
To solve the above equation, it should be noted that is calculated from the Eq. (14). According to this equation, the amount of depends on the level of the free surface of the liquid at the end chambers of the tank. Determining , requires solving the Eqs. (4) and (5), the basic equations of turbulence.
On the other hand, to solve the basic equations of turbulence, it is essential to determine TLD stimulation acceleration time history. In this case, according to the simulation Eq. (1), TLD is located at the top of the structure. TLD stimulation acceleration is the acceleration that has been loaded by structure (external stimulation acceleration + relative acceleration of structure), thus, solving the basic equations of turbulence TLD involves solving the Eq. (17) and the total acceleration time history of the structure. Nevertheless, Eq. (17) and Eqs. (4) and (5) are not independent of each other and must be solved simultaneously. For numerical solution of equations, Eq. (17), that is a second order equation, it is essential to divide it into two first order equation [49, 50]. After being dimensionless equations [51], with the previous equations will present an ordinary differential equations (ODE) with +3 equations.
2.9. The interaction of TLD and structure with multiple degrees of freedom
Here, a system is modeled, that includes TLD and a structure with degrees of freedom; these masses are concentrated at nodes in this simulation. They have translational motion only along the x axis and cannot rotate. This condition shows shear behavior of the structure [52]:
In Eq. (31), is structure mass matrix, is structure rigidity matrix, is structure damping matrix, is vector of structure relative position change and th level position shift, with respect to lower level structure, are vectors of acceleration and velocity respectively, first and second derivatives of and is for basic stimulation (earthquake). In the case of arbitrary stimulation such as wind, it can be applied for stimulation for each story.
2.10. Formation of damping matrix
In this survey damping is considered as Rayleigh damping. In Rayleigh damping, damping matrix is obtained from linear combination of the mass and rigidity matrices [53]:
where , are appropriate coefficients, obtained from following equations:
In Eq. (33), the damping ratio () is for modes of and . After determining the coefficients and , structure damping matrix is determined.
2.11. Numerical solutions of the structure and TLD equations
The matrix of Eq. (31) can be divided into different classes of displacement equations. The above equations using the variable changes method and after being dimensionless and rearranging become to first order equation, and should be integrated with the basic turbulence equations and to be resolved at the same time [32, 46].
2.12. The system performance
System performance means effect of damper in reducing structural vibration. The quantity of which is shown with , is measured as follows in comparison of structural displacement with or without damper:
In Eq. (34), , are the maximum displacements with and without damper, respectively. The amount of is expressed as a percent amount.
3. Results and discussion
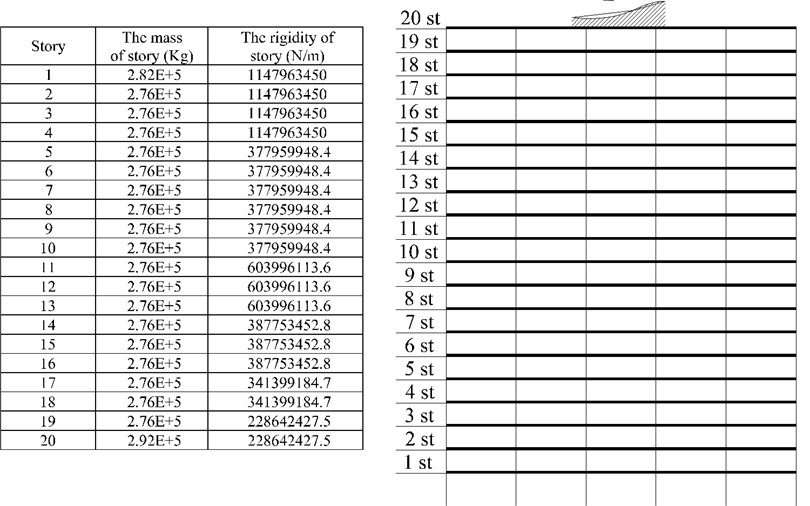
In this section, the behavior of a tall building under earthquake effect is studied in a controlled and uncontrolled damper mode. In this study, numerical studies have been performed on a two-dimensional frame. Fig. 6 shows a 20-story frame with 88.70-meter height. The damping ratio of 2 % that has been assumed for the first and second mode is related to the buildings that were designed for the second Phase of the SAC project by Brandow & Johnston Associates in 1996 [54]. In this paper, a hybrid system including a tuned liquid damper (TLD) and a tuned mass damper (TMD) is considered. Application of Genetic Algorithm and comparison between all of them was separately used, to reduce a structural response to earthquake simulation, for this purpose, ten earthquakes with different magnitudes, intensities, and the frequency ranges were used [55], and the results were compared the previous systems, after optimization.
Fig. 6Feature of under study structure
3.1. Hypotheses of the problem
The linear elastic behavior of structural materials was assumed to extract the system equations. The roof all stories was assumed rigid, and the ground displacement in steady foundation level without torsional component was assumed.
The earthquake acceleration used in this study (source: NEIC) are shown in Table 1.
3.2. Analyzing the structure controlled by tuned liquid damper
Before the analysis, the developed program was compared to results that were reported by Emili in 2013 [27]. The structural response, time histories acceleration and displacement with and without TLD, showed a good agreement.
The TLD is placed centrally on the structure as shown in Fig. 7. The TLD tanks are made up of acrylic sheet, having 4-mm-thick sidewalls and base plate. The structural model is made up of mild steel plate with sufficient thickness to ensure a hard floor, supported on four high-tensile steel rods of dimension 6×6×500 mm. The load on the slab is transferred to the columns through two cross beams having the same dimensions as the columns. The columns are connected to the slab and base plates by welding. The natural frequency of the structural model without tank was 1.9 Hz. The motion imposed on the structure is harmonic, with control over the amplitude and the frequency of oscillations [27].
Table 1The earthquake acceleration used in this study (source: NEIC)
Name of earthquake | Place | Year | Magnitude of earthquake | PGA | Earthquake duration (sec) |
EL centro | Huston | 1940 | 6.9 | 0.32 g | 39.09 |
Bam-IR | Iran | 2003 | 6.6 | 0.68 g | 48.14 |
Newhall | LA county fire station | 1994 | – | 0.59 g | 60 |
Oakland | Outer harbor harf | – | 0.28 g | 23 | |
Pomona | Locust | – | 0.15 g | – | |
Garmkhan | Iran | 1977 | 6.1 | 0.08 g | 29.44 |
Great Hanshin | Kobe-Japan | 1995 | 6.9 | 0.83 g | – |
Northridge | Los angeles | 1994 | 6.8 | 0.84 g | 29.98 |
Tabas | Iran | 1978 | 7.4 | 0.84 g | – |
Naghan | Iran | 1977 | 6.0 | 0.9 g | – |
Fig. 7TLD scale model performance test [27]
![TLD scale model performance test [27]](https://static-01.extrica.com/articles/17809/17809-img7.jpg)
3.3. Optimizing damper parameters using genetic algorithms (GA)
By using single- objective Genetic Algorithm, the number of chromosomes are 25 and the numbers of generations are 300. The possibilities of crossover and mutation are 0.25, 0.01 respectively. Differential equations governing the displacement of the controlled structure with TLD, based on the target function of top story’s displacement for Northridge earthquake are optimized, with changing range of [0.1, 0.5] and [0.1, 0.5], and are in meters.
Fig. 8Genetic algorithm operation with the target function of the maximum displacement of the top story in TLD system
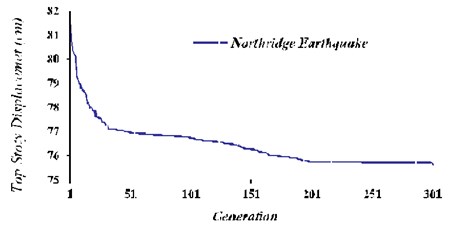
According to Fig. 8, it can be seen that after 200 generations, the objective function converges and optimal values for the quantities are obtained. For 0.45 m and 0.164 m that the results are provided in Table 2. is the ratio of the natural frequency of the liquid turbulence and structural natural frequency of the first mode, is the ratio of liquid’s mass inside the tanks to the structure’s mass and. is the number of rectangular tanks.
Table 2Optimal parameters in the control system with the TLD
0.45 | 0.164 | 0.02 | 1.06 | 1500 |
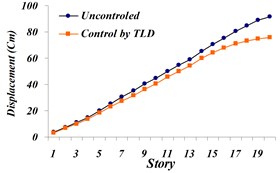
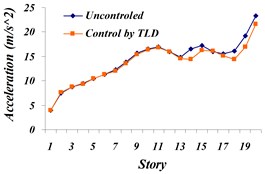
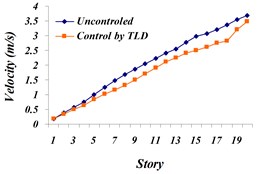
Fig. 9Comparison of: a) the maximum displacement of stories, b) the maximum acceleration of stories, c) the maximum velocity of stories in both cases, uncontrolled and TLD controlled structure for Northridge earthquake
a)
b)
c)
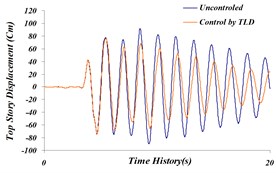
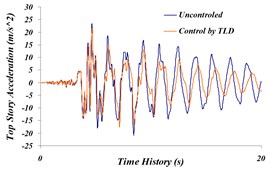
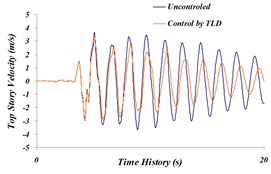
Fig. 10Comparison of time history of: a) the top story displacement, b) top story acceleration, c) top story velocity in both cases, an uncontrolled and TLD controlled structure for Northridge earthquake
a)
b)
c)
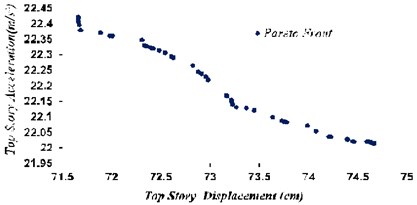
Fig. 11Optimal points of Pareto Front with target functions of maximum displacement and acceleration of the top story in TLD system
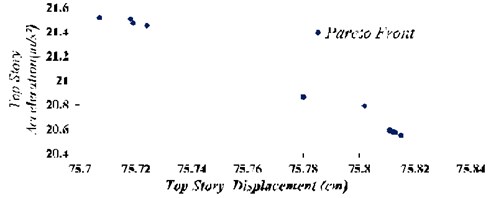
Based on the results in state –TLD controlled to uncontrolled, maximum story displacement decreased to 17.42 % and maximum story acceleration did not decrease much. The amount of this reduction on the top story is 7.2 %. For handling the lack of decrease, followed by multi-objective genetic algorithms, displacement, and acceleration of top story should be simultaneously optimized and Pareto Front graph should be obtained.
In this case, using multi-objective GA (maximum displacement and acceleration of the top story), 25 chromosomes and 300 generations and; 0.25, 0.01 are considered. Changing the range of and assumed to be similar to one- target method, differential equations based on target functions are optimized for the Northridge earthquake.
According to Fig. 11, can be chosen values of and that obtain maximum displacement and acceleration of the 75.8 cm and 20.55 m/s2 respectively, at the top story, which indicated 17.5 % and 11.6 % reduction respectively in the maximum displacement and acceleration of top story.
3.4. Analysis of the structure controlled by tuned mass damper and optimization of damper parameters using genetic algorithms (GA)
First, by using single-objective genetic algorithm, 25 chromosomes and 300 generations ( 0.25and 0.01) and changing range of [0.1, 0.5] and [0.5, 1.2]. In which (ratio of the TMD damping to the critical damping) and and (ratio of TMD rigidity to the effective rigidity of first vibration mode). The proportion of TMD mass to the structure’s mass is considered as 2 % for comparison. Differential equations ruling on the structure’s displacement controlled by tuned mass damper are optimized based on target function of the top story’s displacement for the Northridge earthquake.
Fig. 12Genetic algorithm operation with the target function of the top storys maximum displacement in TMD system
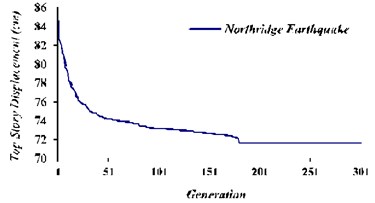
It is seen that after 180 generations, the target function becomes convergent and the optimal values for and are obtained. The results are presented in Table 3. By substituting these values in the equations of tuned mass damper system, the optimal response of structure (displacement of top story) for Northridge earthquake with structural damping ratio 2 % and 0.02 (the ratio of mass of TMD which installed at the highest level of structures to the mass of the structure) is obtained.
Table 3Optimal parameters in TMD system
0.02 | 0.9 | 0.1 |
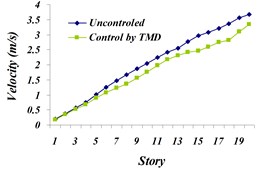
Fig. 13Comparison of: a) maximum displacement of stories, b) maximum acceleration of stories, c) maximum velocity of the stories in controlled and uncontrolled states by TMD for Northridge earthquake
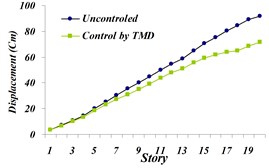
a)
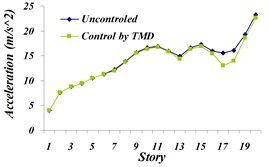
b)
c)
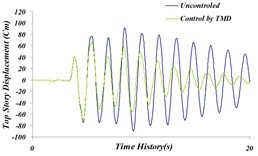
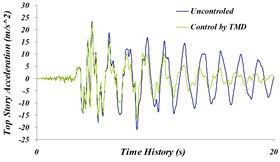
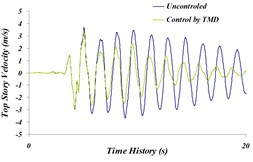
Based on the obtained results in comparison of controlled state by TMD with the uncontrolled state, the maximum displacement of the top story has been reduced by 21.71 % and maximum acceleration of stories has not been decreased much; it is the same as controlled state by TMD. The reduction in the top story is 3.2 %. It can be optimized simultaneously using a multi-objective genetic algorithm along with displacement and acceleration of the top story and the achieved Pareto Front Diagram.
Fig. 14Time history comparison of: a) top story’s displacement, b) top story’s acceleration, c) top story’s velocity in controlled and uncontrolled states by TMD for Northridge earthquake
In this state, using the multi-objective genetic algorithm (maximum displacement and maximum acceleration of top story), 25 chromosomes and 300 generations ( 0.25and 0.01) have been considered. The Changing range of and have been considered the same as those of the single-objective state. Differential equations ruling on the structure’s displacement controlled by tuned mass damper are optimized based on response set of Pareto target functions for Northridge earthquake. According to Fig. 15 choosing proper values of and results in maximum displacement and top story’s acceleration to be 74.7 cm and 22 m/s2 respectively, this indicates 18.7 % and 5.6 % reduction in displacement and acceleration respectively.
The reason why the reduction in maximum acceleration in the top story is low despite the existence of tangible damping in time history of top story’s displacement is related to the earthquake characteristics and passiveness of control system.
Fig. 15Optimal points of Pareto front with target functions of maximum displacement and maximum acceleration of the top story in TMD system
3.5. Analysis of hybrid structure controlled by tuned liquid damper and tuned mass damper
According to the characteristics of these two dampers, depreciation of vibrational energy in TLD System and deviation in vibration frequency of the structure from its first mode frequency in TMD System and their interaction, a better functioning can be expected of this synthetic damper system. To investigate the issue, two different states of this synthetic system are modeled, and the results are compared.
Fig. 16Modeling method of TLD and TMD hybrid systems

a)

b)
3.6. TLD tanks in proximity of TMD (Fig. 16(a))
In this state, using a single-objective genetic algorithm, 25 chromosomes and 600 generations ( 0.25and 0.01) and the changing range of [0.1, 0.5], [0.5, 1.2], [0.05. 0.25] and [0.1, 0.5], based on the target function of top story’s displacement for the Northridge earthquake are optimized, , the proportion of TMD’s and TLD’s mass to the structure’s mass is considered 2 % for a matching comparison.
It was observed that after 470 generations, the target function becomes convergent and the optimized values for , , , quantities are achieved. The results are shown in Table (4). By substituting these values in ruling equations (top story’s displacement) for the Northridge earthquake in the state with structure’s damping proportion of 2 % and 1350 (the number of rectangular tank) and TMD’s mass of 0.002 installed on the structure’s highest level, structure’s optimal response is achieved which is presented in Table 4.
Fig. 17Genetic algorithm operation with the target function of the top story’s maximum displacement in TLD and TMD systems, state (A)
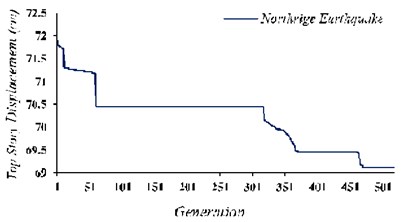
Table 4Optimal parameters in TMD and TLD systems, state (A)
0.45 | 0.164 | 0.018 | 0.06 | 1350 | 0.002 | 0.9 | 0.1 |
3.7. TLD tanks on the mass of TMD (Fig. 16(b))
In this state, using a single-objective genetic algorithm of target function, top story’s displacement is optimized. 25 chromosomes and 600 generations ( 0.25 and 0.01) have been considered. The changing rage of , , , and the proportion of the sum of the liquid mass inside TLD Tanks and the ratio of TMD Mass to the structure’s mass have been considered equal to the values in state (A).
Fig. 18Genetic algorithm operation with the target function of the top story’s maximum displacement in TLD and TMD system, state (B)
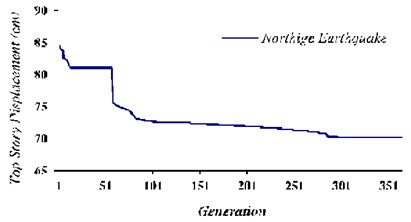
Results indicate that after 87 generations, the target function becomes convergent. The optimal values for the assumed quantities are presented in Table 5. By substituting these values in the equations of tuned liquid damper (top story’s displacement) for Northridge earthquake in the state with the structure’s damping proportion of 2 % and 1230 and TMD’s mass of 0.002 installed on the structure’s highest level the optimal response is achieved.
Table 5Optimal parameters in TMD and TLD system, state (B)
0.45 | 0.18 | 0.018 | 1.09 | 1230 | 0.002 | 0.82 | 0.12 |
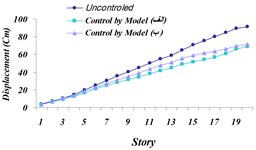
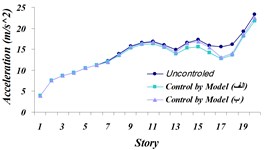
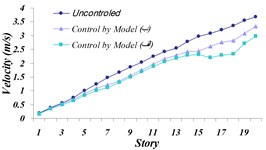
Fig. 19Comparison of: a) Maximum displacement of stories, b) maximum acceleration of stories, c) maximum velocity of the stories in three modeled states of (A) and (B) and the uncontrolled structure for the Northridge earthquake
a)
b)
c)
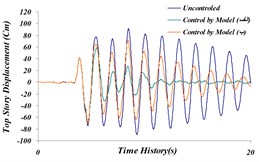
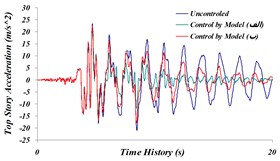
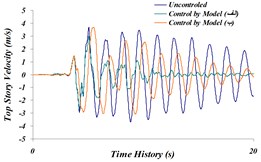
Fig. 20Time history comparison of: a) top story’s displacement, b) top story’s acceleration, c) top story’s velocity in three modeled states of (A) and (B) and the uncontrolled structure for the Northridge earthquake
a)
b)
c)
It is observed that in both modeling states, the maximum displacement of stories to the uncontrolled structure has decreased by 24.55 % in modeling (A) and by 22.5 % in modeling (B). Also, maximum acceleration of the top story is 6.3 % in modeling (A), and it is 3.5 % in modeling (B). According to the achieved results, it is observed that despite relatively same operation in reducing maximum displacement and maximum acceleration, modeling state (A) has shown more tangible damping in the time history, compared to modeling state (B). The reason behind more damping in displacement time history and acceleration of modeling (A) to modeling (B) can be due to a major part of TLD System operation being spent on dissipation of vibrational energy on TMD System. Thus, the system modeling (A) will be next going under final investigation and results will be compared.
Fig. 21Optimal points of pareto front with target functions of maximum displacement and acceleration of top story in TMD and TLD systems, state (A)
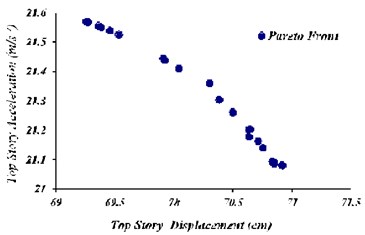
In this state, using multi-objective genetic algorithm (maximum acceleration and displacement of the story), a chromosome number of 25, a generation number of 300 and 0.25and 0.01 are considered. Change range of , , , is considered same as the single-objective state. According to Fig. 21 values of , , , can be selected to result in maximum displacement and acceleration as 70.9 cm and 21 m/s2 respectively, which indicated a decrease for maximum displacement as 22.8 % and 10 % for maximum acceleration.
3.8. Final comparison of results for systems under investigation
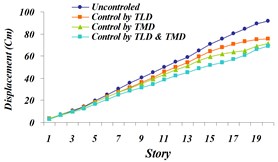
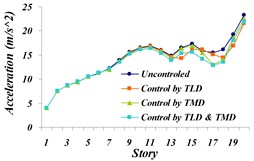
Fig. 22Comparison of: a) maximum displacement of stories, b) maximum acceleration of stories, c) maximum velocity of stories in uncontrolled and controlled structure with TLD, TMD and TLD-TMD system under investigation for the Northridge earthquake
a)
b)
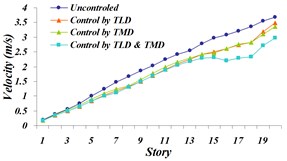
c)
Fig. 23Time history comparison of; a) top story’s displacement, b) top story’s acceleration, c) top story’s velocity in uncontrolled and controlled structure with TLD, TMD and TLD-TMD system under investigation for the Northridge earthquake
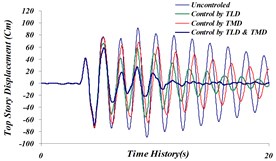
a)
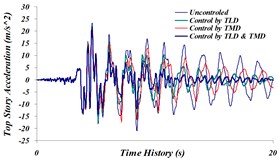
b)
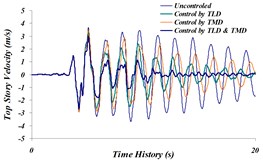
c)
3.9. Results of investigating 10 earthquakes under study
After extraction of results by weighted averaging method, the maximum displacement of the structure is calculated. This has been shown in Table 6.
Displacement Reduction Percentage is calculated as:
3.10. Generalization of the results to other investigated stimulations
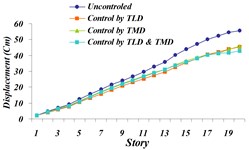
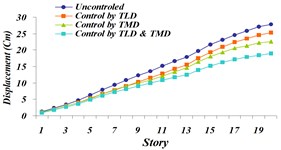
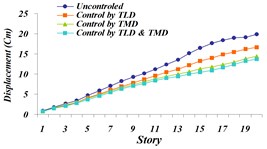
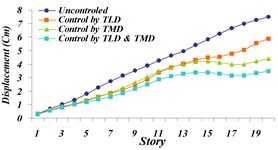
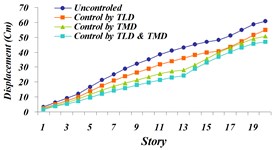
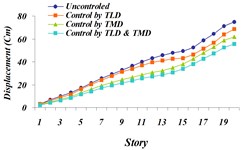
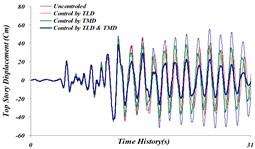
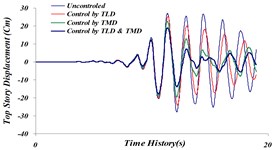
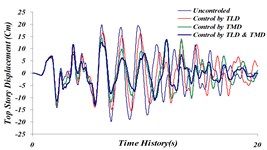
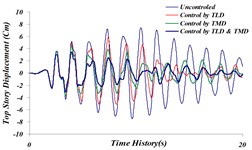
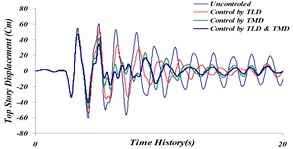
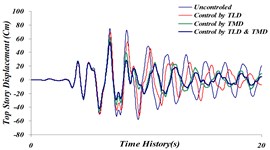
Figs. 24 and 25 indicate that reduction of maximum displacement of stories and damping in time history of top story’s movement occurs in Hybrid System, consisting of TMD and TLD. Corresponding values of mean reduction in the maximum displacement of the top story for the investigated earthquakes is shown in Table 6.
Fig. 24Comparison of maximum displacement for 4 investigated states: a) Tabas, b) Bam, c) El centro, d) Panama, e) Naghan, f) Kobe ground motion
a)
b)
c)
d)
e)
f)
Fig. 25Comparison of time history of top story’s displacement for 4 investigated states: a) Tabas, b) Bam, c) El centro, d) Panama, e) Naghan, f) Kobe ground motion
a)
b)
c)
d)
e)
f)
Table 6Values of maximum displacement reduction (percentage) in investigated system
System | TLD | TMD | TLD&TMD | PGA |
earthquake | ||||
Northridge | 17.42 | 21.71 | 24.55 | 0.84 g |
Naghan-IR | 9.72 | 16.53 | 22.28 | 0.9 g |
Pomona | 21.87 | 41.60 | 53.73 | 0.15 g |
Bam-IR | 8.91 | 18.61 | 32.04 | 0.64 g |
Garmkhan-IR | 38.99 | 60.78 | 64.05 | 0.08 g |
Kobe | 8.17 | 17.07 | 25.94 | 0.83 g |
Tabas-IR | 18.09 | 17.44 | 23.06 | 0.84 g |
El centro | 16.79 | 27.38 | 30.91 | 0.32 g |
Newhall | 8.75 | 16.65 | 28.90 | 0.59 g |
Oakland | 13.38 | 12.00 | 18.00 | 0.28 g |
Mean % reduction | 13.12 | 19.54 | 26.92 |
4. Conclusions
Using tuned liquid damper there is a substantial reduction in structural response (displacement, acceleration, and velocity of the structure’s stories) against different earthquakes. The main reason behind this result is a dissipation of vibration energy through fluid turbulence. The inductor of this control is the shear force due to the difference in pressure exerted on the terminal chambers of the container. By putting the tuned liquid damper at the highest level of the structure the acceleration of the stories decreases, leading to a reduction of the shear force due to earthquakes.
The tuned mass damper system separated the structure’s vibration frequency from its natural frequency. Using this damper structure’s responses (displacement, acceleration and story’s velocity) can be significantly reduced.
By integrating the controlled structure with tuned mass damper and tuned liquid damper, the structure’s vibration frequency throughout the earthquake is separated from the earthquake’s frequency. And the response of the structure reduces compared to the uncontrolled state and controlled state with tuned liquid damper in which, tangible cause in displacement reduction systems under investigation, maximum acceleration. And velocity in the top story being low despite tangible damping in time history is related to the earthquake’s characteristics and the passiveness of systems under investigation.
The reason behind more damping in the displacement, acceleration and velocity time history of the modeled (A) compared to a system modeled (B) can be due to a significant part of TLD System operation being spent on depreciation of vibrational energy on TMD System and with vibration reduction of TMD System. Further, system functioning decreases with TMD System vibrations.
References
-
Den Hartog J. P. Mechanical Vibrations. Mc-Graw-Hill Inc., New York, NY, 1956.
-
Villaverde R. Seismic control of structures with damped resonant appendages. Proceedings of World Conference on Structural Control, Los Angeles, California, USA, 1994, p. 113-119.
-
Pinkaew T., Lukkunaprasit P., Chatupote P. Seismic effectiveness of TMDs for damage reduction of structures. Engineering Structures, Vol. 25, 2003, p. 39-46.
-
Pinelli J. P., Hu S., Gutierrez H., Casier F. Multiple distributed tuned mass dampers: an exploratory study. Proceedings of Extreme Loading, Toronto, Canada, 2003.
-
Ambrosini D., Bassotti R. Control of torsional response in asymmetrical buildings subjected to seismic loading by using TMDs. Proceedings of 4WCSCM, San Diageo, USA, 2006.
-
Matsui Masahiro, Tamura Yukio Development of a hybrid vibration experiment system for determining wind-induced responses of buildings with tuned dampers. Journal of Wind Engineering and Industrial Aerodynamics, Vol. 96, 2008, p. 2033-2041.
-
Zhang Z., Balendra T. Passive control of bilinear hysteretic structures by tuned mass damper for narrow band seismic motions. Engineering Structures, Vol. 54, 2013, p. 103-111.
-
Rosenberg R. S. Simulation of Genetic Populations with Biochemical Properties. Ph.D. Thesis, University of Michigan, Ann Harbor, Michigan 1967.
-
Casalotti A., Arena A., Lacarbonara W. Mitigation of post-flutter oscillations in suspension bridges by hysteretic tuned mass dampers. Engineering Structures, Vol. 69, 2014, p. 62-71.
-
Domaneschi M., Martinelli L., Po E. Control of wind buffeting vibrations in a suspension bridge by TMD: hybridization and robustness issues. Computers and Structures, Vol. 155, 2015, p. 3-17.
-
Mrabet Elyes, Guedri Mohamed, Ichchou Mohamed, Ghanmi Samir New approaches in reliability based optimization of tuned mass damper in presence of uncertain bounded parameters. Journal of Sound and Vibration, Vol. 355, 2015, p. 93-116.
-
Berardengo M., Cigada A., Guanziroli F., Manzoni S. Modelling and control of an adaptive tuned mass damper based on shape memory alloys and eddy currents. Journal of Sound and Vibration, Vol. 349, 2015, p. 18-38.
-
Etedali Sadegh, Sohrabi Mohammad Reza, Tavakoli Saeed An independent robust modal PID control approach for seismic control of buildings. Journal of Civil Engineering and Urbanism, Vol. 3, Issue 5, 2013, p. 279-291.
-
Nateghi Elahi Energy Dampers in Seismic Retrofitting of Buildings. Research Center of Seismology and Earthquake Engineering, 1999.
-
L. M., Lfujino, Pacheco, B. M., Chaiseri L. Modeling of tuned liquid damper (TLD). Journal of Wind Engineering and Industrial Aerodynamics, Vols. 41-44, 1992, p. 1883-1894.
-
Mahatma S., Koh C. G., Wang C. M. Reduction of structural vibrations by multiple – mode liquid dampers. Engineering Structures, Vol. 17, Issue 2, 1995, p. 123-127.
-
Sun L. M., et al. A model of TLD for suppressing pitching motions structures. Earthquake Engineering and Structural Dynamic, Vol. 24, 1995, p. 625-936.
-
Reed Dorothy, Yeh Harry, Yu Jinkyu, Gardarsson Sigurdur Tuned liquid dampers under large amplitude excitation. Journal of Wind Engineering and Industrial Aerodynamics, Vols. 74-76, 1998, p. 923-930.
-
Chang C. C., Gu M. Suppression of vortex-excited vibration of tall buildings using tuned liquid dampers. Journal of Wind Engineering and Industrial Aerodynamics, Vol. 83, 1999, p. 225-237.
-
Frandsen J. B. Numerical predictions of tuned liquid tank structural systems. Journal of Fluids and Structures, Vol. 20, 2005, p. 309-329.
-
Taita M. J., El Damatty A. A., Isyumovb N., Siddique M. R. Numerical flow models to simulate tuned liquid dampers (TLD) with slat screens. Journals of Fluids and Structures, Vol. 20, 2005, p. 1007-1023.
-
Marivani M., Hamed M. S. Numerical simulation of structure response outfitted with a tuned liquid damper. Computers and Structures, Vol. 87, 2009, p. 1154-1165.
-
Debbarma Rama, Chakraborty Subrata, Ghosh Saibal Kumar Optimum design of tuned liquid column dampers under stochastic earthquake load considering uncertain bounded system parameters. International Journal of Mechanical Sciences, Vol. 52, 2010, p. 1385-1393.
-
Love J. S., Tait M. J., Toopchi-Nezhad H. A hybrid structural control system using a tuned liquid damper to reduce the wind induced motion of a base isolated structure. Engineering Structures, Vol. 33, 2011, p. 738-746.
-
Ohno Ken-ichi, Suzuki Hayato, Sawada Tatsuo Analysis of liquid sloshing of a tuned magnetic fluid damper for single and co-axial cylindrical containers. Journal of Magnetism and Magnetic Materials, Vol. 323, 2011, p. 1389-1393.
-
Love J. S., Tait M. J. Non-linear multimodal model for tuned liquid dampers of arbitrary tank geometry. International Journal of Non-Linear Mechanics, Vol. 46, 2011, p. 1065-1075.
-
Bhattacharjee Emili, Halder Lipika, Sharma Richi Prasad An experimental study on tuned liquid damper for mitigation of structural response. International Journal of Advanced Structural Engineering, Vol. 5, Issue 3, 2013.
-
Love J. S., Tait M. J. Parametric depth ratio study on tuned liquid dampers: fluid modelling and experimental work. Computers and Fluids, Vol. 79, 2013, p. 13-26.
-
Love J. S., Tait M. J. The nonlinear peak response distribution of structure – TLD systems during common wind events. Engineering Structures, Vol. 100, 2015, p. 226-237.
-
Sonmez E., Nagarajaiah S., Sun C., Basu B. A study on semi-active tuned liquid column dampers (sTLCDs) for structural response reduction under random excitations. Journal of Sound and Vibration, Vol. 362, 2016, p. 1-15.
-
Etedali Sadegh, Tavakoli Saeed PD/PID controller design for seismic control of high-rise buildings using multi-objective optimization: a comparative study with LQR controller. Journal of Earthquake and Tsunami, Vol. 11, Issue 1, 2017, p. 1750009.
-
Coello C. A., Christiansen A. D. Multi objective optimization of trusses using genetic algorithms. Computer and Structures, Vol. 75, 2000, p. 647-660.
-
Fonseca C. M., Fleming P. J. Genetic algorithms for multi-objective optimization: formulation, discussion and generalization. Proceedings of the 5th International Conference on Genetic Algorithms, 1993, p. 416-423.
-
Srinivas N., Deb K. Multi objective optimization using non-dominated sorting in genetic algorithms. Evolutionary Computation, Vol. 2, Issue 3, 1994, p. 221-248.
-
Schaffer J. D. Multiple objective optimization whit vectors evaluated genetic algorithms, in grefenstette. Proceedings of 1st International Conference on Genetic Algorithms and Their Applications, London, Lawrence Erlbaum, 1985, p. 93-100.
-
Zitzler E., Thiele L. An Evolutionary Algorithm for Multiobjective Optimization: The Strength Pareto Approach. Technical Report 43, Computer Engineering and Federal Institution of Technology, Zurich, 1998.
-
Knowles J., Corne D. The Pareto archived evolution strategy: a new baseline algorithm for multiobjective optimization. Proceedings of the Congress on evolutionary computer, Piscataway, NJ, 1999, p. 98-105.
-
Sun L. M., Fujino Y., Pacheco B. M., Isobe M. Nonlinear waves and dynamic pressures in rectangular tuned liquid damper (TLD) – simulation and experimental verification. Doboku Gakkai Rombun-Hokokushu/Proceedings of the Japan Society of Civil Engineers, 1989, p. 81-92.
-
Sun L. M., Fujino Y., Pacheco B. M., Chaiseri P. Tuned liquid damper for suppressing horizontal motion of structures. Journal of Engineering Mechanics, Vol. 118, 10, p. 2017-2030.
-
Koh C. G., Mahatma S., Wang C. M. Theoretical and experimental studies on rectangular liquid damper under arbitrary excitations. Earthquake Engineering and Structural Dynamic, Vol. 23, 1994, p. 17-31.
-
Murdui Banerji Tuned liquid dampers for controlling earthquake response of structures. Earthquake and Engineering and Structural Dynamics, Vol. 29, 2000, p. 587-602.
-
S-Vulpine Continuum Mechanics of Writing. Translations Doctor Kalantari Faculty Members of Guilan University.
-
Abubaker Salsala, Ngana S., Nasar T. Particle swarm optimized fuzzy control of structure with tuned liquid column damper. Global Journal of Pure and Applied Mathematics, Vol. 12, Issue 1, 2016, p. 875-886.
-
Soong T. T., Dargosh G. F. Passive Energy Dissipation System in Structural Engineering. London Wiley and Sons, 1997.
-
Shimizu T., Hayama S. Nonlinear response of sloshing based on the shallow water wave theory. JSME International Journal, Vol. 30, Issue 236, 1987, p. 806-813.
-
Marler R. T., Arora J. S. Survey of multi- objective optimization methods for engineering. Structural and Multidisciplinary Optimization, Vol. 26, 2004, p. 369-395.
-
Gill F. A process for the step by step integration of differential equations in an automatic digital computing machine. Mathematical Proceedings of the Cambridge Philosophical Society, Vol. 47, 1951, p. 96-108.
-
Applied Numerical Methods. John Wiley and Sons, New York, Chichester, Brisbane, Toronto, Singapore.
-
Ogata K. Modern Control Engineering. Prentice-Hall of India, 2005.
-
Hatch M. R. Vibration Simulation Using MATLAB and ANSIS. CRC Press, 2000.
-
Fayez Mohsenzadeh A. Investigation of the Fluid Damper Arranged on the Shear Structures. Master’s Thesis. Sharif University of Technology, 1998.
-
Wakahara T., Ohayama T., Fuji K. Suppression of wind induction vibration of a tall building using tuned liquid damper. Journal of Wind Engineering and Industrial Aerodynamics, Vols. 41-44, 1960, p. 1992-1895.
-
Chopra A. K. Dynamics of Structures. 4th Edition, Pearson, 2012.
-
Ohtori R. E., Christenson B. F., et al. Benchmark control problems for seismically exited nonlinear buildings. Journal of Engineering Mechanics, Vol. 130, Issue 4, 2004, p. 366-385.
-
Acceleration Graph of the Islamic Republic of Iran. Housing Research Center, 2014.
