Abstract
In order to investigate the mechanical behavior and deformation characteristic of dual-angle steel with cruciform section, this paper presents a series of dynamic compression tests performed on the compound members. The specimens are designed with different width-to-thickness ratios and slenderness ratios. The cruciform plates are used as interconnectors between two components, with three or four bolts connecting each face and angle limb. The experimental results indicate that the failure mode of core members is a mixture of flexural buckling and local instability. The internal force distribution of two sub-members is asymmetric, with the ratios varying from 1.04 to 1.31. A simplified finite element model is then developed to stimulate their experimental behavior. The analytical model is verified by experimental results and proved to be precise and reliable. Moreover, the theoretical analysis is performed to investigate the critical stresses due to different buckling modes. The bearing capacity predicted by Chinese standard is proved to be not conservative, on this basis, a modified design approach is proposed, and the design capacities fit the test data well.
1. Introduction
Due to the development of the power grid and the promotion of loading criterion, increasing amount of high-capacity, high-voltage and multi-loop transmission lines have been constructed. These impose greater loads on latticed steel towers, both dead loads and wind loads. As a result, there has been increased widespread use of Q420 steel (nominal yield stress equal to 420 MPa) in China [1]. Furthermore, Q420 dual-angle steel has been applied in a large amount of transmission lines, including 500 kV, ±800 kV and 1000 kV ultra-high voltage lines, and manufacturers have gained a lot of experiences in processing such products.
In traditional design procedures, the lattice towers are usually assumed to follow the ideal elastic truss model. In such a model, the members are pin-jointed and concentrically loaded. The sectional strength and overall stability are then verified correspondingly [2, 3]. Meanwhile, prototype test results of ultra-high voltage transmission towers, as depicted in Fig. 1, show that the compound members mainly buckle around the imaginary axis, but not the minimum axis as determined in the design procedure [4]. According to the experimental data provided by electrical power construction research institute, the reduction of critical stress due to torsion is equivalent to the effective length increasing 10-20 %.
In order to increase the capacity of existing towers, the designers have adopted a method of reinforcing tower limbs by attaching additional angle members, which are with the same size as the existing ones and connected corner-to-corner to the tower limbs using filled plates and bolts, as shown in Fig. 2. Since 2000s, many experimental and theoretical studies have been conducted on the compound members. Temple et al. [6] conducted several experimental tests on built-up members to study the effect of the interconnector arrangement and types. The results showed that the arrangement of interconnectors did not have a significant effect on the bearing capacity. Similar tests were carried out by other scholars [5], the results indicated that, among the three types of filled plate, including aligned plates, alternate plates and cruciform plates, the load-carrying capacity of members with cruciform filled plates is a little higher than other types of members.
Fig. 1Failure modes of prototype test towers
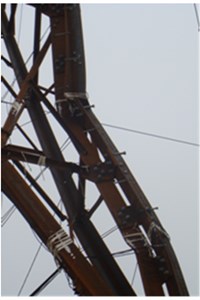
a) ±800 kV HVDC test tower
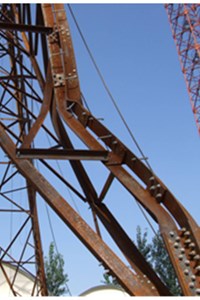
b) 1000 kV HVAC test tower
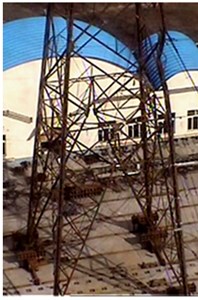
c) 500 kV HVAC test tower
Fig. 2Angle sections and neutral axis

The effects of joint slippage have attracted the attentions of many researchers. N. Ungkurapinan et al. [7] conducted the experimental tests on 36 joints to study their slip and load-deformation behavior. It was found that joint slip was significant under service loads, and joint deformation should be considered in the analysis of transmission line towers. The effect of joint slippage on loading capacity of steel towers was also studied by Fong et al. [8]. It concluded that the joint slippage would affect the tower displacement but not the failure modes, and eccentricity which reduces capacity compared to ideal centric loading. Ahmed et al. [9] concluded that joint slippage has a significant influence on tower by either reducing its load capacity or increasing deflections under working loads. W. Q. Jiang et al. [10] studied joint slippage effects with the results obtained from prototype tests on single-circuit 110 kV and 220 kV towers. The study concluded that the effect of joint slippage on the bearing capacity was determined by the magnitude of the applied vertical load and the associated failure mode.
The numerical simulations have also been applied to study the mechanical behavior of steel towers and compound members. Albermani and Kitipornchai [11] presented a nonlinear analytical method, with considering both material and geometric nonlinearity to predict latticed tower failure. The advanced models were created by Lee P. S., McClure G. [12] to obtain accurate predictions of latticed steel towers using finite element analysis. A simplified 2D model using a simple locking system between ‘locking stripes’ on the component members was developed by Yan Zhuge et al. [5] to model the multi-panel retrofitted towers.
However, less research has been conducted on the force distribution of different sub-members, and calculation method within Chinese standard is not accurate. Structure designers remain uncertain about the true safety redundancy and have to increase member dimensions. The dynamic experimental results of prototype steel towers do not match the theoretical results well, and the compound leg members fail before reaching the predicted bearing capacity. Moreover, the force mechanism and deformation characteristics of dual-angle steel are not so clear.
This paper presents a series of dynamic compression tests on twelve groups of specimens with different slenderness ratios and width-to-thickness ratios. The test members are fabricated from Q420 high-strength steel. A simplified shell model is developed in ANSYS and an elasto-plastic bi-linear model represents the material property of the steel. A modified design approach for the bearing capacity of the compound members is proposed.
2. Dynamic experimental investigations
2.1. Test specimens
Due to the field investigation results of latticed transmission towers and limited experimental conditions, cruciform sectioned dual-angle steel with specifications of 2L125×8 (two L125×8 angles combined with a cruciform cross-section), 2L140×12, and 2L160×10 were selected as tested specimens. The clearance between each component was 14 mm and the slenderness ratios of core members were set as 30, 40, 50, and 60. Test specimens were fabricated from Q420 high strength steel with a Young’s modulus of 200 GPa. The specimens were divided into 12 groups, with 3 members in each group, as summarized in Table 1.
The cruciform welded plate, with thickness of 14 mm, was used as interconnector between sub-members. For angle steel with limb width of 125 mm and 140 mm, the cruciform plate and each angle limb was connected with 3M20 bolts, and 4M20 bolts were adopted for that with limb width of 160 mm. The detail dimensions of different types of cruciform plates are shown in Fig. 3. Grade 8.8 high strength bolts were employed and tightened to a specified torques by dynamometric wrench, just as the way in practical engineering.
Fig. 3Two types of cruciform plates
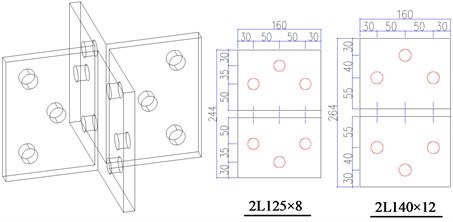
a) Type 1 plate with 3 bolts in each face
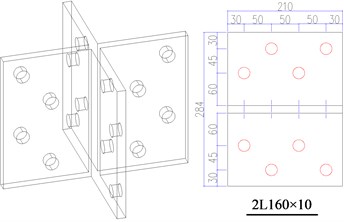
b) Type 2 plate with 4 bolts in each face
Table 1The detail of test specimens
Member size | Actual yield stress / MPa | Slenderness ratio | Quantity of cruciform plates | Arrangement of cruciform plates | Bolts number in each face |
2L125×8 | 517 | 30 | 2 (Type 1) | 1/3L, 2/3L | 3M20 |
40 | 2 (Type 1) | 3M20 | |||
50 | 2 (Type 1) | 3M20 | |||
60 | 2 (Type1) | 3M20 | |||
2L140×12 | 472 | 30 | 2 (Type 1) | 1/3L, 2/3L | 3M20 |
40 | 2 (Type 1) | 3M20 | |||
50 | 2 (Type 1) | 3M20 | |||
60 | 2 (Type 1) | 3M20 | |||
2L160×10 | 505 | 30 | 2 (Type 2) | 1/3L, 2/3L | 4M20 |
40 | 2 (Type 2) | 4M20 | |||
50 | 2 (Type 2) | 4M20 | |||
60 | 2 (Type 2) | 4M20 |
Meanwhile, tensile coupon tests were carried out with standard specimens extracted from test members to obtain the material properties. As there is no obvious yield platform, the static 0.2 % proof stress was taken as yield stress. The results showed that the steel plates with thicknesses of 8 mm, 10 mm, and 12 mm had yield stresses of 517 MPa, 505 MPa, and 472 MPa, respectively.
2.2. Test set-up and procedure
As illustrated in Fig. 4(a), the dynamic compression was applied horizontally as the effect of self-weight was negligible. Test sections were connected to common sections and loading sections with encased angles, gusset plates, and a series of bolts. Two 6000 kN spherical hinges, with outer diameter of 450 mm and total height of 120 mm, were placed between loading sections and loading equipment to simulate pin-connections as designed. The common sections consisted of 2L160×14 with the corresponding slenderness ratios of the test sections, and loading sections were also composed of 2L160×14 with a length of 500 mm. The loading sections were welded to the 40 mm-thick end plates by partial penetration welds. The square end plates were 500 mm wide to confirm full contact with spherical hinges and enough local rigidity.
The lateral brace was designed with the bearing capacity no more than 2.5 % of that of core member, and single angle of L75×10 was selected. The lateral braces were connected to the splices of test section and common section horizontally and vertically, using 2M20 grade 8.8 bolts. To simulate boundary conditions in real latticed towers, the other ends of the lateral braces were connected to the flange plates of fixed H-shape beams with 2M20 bolts. A 3000 kN hydraulic jack was employed to apply dynamic loadings at one side, and the other side was set contact with the reaction wall.
Fig. 4Experimental set-up of test specimens

a) Diagram of experimental set-up
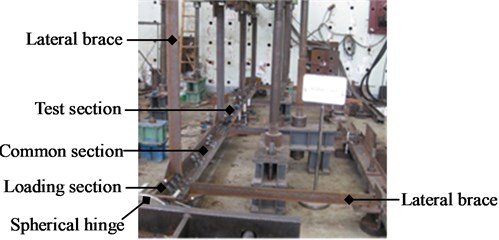
b) Field test set-up
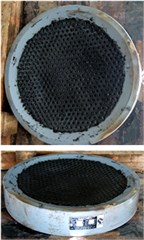
c) Spherical hinge
The compression tests were conducted by applying multi-stage loading, and each load step was held for 1-2 minutes. Before the tests were conducted, a theodolite was used to ensure test specimens were loaded in the center, and electrical resistance strain gauges and displacement meters were placed at the typical positions of test specimens. The strain gauge dimension was 10.0 mm × 4.0 mm, with maximum ultimate strain value of 2-3 %.
As depicted in Fig. 5, twelve strain gauges were mounted at half the length of the compound members, with six in each angle, and four gauges were placed at a quarter length from each end. Four displacement meters, with measuring range of ±100 mm, were arranged at four corners of end plate in the loading side to measure the axial shortening during loading process. At the regular interval, a data acquisition system, named DH3816, was adopted to record the readings of strain gauges and displacement meters.
Fig. 5Arrangement of strain gauges in core member

2.3. Test results
2.3.1. Failure modes
In the early stage of loading, the compound members remained elastic, and no obvious deformation was observed. The strain and displacement developed approximately linearly. With the increasing of compression, the strains at typical positions bifurcated gradually. When reached the ultimate bearing capacity, the strains descended immediately, and the axial shortening increased rapidly. Meanwhile, the overall flexural deformation and local buckling developed rapidly.
The failure modes of different test specimens were illustrated in Fig. 6. The experimental failure modes were a little different from the ideal ones. The failure mode of core members was a mixture of overall flexural buckling and local instability. In general, test members with slenderness ratios of 30 and 40, failed by local buckling, while the overall flexural deformation was not so obvious. For the test members with slenderness ratios of 50 and 60, failure was governed by overall buckling, and local buckling also occurred. The core members mainly bent around imaginary axis (w-w axis), not the minimum axis (u-u axis) as predicted in design process. The similar phenomenon was also observed in prototype tests of steel towers, as shown in Fig. 1.
The local buckling occurred at the member sections, which located in the vicinity of filled plates and gusset plates. It was assumed that the member sections connected with filled plates or gusset plates had relatively larger local rigidity than other parts of members, and these sections could not be deformed compatibly with other parts. Thus, the stress concentrated in the angle limbs adjacent to filled plate or gusset plate, causing the local failure. After the tests were over, no obvious deformations were found on the surface of connection bolts or filled plates.
2.3.2. Load-bearing capacity
Fig. 7 describes the strain development in the midsection of a typical specimen (2L125×8 – λ= 40). During the loading process, the strains in different angle tips showed great differences. The strain of the angle back in each sub-member developed consistently, but the internal forces of two components were unequal. It was assumed that additional moment was produced due to the relative movements between sub members, and the moment resulted in uneven forces in different sub-members.
As for dual-angle cruciform sections, the angle back of each component was relatively close to the neutral axis, so sectional stress caused by additional moment at this positions could be neglected. The internal force of each angle was estimated approximately due to the strain readings in angle backs, could be expressed by Eq. (1) and (2):
Fig. 6Failure modes of test specimens
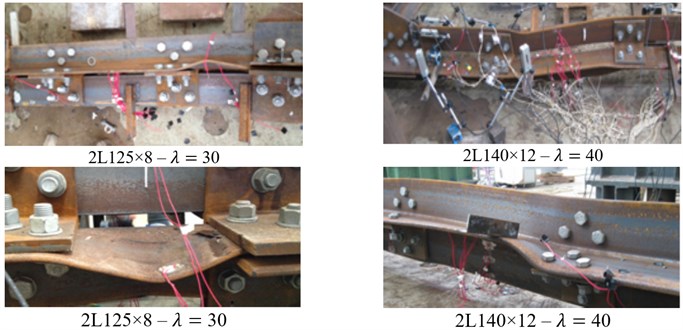
a) Overall buckling
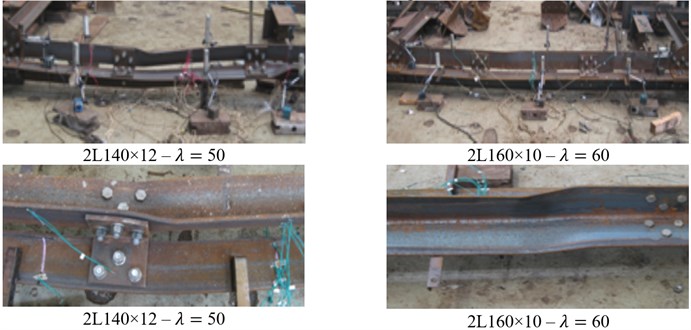
b) Local buckling
Fig. 7Strain development in the mid-section (2L125×8 – λ= 40)
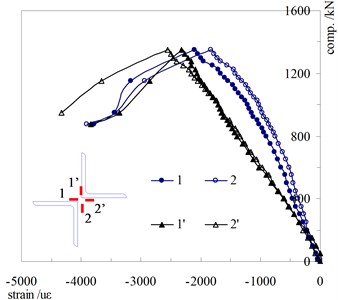
a) Angle back
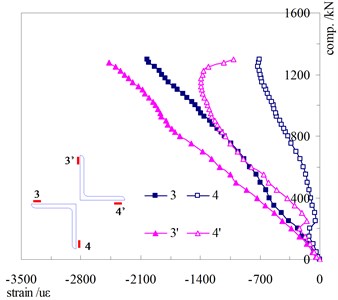
b) Angle tip
Table 2 listed the axial forces calculated due to the measuring strains recorded at design loads. It can be seen from the table that the value of N1/N2 ranged from 1.04 to 1.31, with the mean value of 1.157 and standard deviation (SD) value of 0.09. The similar results were also obtained from prototype tower tests, and it should be considered in later design procedure.
Table 2Internal forces of different angle limbs
Specification | λ | (ε1+ε2)/2 | (ε'1+ε'2)/2 | N1/kN | N2/kN | N2/N1 |
2L125×8 | 30 | 1976 | 2598 | 780.5 | 1026.2 | 1.31 |
40 | 1876 | 2338 | 740.9 | 923.7 | 1.25 | |
50 | 1780 | 2223 | 703.1 | 878.1 | 1.25 | |
60 | 1746 | 1975 | 689.6 | 780.0 | 1.13 | |
2L140×12 | 30 | 2523 | 2651 | 1640.3 | 1723.4 | 1.05 |
40 | 2212 | 2510 | 1437.9 | 1631.5 | 1.13 | |
50 | 1909 | 2366 | 1241.4 | 1538.3 | 1.24 | |
60 | 1727 | 2073 | 1122.9 | 1347.8 | 1.20 | |
2L160×10 | 30 | 2415 | 2672 | 1521.5 | 1683.4 | 1.10 |
40 | 2108 | 2195 | 1328.4 | 1382.9 | 1.04 | |
50 | 1770 | 1966 | 1115.1 | 1238.6 | 1.11 | |
60 | 1569 | 1672 | 988.2 | 1052.8 | 1.07 | |
Mean value, Nm | 1.157 | |||||
SD value, SN | 0.09 | |||||
3. Numerical simulations
Following the completion of experimental tests, a simplified finite element (FE) model was developed to create the compound members using ANSYS, and the simulated data obtained was compared with test results. A four-node Shell181 element was selected to simulate steel angle and cruciform plate instead of solid element, as their plane dimensions were greater than thickness and with the objective to reduce computational processing and storage space. The steel material of angles and filled plates was modeled by an idea elasto-plastic bi-linear model, with material properties from tensile coupon tests, as shown in Fig. 8(a). The poisson’s ratio was taken as 0.3 and modulus of elasticity (MOE) was 2.0×10⁵ MPa. The end plate was created with Solid45 element, and its MOE was set as 2×10⁸ MPa to increase local stiffness and reduce the local stress concentration in the bearings.
Fig. 8Analytical results of compound members
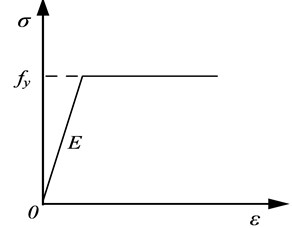
a) Ideal bi-linear model of steel
b) Node DOF coupling

c) Failure pattern
d) Stress distribution of angle limbs
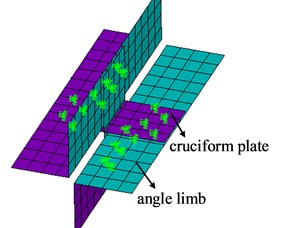
In the simplified model, node DOF (degree of freedom) coupling method between angle limbs and filled plates was introduced to simulate bolt connections. The filled plates and angle limbs were coupled with three degrees of freedom (ux, uy, uz) in corresponding positions of bolts. Firstly, the Eigen bulking analysis was performed, and the corresponding mode shapes were obtained by adopting a Block Lanczos eigenvalue extraction method. The imperfect model was then created based on the mode shapes of the imaginary axis buckling. The dynamic compression was applied and large deformation option was activated.
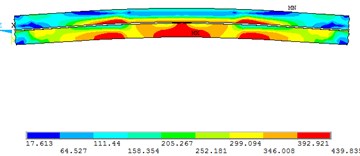
The simulated failure modes of core members showed similar trend with the test results, the model bent around the imaginary axis and local buckling occurred in the angle limbs, the distribution of Mises Stress was illustrated in Fig. 8(d). It can be seen from Table 5 that, the mean value and SD value of test strength to FEA strength (PExp/PFEA) are 1.06 and 0.036 respectively. Since the FEA results are in good accordance with test results, the simplified FE model can be further applied to model the compound members with various sizes.
4. Theoretical analyses
4.1. Cruciform plate spacing
For the dual-angle cruciform section, Chinese standard [13] requires that under axial compression, the filled plate spacing of compound members does not exceed 40i, where i is the gyration radius of sub-member, and the plate quantities between every two lateral bracing points should not be less than two. While for BS standard [14], the spacing is specified to be no more than 70i. ASCE [15] stipulates that the slenderness ratio between two filled plates does not exceed three quarters of that of the single angle. Table 3 lists the maximum filled-plate spacing of different member sizes, and comparisons with different standards. Compared with other design standards, the spacing requirements of filled plates in Chinese standard are more stringent, and the plate spacing of test members can satisfy the provisions. According to the investigation results of Temple et al. [6], we know that too many filled plates are uneconomical, and have no obvious effect on bearing capacities of compound members.
Table 3Filled plate spacing of test members
Specification | Filled plates spacing / mm | Bolts number in each face | SGB 40i / mm | SEN 70i / mm | SBS 50i / mm |
2L125×8 | 977 | 3 | 1000 | 1750 | 1250 |
2L140×12 | 1086 | 3 | 1108 | 1939 | 1385 |
2L160×10 | 1253 | 4 | 1280 | 2240 | 1600 |
4.2. Local stability
An equilibrium equation based on the small deflection buckling theory of thin plate under unidirectional uniform compression is shown as Eq. (3). For the angle limb here, it can be assumed as a plate with one side simply supported and other three sides free, the buckling coefficient of it can be taken as k= 0.425. The local buckling stress can be evaluated with Eq. (5), and it is determined by the width-to-thickness ratio (b/t):
For compression members, the local buckling cannot happen before overall instability. In order to meet this stipulation, a limited value of width-to-thickness ratio (b/t) is presented in GB standard [16], but the method to estimate the reduction of bearing capacity when b/t exceeds its limited value is not given. While in many foreign standards, the estimations of local stability reduction factor β, are provided in terms of functional expressions of b/t or w/t, where b is the nominal width of steel angle, and w is flat width. Table 4 summarizes β values of various angle sizes as per different standards, the calculated results of DL/T [13] agree with that of ASCE. For test specimens with dimensions of L125×8 and L160×10, the w/t value exceeds the limited values, and the design strength should be modified by reduction factor.
Table 4Comparisons of local buckling reduction factor
Angle size | b / mm | w / mm | t / mm | w/t | Local stability reduction factor | |
βDL | βASCE | |||||
L125×8 | 125 | 103 | 8 | 12.9 | 0.793 | 0.764 |
L140×12 | 140 | 114 | 12 | 9.5 | 1 | 1 |
L160×10 | 160 | 134 | 10 | 13.4 | 0.757 | 0.739 |
4.3. Torsional buckling
Under axial compression, the member with biaxial symmetry section generally fails by flexural buckling. For the specimens with dual-angle cruciform section investigated in this paper, the torsional buckling around longitudinal axis may also happen. The equilibrium differential equation due to the tiny torsion deformation at critical state was then established as follows, based on the assumption that the member ends are simply supported:
The equivalent slenderness ratio of torsional buckling λZ can be calculated as follows:
The parameters of steel angle, such as warping coefficient Iw, sectional area A, torsional inertia moment It, polar radius of gyration i0, and shear modulus G can be expressed:
Applying these variables above into Eq. (7) provides simple expression as follows:
Eq. (8) demonstrates that, the critical equivalent torsional slenderness ratio is only determined by b/t value, and has no correlation with member length. The critical torsional stress can be evaluated by Eq. (9) and (10):
According to Eqs. (5) and (10), it is interesting to find that, the two failure modes of dual-angle compound members, local buckling and torsional buckling, have the same critical stress. In addition, no obvious torsional buckling was found in prototype test of latticed towers with compound leg members. Therefore, in design, since the effect of local buckling is considered, the torsional buckling can be ignored.
4.4. Modified design approach
Prevailing Chinese design standard stipulates that, if the filled plate spacing is less than 40i, the compound member can be calculated as a solid-web member. However, the experimental and finite element analysis results indicate that the failure mode of test members is a mixture of overall flexural buckling and local instability. The core members mainly bend around imaginary axis, and internal forces of different components are asymmetric. All these contradict with the provisions in the standards.
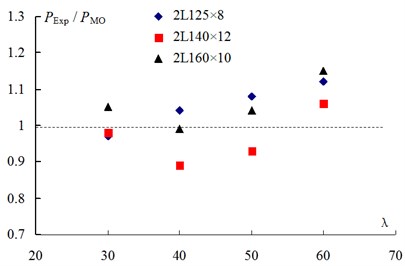
Under axial compression, the design procedure contains two steps, net section strength and overall stability. For the overall stability calculation of the compound member, the design method is provided in DL/T specification, but the prototype tests indicate that it is was not accurate enough. To fit the test data, a modified design approach is established on the basis of current design method. Due to the failure modes of core members, the equivalent slenderness ratio λe, instead of effective slenderness ratio λ,is proposed to be used in the modified approach. The equivalent slenderness λeis defined by Eq. (11), where S is the net spacing between adjacent filled plates, and modified method can be expressed by Eq. (12). Local stability reduction β is applied to the design strength, and overall stability coefficient Φe is calculated due to λe and section classification. Table 5 shows the comparison of the test capacities and the design capacities for the specimens, and the design capacity is based on the material properties obtained from tensile coupon tests. In addition, the ratios of the test capacity to design capacity from Chinese specification (PExp/PDL) and to the capacity of modified approach (PExp/PMO) are plotted against slenderness ratios (λ), as shown in Fig. 9 and Fig. 10:
Table 5The comparison between test capacities and design capacities
Member size | λ | Test PExp / kN | Simulate PFEA / kN | DL/T PDL / kN | Modified PMo / kN | Comparison | ||
PExp/PFEA | PExp/PDL | PExp/PMo | ||||||
2L125×8 | 30 | 1400 | 1521 | 1506 | 1443 | 1.09 | 0.93 | 0.97 |
40 | 1308 | 1446 | 1413 | 1258 | 1.11 | 0.93 | 1.04 | |
50 | 1233 | 1330 | 1299 | 1142 | 1.08 | 0.95 | 1.08 | |
60 | 1200 | 1207 | 1160 | 1071 | 1.01 | 1.03 | 1.12 | |
2L140×12 | 30 | 2464 | 2501 | 2525 | 2514 | 1.02 | 0.98 | 0.98 |
40 | 2257 | 2314 | 2525 | 2536 | 1.03 | 0.89 | 0.89 | |
50 | 2051 | 2170 | 2525 | 2205 | 1.06 | 0.81 | 0.93 | |
60 | 1953 | 1978 | 2289 | 1842 | 1.01 | 0.85 | 1.06 | |
2L160×10 | 30 | 2175 | 2372 | 2259 | 2071 | 1.09 | 0.96 | 1.05 |
40 | 1958 | 2163 | 2127 | 1978 | 1.10 | 0.92 | 0.99 | |
50 | 1799 | 1941 | 1965 | 1730 | 1.08 | 0.92 | 1.04 | |
60 | 1678 | 1792 | 1766 | 1459 | 1.07 | 0.95 | 1.15 | |
Mean value, Pm | 1.06 | 0.93 | 1.03 | |||||
SD value, SP | 0.036 | 0.058 | 0.076 | |||||
The mean value of PExp/PDL is 0.93 with the SD value of 0.058. It means that the design capacity predicted by Chinese specification is not conservative. Meanwhile, the ratio of PExp/PMo is with mean value of 1.03, and SD value of 0.076. It also can be seen in Fig. 10 that the proposed design values based on the equivalent slenderness ratio fit the test data well.
Fig. 9Ratio of test strength to design strength
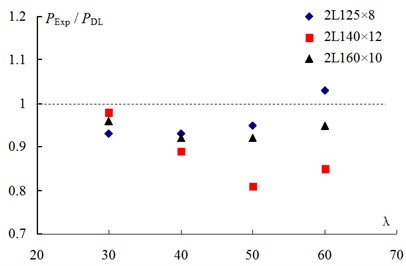
Fig. 10Ratio of test strength to modified strength
5. Conclusions
Based on the dynamic experimental and numerical investigation, the following conclusions can be made:
The failure mode of test specimens is a mixture of overall flexural buckling and local stability. In general, the specimens with slenderness ratios of 30 and 40, fail by local buckling, and overall buckling is no obvious. For those with slenderness ratios of 50 and 60, failure is governed by overall buckling although local buckling also occurred. The core members mainly bend around the imaginary axis, not the minimum axis as predicted.
The internal force distribution of two components is asymmetric, and the value of N1/N2 ranges from 1.04 to 1.31, with the mean value of 1.157 and SD value of 0.09. The similar results are also obtained from prototype tower tests.
As the stimulated results show similar trend with test results, the simplified FE model proposed can be further applied to model the compound members with different sizes.
Due to theoretical results, the two failure modes of dual-angle compound members, local buckling and torsional buckling, have the same critical stresses. Therefore, since the effect of local buckling is considered, the torsional buckling can be ignored in the design process.
The bearing capacity predicted by Chinese standard is proved to be not conservative, on this basis, a modified design approach is proposed and the design capacities fit the test data well.
References
-
Li Z. B., Shi L. Y., Xing H. J. Research on bearing capacity of Q420 dual-angle steel cross combined section. Electric Power Construction, Vol. 30, Issue 9, 2012, p. 9-14.
-
Prasad N., Knight Samuel G. M., Seetharaman S., et al. Failure analysis of transmission line towers. Journal of Performance of Construction Facilities, Vol. 25, 2011, p. 231-240.
-
Prasad N., Knight Samuel G. M., Lakshmanan N., Iyer Nagesh R. Investigation of transmission line tower failures. Engineering Failure Analysis, Vol. 17, 2010, p. 1127-1141.
-
Guo Yong, Shen J. G., Ying J. G. Stability analysis on the multiple angle members of transmission towers. Steel Structure, Vol. 27, Issue 155, 2012, p. 11-16.
-
Yan Zhuge, Mills Julie E., Ma Xiang Modelling of steel lattice tower angle legs for increased load capacity. Engineering Structure, Vol. 43, 2012, p. 160-168.
-
Temple M. C., Sakla S. S. S., Stchyrba D., Ellis D. Arrangement of interconnectors for starred angle compression members. Canadian Journal of Civil Engineering, Vol. 21, 1994, p. 76-80.
-
Ungkurapinan N., et al. Joint slip in steel electric transmission towers. Engineering Structures Vol. 25, 2003, p. 779-788.
-
Fong M., Cho S. H., Chan S. L. Design of angle trusses by codes and second-order analysis with experimental verification. Journal of Constructional Steel Research, Vol. 65, 2009, p. 2140-2147.
-
Ahmed K. I. E., Rajapakse R. K. N. D., Gadala M. S. Influence of bolted-joint slippage on the response of transmission towers subjected to frost-heave. Advances in Structural Engineering, Vol. 12, Issue 1, 2009, p. 1-17.
-
Jiang W. Q., Wang Z. Q., McClure G., Wang G. L., Geng J. D. Accurate modeling of joint effects in lattice transmission towers. Engineering Structures, Vol. 33, 2011, p. 1817-1827.
-
Albermani F., Kitipornchai S. Failure analysis of transmission towers. Engineering Failure Analysis, Vol. 16, Issue 6, 2009, p. 1922-1928.
-
Lee P. S., Mcclure G. Elastoplastic large deformation analysis of a lattice tower structure and comparison with full-scale tests. Journal of Constructional Steel Research, Vol. 63, Issue 5, 2007, p. 709-717.
-
DL/T 5154-2012. Technical Code for the Design of Tower and Pole Structures of Overhead Transmission Line. China Planning Press, Beijing, 2012.
-
BS EN 50341-1. Overhead Electrical Lines Exceeding AC 1 kV. BSI Standards, 2012.
-
ASCE 10-97. Design of Latticed Steel Transmission Structures. International Standards, 2010.
-
GB 50017-2003. Code for Design of Steel Structures. China Planning Press, Beijing, 2003.
Cited by
About this article
The work presented in this paper is supported by Grants from Zhejiang Electric Power Design Institute (No. zdk088-2011)

