Abstract
In engineering applications, the robustness and effectiveness of damage diagnostic imaging for guided wave-based structural health monitoring could be affected by the complexity of structures. In this study, an elliptical ring distribution probability-based diagnostic imaging algorithm is proposed to mitigate this effect using the estimated wave velocity and damage index. This algorithm improves the ability of damage localization by modifying the defect distribution probability of probability-based diagnostic imaging. The elliptical ring distribution probability of the presence of defect is used for each sensing path in the algorithm. The width of the elliptical ring distribution probability is determined by the range of estimated wave velocity. The amplitude of the elliptical ring distribution probability is determined by the damage index. The damage location is determined by the cross region of different elliptical rings for different sensing paths. The capability of the algorithm is validated by identifying damages at different locations on a complex composite fuselage panel. The results show that the proposed algorithm can identify a single damage accurately and it can identify multiple damages effectively as well.
1. Introduction
Due to the superior properties of strength, stiffness, weight and corrosion resistance, the composite materials are increasingly used in aircraft structures. Especially in recent years, some complex composite structures have become widely applied to aircrafts. However, one of the major challenges with composite materials is that these materials suffer invisible damage with different failure modes such as matrix crack and delamination. These damages can decrease the composite structure’s strength significantly, so they must be detected in time. Traditional non-destructive testing (NDT) techniques, although efficient in the damage detection, are time-consuming and expensive to be applied regularly since they require the structure to be off-service, even require component disassembling. The structural health monitoring (SHM) technology offers an alternative means to detect and monitor damages in structures.
Ultrasonic guided waves have particular advantages for the purpose of SHM because they can travel over long distances and are sensitive to many types of damage such as crack, corrosion and delamination et al. [1-8]. Many damage detection algorithms have been developed for guided wave-based SHM. Among these algorithms, damage diagnostic imaging algorithms have attracted much attention because they result in an interpretable and intuitive image to reflect the location of damage. Some representative algorithms are phased array method [9, 10], tomography technique [11-13], delay-and-sum algorithm [14-16], correlation-based imaging technique [17], model-based damage imaging using sparse reconstruction [18, 19] and probability-based diagnostic imaging (PDI) method [20]. For the phased array method, the localization accuracy highly depends on the density of transducers, because it requires a number of transducers to perform as the actuator. For the tomography technique, it requires dense wave paths for imaging reconstruction, which fairly narrows its application for SHM. For the delay-and-sum algorithm, correlation-based imaging technique, and model-based damage imaging using sparse reconstruction, these methods require accurate wave velocity. However, it is quite difficult to interpret the guided wave signals for acquiring the accurate wave velocity because the propagation mechanism of guided wave is quite complicated in engineering structures due to its geometric and structural complexity, such as overlapping structure, variable thickness structure and reinforced structure. Thus, the robustness and effectiveness of these methods could be affected by the complexity of structures.
In contrast, the probability-based diagnostic imaging (PDI) enables damage imaging with a good quality in a sparse sensor network, and does not require direct interpretation of the guided wave signal. Thus, it has been studied intensively by many researchers [21]. Zhao et al. [22] introduced a correlation analysis-based PDI algorithm called as the reconstruction algorithm for probabilistic inspection of defects (RAPID) which used the signal difference coefficients of sensor pairs to reconstruct the defect distribution probability map. The algorithm showed good performance in estimating the location of cracks or corrosion and monitoring its growth in a metallic skin panel of an aircraft wing. Koduru and Rose [23] improved the PDI algorithm by using designed annular array sensors for mode controlling. It showed a remarkable improvement in the ability to distinguish a real corrosion defect from any other water traces on the structure. Wang et al. [24, 25] studied the PDI algorithm for the identification of multiple notches using digital damage fingerprints (DDFs) which were used to highlight the changes in signals corresponding to the presence of damage. They also developed a correlation analysis based-PDI algorithm with a concept of virtual sensing paths (VSPs) which was proposed to enhance the performance of the algorithm by increasing the number of sensing paths in data fusion. Wu et al. [26] studied the influences of multiple factors of PDI algorithm on the damage identification, and developed a methodology to determine the parameters for the PDI algorithm. Hua et al. [27] developed a local signal difference coefficient (LSDC) based-PDI algorithm to improve the imaging performance. Liu et al. [28] developed a weight-compensated probability-based diagnostic imaging (WCPDI) to weaken the influence of the dominance effect of the weight distribution for improving the ability of damage localization.
In the aforementioned researches on the PDI algorithm, the damage imaging is based on the relatively inaccurate defect distribution probability, which is linearly decreasing elliptical distribution. In these studies, for the defect distribution probability of an actuator-sensor pair, the probability of the presence of defect is larger as the imaging grid is closer to the direct path of the actuator-sensor pair. Furthermore, the probability is maximum in the direct path of the actuator-sensor pair, no matter where the actual damage is located. According to the common sense, the probability of the presence of defect is larger as the grid closer to the actual damage. Thus, this relatively inaccurate defect distribution probability does not conform to the fact. It could reduce the damage localization accuracy. This can affect the application of the PDI algorithm in real-world practices. In order to improve the damage localization accuracy of PDI algorithm, more spatial damage information provided by the actuator-sensor paths can be used. For complex structures, the spatial damage information is often difficult to be obtained accurately because the propagation mechanism of guided wave is quite complicated in these structures. In this study, a strategy is established to solve the above-mentioned problems.
In order to improve the damage localization accuracy of PDI algorithm for complex structures, modifying the defect distribution probability is an important way. In this study, an elliptical ring distribution probability-based diagnostic imaging (ERDPDI) algorithm is developed to improve the ability of damage localization for complex structures by modifying the defect distribution probability of PDI algorithm. In the ERDPDI algorithm, the probability of the presence of defect is an elliptical ring distribution for each sensing path. For aircraft structures, the composite fuselage panel is an important and complex structure. Due to the material anisotropy and existence of fuselage frame and stiffener, propagation mechanism of guided waves is quite complicated in the composite fuselage panel. It is difficult to identify damage on the composite fuselage panel. Therefore, in this study, the capability of the proposed algorithm is validated by identifying damages at different locations on a complex composite fuselage panel.
The remainder of this paper is organized as follows. Section 2 describes the proposed ERDPDI algorithm based on the brief review of PDI algorithm. Numerical simulations study on ERDPDI algorithm is presented in Section 3. Then the experimental validation for ERDPDI algorithm is presented in Section 4. In order to show the advantage of ERDPDI algorithm, the performance of ERDPDI algorithm is compared with the performance of PDI algorithm in this experimental validation. Finally, conclusions are presented in Section 5.
2. Damage diagnostic imaging algorithm
2.1. Brief review of PDI approach
When ultrasonic guided waves travel through a structure, the damage of structure can lead to the scattering of the guided waves. By comparing the guided wave signals before and after damage occurred, the damage information of the structure can be obtained. Guided wave-based SHM utilizes this principle to monitor the damage of structure. It uses the distributed actuator/sensors, which are permanently attached to the structure, to generate the guided wave and measure the arriving waves at sensors. The damage diagnosis is performed through the examination of the arriving waves in comparison with a ‘baseline’ condition. Many damage diagnosis algorithms have been developed for guided wave-based SHM. The PDI algorithm is one of the representative algorithms.
In the PDI algorithm, the monitoring area is meshed into uniformly distributed grids. A grid, which denotes a region at given position in the monitoring area, is an image point. The probability of the presence of damage at each grid is estimated by summing the signal difference features in elliptical patterns for various pitch-catch transducer pairs. Assuming that there are N sensing paths in total involved for damage imaging, the estimation of the probability of the presence of damage at a certain grid (x,y) can be calculated as:
where SDCi is the correlation analysis-based damage signature for the ith sensing path, which can be represented by:
where ρbi,ci is the correlation coefficient for the ith sensing path, Cbici is the covariance of signal bi and signal ci of the ith sensing path, σbi and σci are the standard deviations of bi and ci.
Wi[Ri(x,y)] is the weight distribution function of the ith sensing path. It is dependent on the parameter, Ri(x,y), which is defined as the relative distance from grid (x,y) to the ith sensing path:
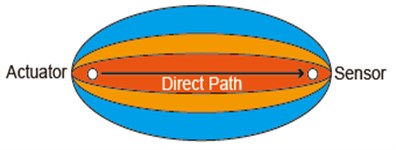
where Di is the distance between the actuator and the sensor for the ith sensing path, Da,i(x,y) and Ds,i(x,y) are the distances between grid (x,y) and the actuator and sensor for the ith sensing path, respectively. The Wi[Ri(x,y)] is assumed to be linearly decreasing elliptical distribution as shown in Fig. 1. The size of the effective elliptical distribution area is controlled by a scaling parameter β. The weight distribution function can be expressed as:
It has been shown that the damage localization result of the PDI algorithm is highly dependent on the weight distribution. According to the above, the weight increases with a decrease in the relative distance, indicating that the grid closer to the sensing path has larger probability of the presence of defect. The probability of the presence of defect is maximum in the direct path of the actuator-sensor pair, no matter where the actual damage is located. This is a relatively inaccurate defect distribution probability. According to the common sense, the probability of the presence of defect is larger as the grid closer to the actual damage. Thus, the weight distribution in the PDI algorithm can reduce the damage localization accuracy.
Fig. 1Elliptical distribution function of probability of presence of defect for PDI algorithm
2.2. ERDPDI approach
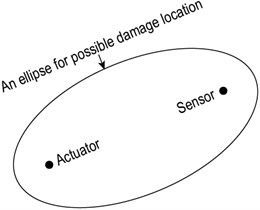
Due to the relatively inaccurate defect distribution probability of PDI algorithm, the ERDPDI algorithm improves the accuracy of defect distribution probability of PDI algorithm using more spatial damage information. For an actuator-sensor pair, the actual damage location cannot be determined, but the possible damage location can be acquired. Using the guided wave group velocity and time of flight (TOF) of scattered wave caused by damage, the possible damage location is an ellipse with actuator and sensor as two foci, as show in Fig. 2. In engineering structures, due to geometric and structural complexity such as material anisotropy, variable thickness structure and reinforced structure, the guided wave group velocity usually cannot be calculated accurately. Therefore, for an actuator-sensor pair, the position of ellipse for the possible damage location cannot be determined accurately. Thus, the region of the position of ellipse for the possible damage location is considered. In order to determine the region, the range of estimated guided wave velocity is used. It supposes that the range of estimated guided wave velocity is [c1,c2]. The region of the possible damage location for the ith sensing path is determined as:
where RDi is the region of the possible damage location for the ith sensing path, D1i is the nearest estimated possible damage location for the ith sensing path, which is calculated by:
where c1 is the lower limit of estimated guided wave velocity, ti is the TOF of scattered guided wave caused by damage for ith sensing path. D2i is the farthest estimated possible damage location for the ith sensing path, which is calculated by:
where c2 is the upper limit of estimated guided wave velocity. For anisotropic material structures, the c1 and c2 can be determined by the minimum guided wave velocity and maximum guided wave velocity of structure along different directions. For isotropic material structures, a method for determination of c1 and c2 is proposed as:
where ct is the theoretical value of guided wave velocity, Le is the allowable damage location error, ds is the maximum distance between arbitrary two transducers in transducers network.
Fig. 2Illustration of possible damage location for an actuator-sensor pair
In the above calculation of the region of the possible damage location, the TOF estimation is an important issue. To tackle this issue, a variety of methods have been developed. Representative methods include continuous wavelet transform (CWT), Wigner-Ville distribution (WVD), Hilbert-Huang transform (HHT), short-time Fourier transform (STFT), matching pursuit decomposition (MPD), and Hilbert transform [29-32]. In this study, the Hilbert transform was used to estimate the TOF by extracting the time of the maximum of the envelope of the concerned guided wave signal. The envelope of the guided wave signal is calculated as:
where sd(t) is the guided wave signal, ˆsd(t) is the Hilbert transform of sd(t), A(t) is the envelope of sd(t).
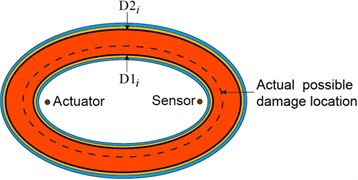
When the region of the possible damage location for the ith sensing path is acquired, the weight distribution function WDi[DPi(x,y)] of the ith sensing path for grids of monitoring area can be determined. In the ERDPDI algorithm, the weight distribution function WDi[DPi(x,y)] is an elliptical ring for the ith sensing path, as shown in Fig. 3. The probability of the presence of defect is maximum in the region of the possible damage location for the ith sensing path, which is the region between D1i and D2i as shown in Fig. 3. When the grid departs from the region between D1i and D2i, the weight decreases quickly. The WDi[DPi(x,y)] is expressed as:
where DPi(x,y) is the propagation distance of scattered guided wave caused by the possible damage at grid (x,y) for the ith sensing path, which is written as:
Fig. 3Elliptical ring distribution function of probability of presence of defect for ERDPDI algorithm
For above mentioned weight distribution function, the probability of the presence of defect in region of the possible damage location for all sensing paths is the same. This obviously does not accord with the fact. Thus, the probability of the presence of defect in the region of the possible damage location for each sensing path must be modified. For a damage, it usually has different effects on a different sensing path. Thus, this fact can be used to improve the probability of the presence of defect for each sensing path. Usually, the damage index is used to evaluate the effect of damage on the guided wave signal for a sensing path. Thus, the damage index is used as weight to modify the probability of the presence of defect for a sensing path. For the ith sensing path, the probability of the presence of defect at grid (x,y) is expressed as:
where DIi is the damage index for the ith sensing path.
Finally, the probability of the presence of defect at grid (x,y) can be acquired by fusion of all sensing paths. It is expressed as:
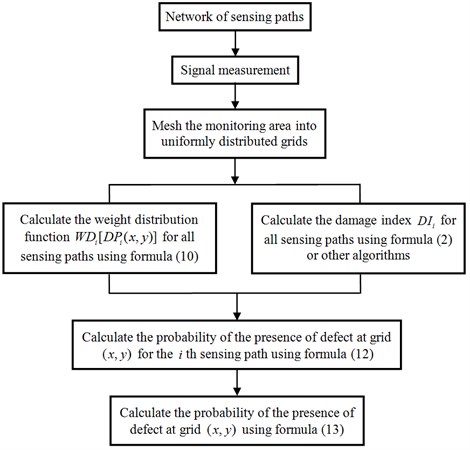
The flowchart of the ERDPDI algorithm is shown in Fig. 4.
Fig. 4ERDPDI algorithm flowchart
3. Numerical simulations study on ERDPDI algorithm
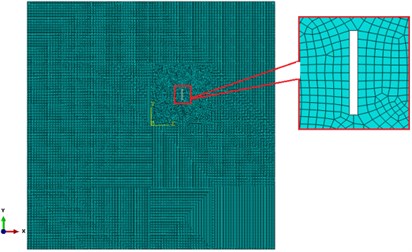
In this section, the principle of ERDPDI algorithm was studied by the numerical simulation. Due to the principle study, the verification of ERDPDI algorithm was carried on an aluminum plate which was a simple structure. Numerical simulation has been carried out using commercial finite element method (FEM) software ABAQUS. The size of the aluminum plate model is 200×200×2 mm. The material properties of the plate are Young’s modulus E=70 GPa, Poisson’s ratio ν=0.33 and density ρ=2700 kg/m-3. Four positions were selected for actuating and receiving the guided waves. When one position was used for actuating, the others were used for receiving. Each position was used as actuator for once. In order to describe the selected four positions, a coordinate system was employed with the plate. The origin of coordinate was the center of the plate. The dimensions of plate, the four positions and coordinate system are shown in Fig. 5. The coordinates of four positions are listed in Table 1. The excitation pulse, which was along the normal direction of plate, was loaded on the node at the one of selected four positions. The displacements along the normal direction of plate for nodes at the other selected positions, were used as received guided wave. The excitation pulse was a five-cycle tone burst modulated by a Hanning window. The central frequency of excitation was 90 kHz. The time span of excitation pulse was 2×10⁻⁴ s. An Explicit dynamic step was created for the simulation. The element used for modeling is S4 which is a 4-node shell element. Through the convergence analysis, the time step was set to be 0.02 μs and element size was set to be 0.4 mm. Attenuation was not considered in numerical modeling. After the simulation of baseline signals, a notch was modeled in the plate model, which size was 1×10×2 mm, as shown in Fig. 6. The coordinate of the notch center was (25, 25).
Table 1The coordinates of four positions used for actuating and receiving the guided waves
Number | Coordinate (mm) | Number | Coordinate (mm) |
1 | (–50, –50) | 3 | (50, 50) |
2 | (50, –50) | 4 | (–50, 50) |
Fig. 5Schematic of the aluminium plate model and coordinate system
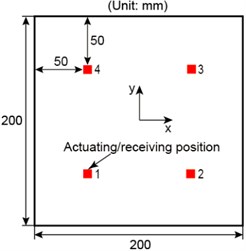
Fig. 6Notch modeled in the aluminum plate model
After the baseline signals and current signals acquired, the ERDPDI algorithm was studied. Before the damage imaging, the values of c1 and c2 in the ERDPDI algorithm must be determined. Due to the isotropic material of plate, actuator-sensor path 1-4 was arbitrarily selected to calculate the wave group velocity. In the group velocity calculation, the TOF calculation is shown in Fig. 7. Due to small displacements for receiving positions, in Fig. 7, the signal amplitude is the ratio of the actual signal amplitude to the maximum of baseline signal amplitude. As attenuation was not considered in numerical modeling, using the Hilbert transform, the TOF was calculated by extracting the time of the maximum of the envelope of the first wave packet for the response signal. The TOF calculation of scattered signal was the same. As an example, the TOF calculation of scattered signal for actuator-sensor path 1-4 is also shown in Fig. 7. Through calculation, the wave group velocity is 1995 m/s. The maximum distance between arbitrary two transducers ds in the model is 100√2 mm. If the allowable damage location error Le is assumed to be 5 mm, using Eq. (8), c1 and c2 in the ERDPDI algorithm are calculated as 1925 m/s and 2066 m/s, respectively.
Fig. 7Simulation signals and TOF calculation for actuator-sensor path 1-4
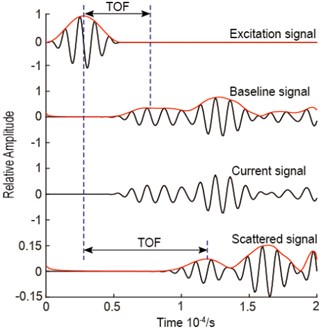
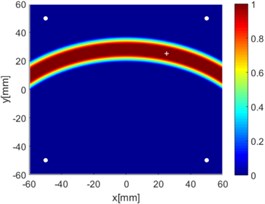
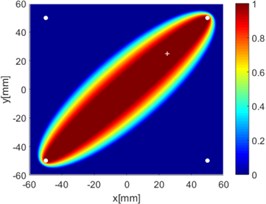
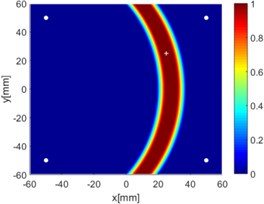
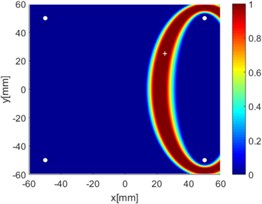
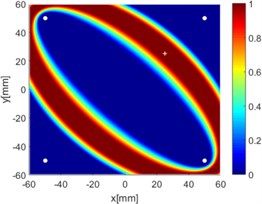
Fig. 8Diagnostic images of ERDPDI algorithm for notch using actuator-sensor path
a) 1-2
b) 1-3
c) 1-4
d) 2-3
e) 2-4
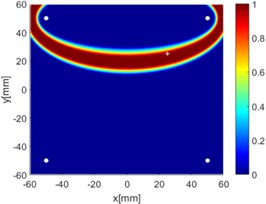
f) 3-4
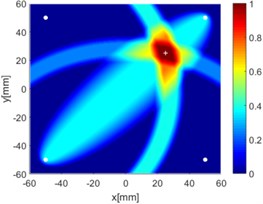
g) 1-2, 1-3 and 1-4
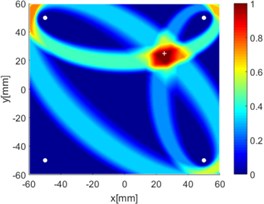
h) 2-3, 2-4 and 3-4
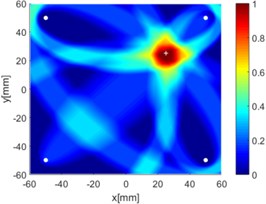
i) All six paths
Due to reciprocity, there were totally 6 sensing paths for damage imaging in this simulation. For the ith sensing path, the DIi used in ERDPDI algorithm was the correlation analysis-based damage signature, SDCi. Fig. 8 shows the probability images of ERDPDI algorithm for notch identification in the numerical simulation using different actuator-sensor paths. The white circle dots denote the four positions selected for actuating and receiving the guided waves. The center location of the notch is marked by the white cross. The grid with the highest probability value in the image denotes the location of identified damage. The images have the dimensions of 60×60 mm2, that is, 60×60 uniformly distributed grids with an interspatial distance of 1 mm. Fig. 8(a)-(f) show the diagnostic images of ERDPDI algorithm using one actuator-sensor path. As shown in Fig. 8(a)-(f), if damage location is not on an actuator-sensor path, the probability of the presence of defect is an elliptical ring. Otherwise, as the TOF of scattered signal is so small, the elliptical ring distribution probability of defect changes to elliptical distribution, as shown in Fig. 8(b). According to the principle of ERDPDI algorithm, three actuator-sensor paths can identify a damage. For example, three actuator-sensor paths were arbitrarily selected to identify notch, as shown in Fig. 8(g) and (h). The notch can be accurately identified by three actuator-sensor paths. However, in engineering applications, as the number of damages is usually not known before the damage monitoring, all actuator-sensor paths are used to identify damage for the ERDPDI algorithm. Fig. 8(i) shows the diagnostic image of ERDPDI algorithm using all actuator-sensor paths. As shown in Fig. 8(i), the ERDPDI algorithm can identify damage accurately.
4. Experimental validation
4.1. Specimen and experimental setup
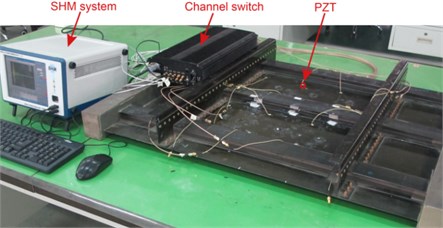
The composite fuselage panel is a representative and important aircraft structure. In recent years, this kind of composite structure has been widely applied to aircrafts. Thus, the need for damage monitoring of this kind of composite structure is also urgent. However, due to geometric and structural complexity, it is difficult to identify damage in the composite fuselage panel. Thus, experiments were carried on a complex carbon fiber composite fuselage panel to validate the performance of ERDPDI algorithm in this study. The panel has three I-shaped stiffeners and two fuselage frames. The material of panel is T700/BA9916. Sixteen lead zirconate titanate (PZT) sensors (P51) were bonded on the panel with GLEIHOW302 adhesive. The dimensions of PZT sensors are 8 mm in diameter and 0.45 mm in thickness. The dimensions of panel and PZT sensors placement are shown in Fig. 9. An integrated SHM system was used to generate and acquire the guided waves in the experiment. The experimental setup is shown in Fig. 10.
The excitation signal was a five-cycle tone burst modulated by a Hanning window. The sampling rate for sensor data acquiring was set at 10 MHz. According to the characteristics of guide wave signals tested on the panel for excitation signal center frequencies range from 50 to 150 kHz with an interval of 20 kHz, the excitation signal center frequency for this experimental validation was selected as 90 kHz.
Fig. 9Schematic of panel and PZT sensors placement
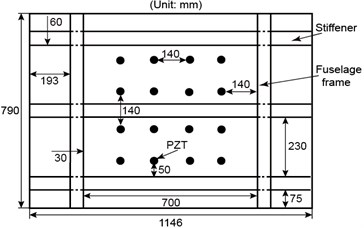
Fig. 10Experimental setup
As the ERDPDI algorithm was developed by modifying the defect distribution probability of PDI algorithm, the performance of ERDPDI algorithm is compared with the performance of PDI algorithm in this experimental validation. Wu et al. [26] studied the influence of two different networks of sensing paths on PDI algorithm. The result shows that group CIR (enclose a circle monitoring area) has a better performance than group SQU (enclose a square monitoring area) for the PDI algorithm. In order to make the PDI algorithm have a good performance, this experimental validation used CIR network for damage identification. Eight PZT sensors were selected for CIR network in this experimental validation. In order to describe the location of the PZT sensors, a coordinate system was employed with the plane of the monitoring area spanned by the horizontal, x, and vertical, y, axes. The selected PZTs for CIR network and the coordinate system are shown in Fig. 11. The red circle dots denote the selected PZTs. The coordinates of selected PZTs are listed in Table 2. Due to reciprocity, there were totally 28 sensing paths in CIR for damage imaging.
Table 2Locations of PZTs for CIR network
PZTs number | Coordinate (mm) | PZTs number | Coordinate (mm) |
1 | (150, 10) | 5 | (290, 430) |
2 | (290, 10) | 6 | (150, 430) |
3 | (430, 150) | 7 | (10, 290) |
4 | (430, 290) | 8 | (10, 150) |
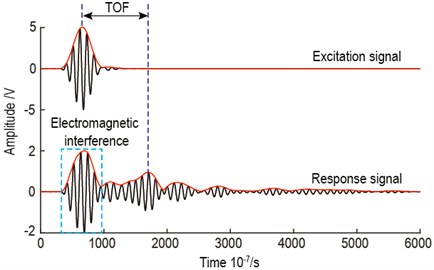
Before the start of damage identification validation, the values of c1 and c2 in the ERDPDI algorithm must be determined. Under the 90 kHz excitation center frequency, the A0 mode amplitude is dominant. Thus, in this experimental validation, the A0 mode was used to damage identification. Using positive x axis as 0° direction and positive y axis as 90° direction, the calculated A0 mode group velocity along different directions is shown in Fig. 12. The actuator-sensor paths for calculating the A0 mode group velocity along different directions are listed in Table 3. In the group velocity calculation, the TOF determination of A0 mode is important. As an example, the TOF calculation for actuator-sensor path 3-4 is shown in Fig. 13. The Hilbert transform was used to estimate the TOF by extracting the time of the maximum of the envelope of the response signal for actuator-sensor path 3-4. In Fig. 12, the A0 mode group velocity anisotropy is observed clearly. According to the minimum and maximum group velocity along different directions, c1 and c2 in this experimental validation for the ERDPDI algorithm are 1251 m/s and 1516 m/s, respectively.
Fig. 11Schematic of selected PZTs for CIR network and coordinate system
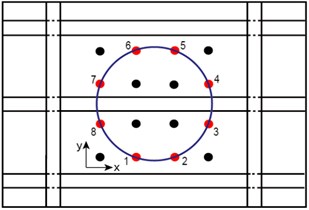
Fig. 12A0 mode group velocity along different directions
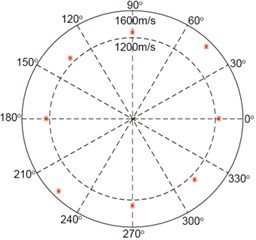
Table 3Actuator-sensor paths for calculating A0 mode group velocity
Direction | Actuator-sensor path | Direction | Actuator-sensor path |
0° | 1-2 | 180° | 5-6 |
45° | 1-4 | 225° | 5-8 |
90° | 3-4 | 270° | 7-8 |
135° | 3-6 | 315° | 7-2 |
To reduce the experiment cost, artificial damages were introduced with M16 bolts (16 mm in diameter) bonded on the surface of the panel in this study. The diameter of the bolt was approximately equal to the maximum wavelength of A0 mode along different directions. Just as the effect of damages to the structure, the geometry continuum is interrupted by the bolt. The procedure of each damage identification validation case is as follows:
(a) Baseline signals were collected before the artificial damage was introduced.
(b) The artificial damage was introduced with bolts bonded on the surface of the panel.
(c) Current signals were collected after the artificial damage had been introduced.
(d) The damage image was reconstructed.
Fig. 13TOF calculation for actuator-sensor path 3-4
4.2. Results and discussion
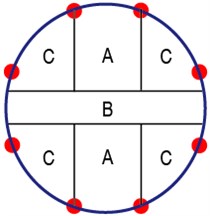
In order to make the damage identification validation representative, according to the structure symmetry, the monitoring area of the composite fuselage panel was divided into three types of small areas, as shown in Fig. 14. Area A denotes the area which has no stiffener and is far away from the fuselage frame. Area B denotes the area with stiffener. Area C denotes the area which has no stiffener and is close to the fuselage frame. The damage identification must be verified in the three types of small areas.
Fig. 14Type division of monitoring area
To validate the performance of single damage identification using ERDPDI algorithm, several single artificial damage cases were introduced on the composite fuselage panel at different locations. After the measurement of the guided wave signals, the damage images were reconstructed. In the damage imaging, the scattered signal was the difference between the current signal and baseline signal. The TOF of the scattered signal was estimated by the Hilbert transform, which was used to estimate TOF by extracting the time of the maximum of the envelope of the scattered signal caused by damage. As an example, Fig. 15 shows the signals and TOF estimation of the scattered signal from actuator-sensor path 5-6, when a single artificial damage is near actuator-sensor path 5-6. The DIi used in ERDPDI algorithm was the correlation analysis-based damage signature, SDCi, for the ith sensing path, which was the same with PDI algorithm. The scaling parameter β used in PDI algorithm was determined by testing, which changed β from 0.1 to 1.2 by the step of 0.1. The selected scaling parameter β was 0.7.
Fig. 15Signals and TOF estimation of scattered signal from actuator-sensor path 5-6
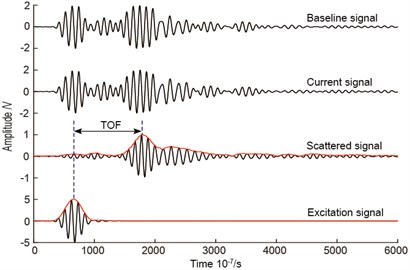
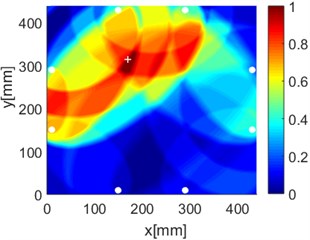
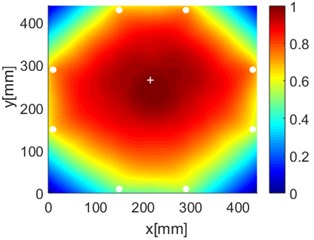
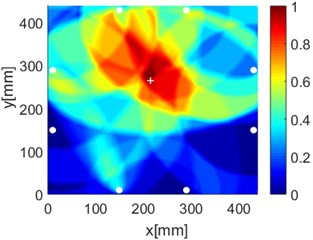
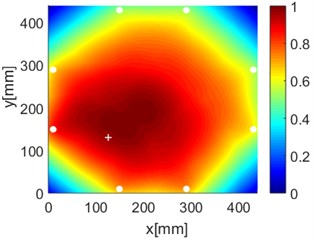
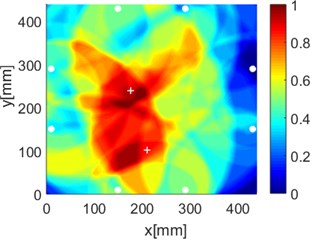
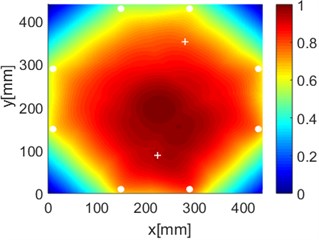
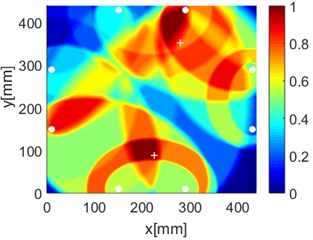
Fig. 16Diagnostic images of PDI algorithm with β= 0.7 and ERDPDI algorithm for single damage
a) PDI
b) ERDPDI
c) PDI
d) ERDPDI
e) PDI
f) ERDPDI
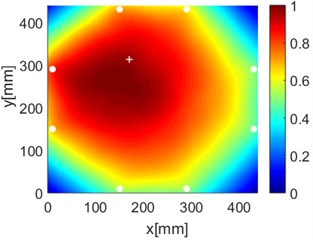
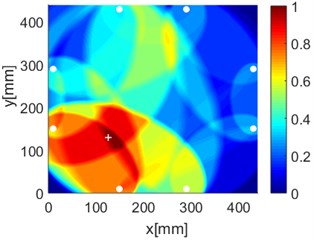
As an example of the damage image, Fig. 16 shows the probability images of PDI algorithm and ERDPDI algorithm for single damage identification in the area A, B and C. The white circle dots denote the positions of PZTs. The center location of the artificial damage is the actual damage location which is marked by white cross. The grid with the highest probability value in the image denotes the location of identified damage. The images have the dimensions of 440×440 mm2, that is, 440×440 uniformly distributed grids with an interspatial distance of 1 mm. Fig. 16(a) and (b) show the damage identification for damage located at (170, 314) in area A. Fig. 16(c) and (d) show the damage identification for damage located at (215, 253) in area B. Fig. 16(e) and (f) show the damage identification for damage located at (125, 130) in area C. As shown in Fig. 16, the damage localization accuracy of the ERDPDI algorithm is better than that of the PDI algorithm. The indicated damage areas of both the algorithms are larger than the artificial damage, but the indicated damage area of the PDI algorithm is larger than that of the ERDPDI algorithm. The diagnostic damage locations of the PDI algorithm are tending to the center of the monitoring area. The ERDPDI algorithm does not have this diagnostic damage location trend.
Fig. 17Diagnostic images of PDI algorithm with β= 0.7 and ERDPDI algorithm for two damages
a) PDI
b) ERDPDI
c) PDI
d) ERDPDI
e) PDI
f) ERDPDI
All the damage localization results of single artificial damage are listed in Table 4. The point with the pixel peak value of the diagnostic images is regarded as the damage location. The error in table is defined as the distance between the peak point of the individual image and actual location of damage. As shown in Table 4, the PDI localization error is generally greater than the ERDPDI localization error.
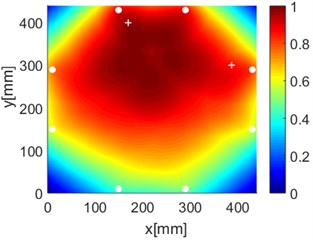
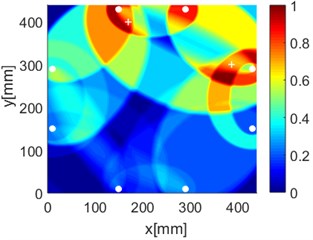
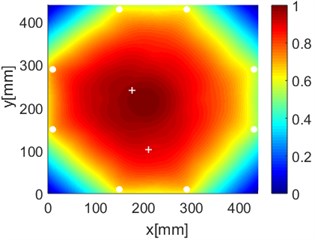
By performing the aforementioned experiments, the accurate identification of single damage using ERDPDI algorithm is achieved. In order to validate the performance of multiple damage identification using ERDPDI algorithm, two artificial damages were simultaneously introduced on the composite fuselage panel. Fig. 17 shows the probability images of PDI algorithm and ERDPDI algorithm for two-damages identification. Fig. 17(a) and (b) show the damage identification for damages located at (170, 399) and (387, 300). Fig. 17(c) and (d) show the damage identification for damages located at (176, 240) and (210, 102). Fig. 17(e) and (f) show the damage identification for damages located at (225, 88) and (280, 352). As shown in Fig. 17, PDI algorithm cannot effectively identify two damages in this experiment. The indicated damage area of PDI algorithm is a simply connected region which cannot indicate the number of damage. The ERDPDI algorithm can effectively identify two damages. The two damages can be clearly distinguished in the probability images of the ERDPDI algorithm. Fig. 17(b) and (f) show that some artifacts appear when damage is near PZTs. This is because the elliptical rings for distribution probability of the presence of the damage become smaller when damage is near PZTs. When the elliptical rings become smaller, the number of cross regions of different elliptical rings for sensing paths with one same PZT may increase. Therefore, the increased cross regions may produce the artifacts.
The damage localization results of two artificial damages are listed in Table 5. As two damages cannot be identified effectively by the PDI algorithm, Table 5 only lists the damage localization results of the ERDPDI algorithm. By comparing the results of Table 5 with Table 4, it can be seen that the damage localization error of two damages is greater than the damage localization error of a single damage for the ERDPDI algorithm. This is because the superposition effect of two damages on the scattered signal.
Table 4Damage localization results of single artificial damage (units: mm)
Damages | Actual location | PDI localization | Error | ERDPDI localization | Error |
1 | (170, 314) | (145, 275) | 46.32 | (172, 310) | 4.47 |
2 | (215, 253) | (221, 244) | 10.82 | (214, 260) | 7.07 |
3 | (125, 130) | (167, 172) | 59.40 | (135, 130) | 10.00 |
4 | (275, 400) | (241, 370) | 45.34 | (280, 393) | 8.60 |
5 | (378, 186) | (368, 177) | 13.45 | (365, 190) | 13.60 |
Table 5Damage localization results of two artificial damages (units: mm)
Damages | Actual location | ERDPDI localization | Error |
1 | (170, 399) | (155, 400) | 15.03 |
(387, 300) | (372, 275) | 29.15 | |
2 | (176, 240) | (187, 228) | 16.28 |
(210, 102) | (177, 96) | 33.54 | |
3 | (225, 88) | (210, 102) | 20.52 |
(280, 352) | (268, 397) | 46.57 |
5. Conclusions
This study developed an ERDPDI algorithm to mitigate the effect of structures complexity on damage imaging using estimated wave velocity and damage index. The algorithm improves the ability of damage localization by modifying the defect distribution probability of PDI algorithm. In the ERDPDI algorithm, the probability of the presence of defect is an elliptical ring distribution for each sensing path. The width of the elliptical ring distribution probability is determined by the range of estimated wave velocity. The amplitude of the elliptical ring distribution probability is determined by the damage index. The effectiveness of the algorithm was assessed by identifying artificial damages on a complex composite fuselage panel. The results show that the damage localization accuracy of ERDPDI algorithm is better than that of PDI algorithm. The proposed algorithm can identify single damage accurately and it can identify multiple damages effectively as well. The proposed algorithm showed great potential for damage identification for SHM of complex aircraft structures.
References
-
Ihn J. B., Chang F. K. Detection and monitoring of hidden fatigue crack growth using a built-in piezoelectric sensor/actuator network: I. Diagnostics. Smart Materials and Structures, Vol. 13, Issue 3, 2004, p. 609-620.
-
Purekar A. S., Pines D. J. Damage detection in thin composite laminates using piezoelectric phased sensor arrays and guided Lamb wave interrogation. Journal of Intelligent Material Systems and Structures, Vol. 21, Issue 10, 2010, p. 995-1010.
-
Qiu L., Yuan S. F., Zhang X. Y., et al. A time reversal focusing based impact imaging method and its evaluation on complex composite structures. Smart Materials and Structures, Vol. 20, 10, p. 2011-105014.
-
Ramadas C., Balasubramaniam K., Joshi M., et al. Sizing of interface delamination in a composite T-joint using time-of-flight of Lamb waves. Journal of Intelligent Material Systems and Structures, Vol. 22, Issue 8, 2011, p. 757-768.
-
Yu L. Y., Giurgiutiu V., Wang J. J., et al. Corrosion detection with piezoelectric wafer active sensors using pitch-catch waves and cross-time- frequency analysis. Structural Health Monitoring, Vol. 11, Issue 1, 2012, p. 83-93.
-
Ng C. T., Veidt M. Scattering characteristics of Lamb waves from debondings at structural features in composite laminates. The Journal of the Acoustical Society of America, Vol. 132, Issue 1, 2012, p. 115-123.
-
Qiu L., Liu M. L., Qing X. L., et al. A quantitative multidamage monitoring method for large-scale complex composite. Structural Health Monitoring, Vol. 12, Issue 3, 2013, p. 83-196.
-
Clough A. R., Edwards R. S. Characterisation of hidden defects using the near-field ultrasonic enhancement of Lamb waves. Ultrasonics, Vol. 59, 2015, p. 64-71.
-
Malinowski P., Wandowski T., Trendafilova I., et al. A phased array-based method for damage detection and localization in thin plates. Structural Health Monitoring, Vol. 8, Issue 1, 2009, p. 5-15.
-
Sun Y. J., Ji S. Analysis, realization and experiment of Lamb wave phased arrays for damage detection and imaging in carbon composite structures. Journal of Vibroengineering, Vol. 17, Issue 1, 2015, p. 188-202.
-
Malyarenko E. V., Hinders M. K. Ultrasonic Lamb wave diffraction tomography. Ultrasonics, Vol. 39, Issue 4, 2001, p. 269-281.
-
Prasad S. M., Balasubramaniam K., Krishnamurthy C. V. Structural health monitoring of composite structures using Lamb wave tomography. Smart Materials and Structures, Vol. 13, Issue 5, 2004, p. 73-79.
-
Zhao X., Royer R., Owens E., et al. Ultrasonic Lamb wave tomography in structural health monitoring. Smart Materials and Structures, Vol. 20, Issue 10, 2011, p. 105002.
-
Wang C. H., Rose J. T., Chang F. K. A synthetic time reversal imaging method for structural health monitoring. Smart Materials and Structures, Vol. 13, Issue 2, 2004, p. 415-423.
-
Michaels J. E. Detection, localization and characterization of damage in plates with an in situ array of spatially distributed ultrasonic sensors. Smart Materials and Structures, Vol. 17, Issue 3, 2008, p. 035035.
-
Sharif-Khodaei Z., Aliabadi M. H. Assessment of delay-and-sum algorithms for damage detection in aluminium and composite plates. Smart Materials and Structures, Vol. 23, Issue 7, 2014, p. 075007.
-
Quaegebeur N., Ostiguy P. C., Masson P. Correlation-based imaging technique for fatigue monitoring of riveted lap-joint structure. Smart Materials and Structures, Vol. 23, Issue 5, 2014, p. 055007.
-
Levine R. M., Michaels J. E. Model-based imaging of damage with Lamb waves via sparse reconstruction. The Journal of the Acoustical Society of America, Vol. 133, Issue 3, 2013, p. 1525-1534.
-
Levine R. M., Michaels J. E. Block-sparse reconstruction and imaging for Lamb wave structural health monitoring. IEEE Transactions on Ultrasonics, Ferroelectrics, and Frequency Control, Vol. 61, Issue 6, 2014, p. 1006-1015.
-
Wang D., Ye L., Lu Y., et al. Probability of the presence of damage estimated from an active sensor network in a composite panel of multiple stiffeners. Composites Science and Technology, Vol. 69, Issue 13, 2009, p. 2054-2063.
-
Wang D., Ye L., Lu Y., et al. A damage diagnostic imaging algorithm based on the quantitative comparison of Lamb wave signals. Smart Materials and Structures, Vol. 19, Issue 6, 2010, p. 065008.
-
Zhao X. L., Gao H. D., Zhang G. F., et al. Active health monitoring of an aircraft wing with embedded piezoelectric sensor/actuator network: I – defect detection, localization and growth monitoring. Smart Materials and Structures, Vol. 16, Issue 4, 2007, p. 1208-1217.
-
Koduru J. P., Rose J. L. Guided Wave Annular Array Sensor Design for Improved Tomographic Imaging. Review of Progress in Quantitative Nondestructive Evaluation, AIP Publishing, Chicago, Vol. 28, 2009, p. 658-665.
-
Wang D., Ye L., Lu Y. A probabilistic diagnostic algorithm for identification of multiple notches using digital damage fingerprints (DDFs). Journal of Intelligent Material Systems and Structures, Vol. 20, Issue 12, 2009, p. 1439-1450.
-
Wang D., Ye L., Su Z. Q., et al. Probabilistic damage identification based on correlation analysis using guided wave signals in aluminum plates. Structural Health Monitoring, Vol. 9, Issue 2, 2010, p. 133-144.
-
Wu Z. J., Liu K. H., Wang Y. S., et al. Validation and evaluation of damage identification using probability-based diagnostic imaging on a stiffened composite panel. Journal of Intelligent Material Systems and Structures, Vol. 26, Issue 16, 2015, p. 2181-2195.
-
Hua J. D., Lin J., Zeng L. High-resolution damage detection based on local signal difference coefficient model. Structural Health Monitoring, Vol. 14, Issue 1, 2015, p. 20-34.
-
Liu K. H., Ma S. Y., Wu Z. J., et al. A novel probability-based diagnostic imaging with weight compensation for damage localization using guided waves. Structural Health Monitoring, Vol. 14, Issue 1, 2016, p. 20-34.
-
Jeong H., Jang Y. S. Wavelet analysis of plate wave propagation in composite laminates. Composite Structures, Vol. 49, Issue 4, 2000, p. 443-450.
-
Niethammer M., Jacobs L. J., Qu J. M., et al. Time-frequency representations of Lamb waves. Journal of the Acoustical Society of America, Vol. 109, Issue 5, 2001, p. 1841-1847.
-
Raghavan A., Cesnik C. E. S. Guided-wave signal processing using Chirplet matching pursuits and mode correlation for structural health monitoring. Smart Materials and Structures, Vol. 16, Issue 2, 2007, p. 355-366.
-
Tua P. S., Quek S. T., Wang Q. Detection of cracks in plates using piezo-actuated Lamb waves. Smart Materials and Structures, Vol. 13, Issue 4, 2004, p. 643-660.
Cited by
About this article
This work was supported by the Aeronautical Science Foundation of China (20090923002).

