Abstract
Viscoelastic (VE) dampers can be efficiently used for improving the seismic behavior of structures and also retrofitting of existing structures. Efficient nonlinear dynamic analysis methods like the Incremental Dynamic Analysis (IDA), especially the one which is based on Modal Pushover Analysis (MPA), which has proved especially popular among researchers, are required for analyzing the structures with dampers. As the IDA method is too complicated and time consuming, the MPA-based IDA method was introduced, a method which is fast and cost effective and the results are accurate enough to be utilized. Adoption of a static analysis in the procedure of MPA-based IDA method encourages the speculation that this method cannot be used for structures with dampers. This misconception has led to the fact that no one has ever used this method for structures with additional damping. In the present article, it is intended to present an approach to promote the applicability of the MPA-based IDA method for structures with VE dampers. The proposed approach is verified by the exact IDA method and validated by a numerical example. The results indicate the sufficient accuracy of the proposed technique, in which the MPA-based IDA is employed for structures with VE dampers.
1. Introduction
Predicting the actual behavior of structures under the earthquake excitation is one of the major concerns of structural and earthquake engineers. When a severe earthquake occurs, the members of most structures are stressed beyond the elastic limit into the nonlinear area. Therefore, linear analyses cannot represent the accurate behavior of structures. On the other hand, performing static analyses (both linear and nonlinear) results in rough approximations because, in such methods, the earthquake excitation is equated with a static load with a constant height-wise distribution and is restricted to a single-mode response. Using this equivalent load leads to an uneconomic design. Consequently, it seems that nonlinear time history analyses could present the most realistic seismic demand in structures. On the other hand, one of the advantages of the incremental techniques, such as pushover method, over time history analyses is the adoption of a wide range of lateral load values, from zero to the instability load. Therefore, researchers have been seeking a method offering both of the mentioned advantages simultaneously; the realistic dynamic behavior of structures and different scaled levels of earthquake records. As a result, the IDA method was developed. This procedure is thought to be the most accurate method for determining the seismic demand of structures. For the first time, Bertero presented the IDA method [1]. Afterwards, the mentioned method was used by Nassar and Krawinkler [2]. Bazzurro and Cornell [3] adopted the method for a number of large three-dimensional nonlinear models. The IDA method was employed on steel moment frames by Luco and Cornell [4]. The applicability of the IDA method on composite frames was evaluated by Mehanny and Deieriein [5]. Other researchers used the method for evaluating the seismic response of structures, as exemplified by Dubina et al. [6], Psycharis and Papastramatiou [7], Gupta and Kunnath [8], Yun and et al. [9], Vamvatsikos and Cornell [10], Aschheim et al. [11], and John Mander B. et al. [12].
As mentioned earlier, the IDA technique is the most accurate solution for determining the seismic behavior of structures. However, this method is highly time-consuming because obtaining each IDA curve involves performing lots of nonlinear time history analyses. Therefore, it is not economic as it takes a long time to perform the IDA procedure. As a result, an approximate method which is capable of producing the IDA curve was devised, called the MPA-based IDA or MIDA (Modal Incremental Dynamic Analysis) method. This method is fast and inexpensive; in addition, the errors and differences between the IDA and the MPA-based IDA results are negligible.
The first rough method with the purpose of reducing the computational efforts of IDA was devised by Vamvatisikos and Cornell [13], who are also the developers of the IDA method. Afterwards, Mofid, Zarfam and Fard proposed the approximate MIDA method [14], and compared the MIDA and IDA results. They confirmed the reasonable accuracy of MIDA method. Han and Chopra presented the MPA-based IDA method [15], which is similar to the MIDA procedure. The mentioned method was applied on concrete buildings by Zarfam and Mofid [16]. In another research, the accuracy of the method on irregular buildings was evaluated by Bergami [17].
Viscoelastic dampers are viable energy dissipating systems to suppress earthquake-induced motion of structures. VE dampers provide supplemental damping and stiffness, and their effectiveness has been demonstrated both analytically and experimentally by researchers. Previous researches show that high-damping elastomers introduce a very low energy dissipation capacity but develop a moderate sensitivity to frequency and temperature [18]. A detailed description of VE dampers and the associated design concepts are presented in Section 3.
As stated before, in the mentioned researches, the MPA-based IDA method was not applied for structures with additional damping. The static analysis employed in the MPA-based IDA technique might make one think this method is not capable of accounting for the effects of supplemental damping. The major use of damping devices is in vibration control and usually for tall and special structures, and as the structures become taller or more complicated, the nonlinear dynamic analysis takes a longer time and becomes more laborious. Therefore, the necessity of employing a simple method for analyzing the structures with damping devices is more urgent than that of ordinary structures. In the present paper, a novel idea is presented, one which promotes the MPA-based IDA technique for use in structures with VE dampers. Indeed, in the present paper, the MPA-based IDA method is extended for the analysis of structures equipped with VE dampers; to this end, a fresh idea is put forward, and the ordinary procedure of MPA-based IDA method is modified. The major contribution of this paper is the development of a simple and accurate method for generating a modal incremental dynamic analysis method for structures with additional dampers. The proposed method is exerted on five 2D-steel moment frames equipped with VE dampers of different damping coefficients. The accuracy of the method is then ensured by comparing the results of the proposed method with those of the exact IDA method.
The outline of the paper is as follows. In the Section 2 of this paper, the procedure of the MPA-based IDA method for ordinary structures is reviewed. Section 3 is dedicated to the description of VE dampers. In Section 4, the proposed idea is presented for applying MPA-based IDA on structures with VE dampers. An example will be solved in Section 5 by both the proposed method and the exact IDA method, and the high accuracy of the method will be verified. Section 6 contains the source of errors. Finally, in Section 7, as the conclusion, the advantages of the proposed method are listed.
2. Review of the MPA-based IDA method for ordinary structures (structures with no additional damping)
In this section, the fundamentals of MPA-based IDA method will be explained first, and the procedure of the method will then be presented in Subsection 2.2.
2.1. Fundamentals of MPA-based IDA
The MPA-based IDA method is based on the established principle of using single-degree-of-freedom (SDOF) oscillators to approximate multi-degree-of-freedom (MDOF) systems [13]. In this method, the IDA curve of the MDOF structure is approximated through the nonlinear time history analysis of the single degree of freedom system and the nonlinear static analysis of the MDOF structure. Indeed, modal relations are used for converting the SDOF results to MDOF ones and vice versa. Such intuition is confirmed by comparing the deformed shapes of the structure produced by the MPA-based IDA method and the exact IDA method. This method is an approximate procedure for estimating the IDA curves and is devised by Chopra et al. [15]; they managed to prove the high accuracy of the method.
2.2. MPA-based IDA procedure for ordinary structures
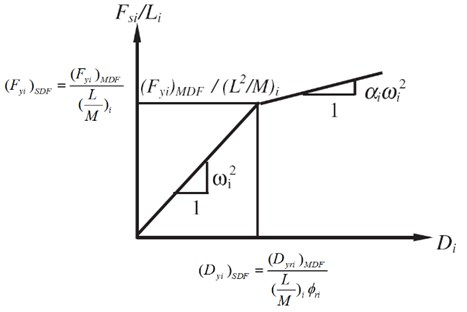
Performing an IDA analysis requires the adoption of the procedure which is described here. First of all, the mode shapes have to be determined for the most prominent modes. Afterwards, the pushover curves under the lateral loading pattern corresponding to the th mode are obtained in the way specified by Chopra and Goel (2001) [19]. Next, the equivalent SDOF structure corresponding to the nth mode is constructed with the help of Eqs. (1-5). The idealized bilinear force-displacement curve of the equivalent SDOF structure is illustrated in Fig. 1; indeed, the chart gives the bilinear idealization of the equivalent SDOF pushover curve. At this stage, the maximum displacements of the SDOF structure under the action of scaled records are computed. The next step involves the calculation of the maximum displacement of the MDOF structure based on the kind of reverse calculations according to Chopra and Goel [19] by means of Eq. (6). Now the MDOF structure has to be pushed up to the (MaxDispl)MDOF resulting from the prior step, and the damage index is calculated. The aforementioned procedure has to be followed for several first modes; the combination of the results of the different modes would provide the answer. According to the above procedure, there is no need to analyze the structure with a nonlinear dynamic analysis; however, the SDOF structure is analyzed through a nonlinear dynamic analysis. Therefore, adding a damper or inherent damping to the structure doesn’t change the results, and the effect of dampers cannot be accounted for in this method. Consequently, the MPA-based IDA method needs to be modified for use in damped structures. Of course, the influence of the damper stiffness is accounted for in the MPA-based IDA method, but the damping effect of the dampers is ignored in the method:
In Eqs. (1-6), and are the yielding strength and yielding roof displacement respectively for the th mode, represents the modal participation factor for the th mode, and the effective modal mass for the th mode is expressed by ; in addition, states the throof mode shape, and is the strain hardening angle of the steel material used in frame members.
Fig. 1Equivalent SDOF structure
3. Introduction, design and modeling of VE dampers
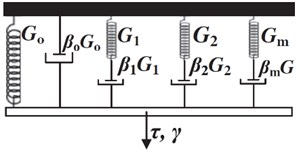
VE dampers are among the most popular passive control devices used in building structures. The stiffness and damping coefficients of VE dampers are frequency and temperature dependent; many researchers have worked on these relations [20], [21]. The considered VE material herein is the one studied by Fan [22], i.e. the ISD-110. Modeling VE dampers through simple models such as Maxwell, Kelvin-Voigt or Burgers models is not efficient enough; because such models are simply able to represent the mechanical properties of VE dampers and only for individual frequencies [23]. Highly developed models such as generalized Maxwell (GM) and generalized Voigt (GV) models could represent the realistic behavior of VE dampers. The literature shows that GM model is one of the best choices for modeling VE dampers [23]. In this paper, the shear stress-shear strain behavior of VE material is modeled using the GM model which is shown in Fig. 2.
Fig. 2The GM model of VE material
In GM model, the two basic parameters of VE materials, namely storage shear modulus () and loss factor (), are calculated as below:
Fan [22] has calibrated the GM model against the experimentally obtained values of and , assuming 4 and the VE material be the ISD-110; the obtained values for GM parameters are as stipulated in Table 1.
Table 1GM parameters
(KPa) | (KPa) | (KPa) | (KPa) | (KPa) |
191.4 | 2713.7 | 1356.3 | 11018.4 | 409.5 |
0.1225 | 0.04 | 0.1356 | 0.0061 | 1.2394 |
A combination of linear springs and dashpots (as illustrated in Fig. 2) can be used as a representation of the GM equations in the computational model. The total stiffness or total damping value of the VE damper is chosen by the designer as the target parameter. A value is also assumed for the damper thickness (). This way the area of VE damper () is determined using Eq. (9) or Eq. (10) respectively for stiffness or damping values acting as the target parameter.
For the case in which the target parameter is VE damper stiffness:
For the case in which the target parameter is VE damper damping:
In which , , and are the storage stiffness, thickness, storage damping and loss factor of VE damper respectively, expresses the storage shear modulus of VE material, states the first mode natural frequency of the frame with damper, and the term temp represents the ambient temperature.
The considered GM model consists of 5 springs and 5 dashpots; having , and , one could calculate the stiffness of springs and the damping coefficient of dashpots using Eqs. (11-12).
This way all of the prerequisites for generating the numerical model of the GM are met, and the GM model could be implemented.
4. The MPA-based IDA method for structures with additional damping
As stated above, in the MPA-based IDA method, the MDOF structure is analyzed with the help of a nonlinear static analysis. Therefore, the dynamic analysis of MDOF structures is not performed in the method, thus it might be misinterpreted that the effect of supplemental damping is not considered in the MPA-based IDA technique. As a result, no one has already adopted the MPA-based IDA method for structures with additional damping. In the present paper, a novel idea, in which it is intended to add the supplemental damping of MDOF structures to the inherent damping of SDOF structures, is presented. According to this idea, the supplemental damping is converted to the equivalent inherent damping for each mode. Therefore, an equivalent inherent damping is added to the real inherent damping of the structure as the representation of the additional damping. Now the structure is an ordinary structure with no additional damping; there is only some inherent damping, which is greater than the inherent damping of the conventional structure. As a result, the ordinary MPA-based IDA could be used to analyze the new structure. It should also be noted that, by using this idea, the effect of additional damping appears on the target displacement of the MDOF structure. Therefore, the prerequisite for applying the MPA-based IDA on damped structures is to convert the supplemental damping to an equivalent inherent damping in the SDOF structures.
Now the problem is how to convert the additional damping to an equivalent inherent damping for SDOF structures.
Later in Subsection 4.1, the methods employed for calculating the equivalent damping ratio of structures with added dampers will be reviewed. Afterwards, the procedure of MPA-based IDA method proposed for damped structures will be presented in Subsection 4.2. Finally, an example will be solved in Section 5 by the adoption of both the proposed method and the exact IDA method, and the high accuracy of the method will be confirmed.
4.1. Reviewing the methods of calculating the equivalent damping ratio of structures with added dampers
Reference books, [24] and [25], present various methods for estimating the equivalent damping ratio from vibration test results. Chang et al. [26] assessed the equivalent damping ratio of structures with viscoelastic dampers by applying the modal-strain-energy method. Li and Reinhorn [27] derived the damping ratio of a structure equipped with supplemental friction dampers. Lee et al. [28] developed a method for evaluating the equivalent damping ratio of a structure with supplemental damping devices. They derived a closed-form solution to obtain an equivalent modal damping ratio without performing numerical analyses. Ou [29] developed an equivalent model for passive energy dissipation systems. Occhiuzzi [30] calculated the modal damping ratios of non-classical damping schemes. Many researchers still maintain interest in the field of the moment frames with damping devices; the study of Huang [31] can be mentioned as exemplifying such studies. Most of the introduced methods for evaluating the equivalent damping ratio have the same nature but different formulations. For example, the closed form formulas developed by Lee [28] are just the same as Eq. (9-30) in FEMA356 [32].
Generally, all energy dissipating devices are categorized into 3 groups, velocity-dependent devices, displacement-dependent devices, and other types of devices. Lee [28] developed the following formulae for calculating the equivalent damping ratio respectively for each category.
1st category:
2nd category:
3rd category:
In the above equations is the angle between the axis of th device and the floor at which the device is installed. The notation and are the viscosity and the maximum control force of device . The parameter measures the relative displacement between the ends of device . As it is obvious, is the deflection shape factor of the structure. The , and show the generalized mass, stiffness and damping for th natural mode of frame, and , and represent the mass, stiffness and damping matrix of the structure respectively. The parameter denotes the standard deviation of the displacement between the ends of device j and notations and indicate the natural frequency and critical damping ratio achieved by the generalized mass and stiffness. and are displacement and velocity feedback, and shows the location vector of control force contributed from supplemental damping devices.
It should be noted that the process of generating the above equations is based on three assumptions:
1) The response of the structure is stationary random process;
2) The damping devices do not affect the mode shapes of the structure;
3) The structure has proportional inherent damping [28].
4.2. Extending the MPA-based IDA method for structures with added dampers
In this subsection, it is intended to improve the MPA-based IDA method and make it capable of being employed for additional damped structures. In the MPA-based IDA method, the MDOF structure is pushed, thus the effect of additional damping cannot be shown in the MDOF structure. On the other hand, the SDOF structure in this method is analyzed by using nonlinear time history analyses; therefore, in this part, the effect of additional damping has to be demonstrated. In our novel idea, the additional damping is converted to an equivalent inherent damping ratio, and the mentioned damping is added to the inherent damping ratio of the structure for use in the equivalent SDOF structure. Consequently, the proposed method is just like the ordinary MPA-based IDA one but with a different inherent damping.
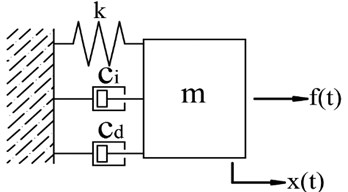
The problem occurring when using the MPA-based IDA method on structures equipped with dampers lies in the ignorance of the influence of additional damping in the static analysis of the MDOF structure. The only part of the MPA-based IDA method which benefits from nonlinear dynamic analysis is the part in which the equivalent SDOF structures are analyzed under the action of some selected records. Another reason for involving the role of additional damping in the mentioned part is that it is possible in the SDOF system to algebraically add the inherent damping to the equivalent additional damping of the related mode (illustrated in Fig. 3), and this is the reason why the procedure is simplified. The Eqs. (16-17) represent the possibility of the algebraic summation of inherent damping with the additional damping:
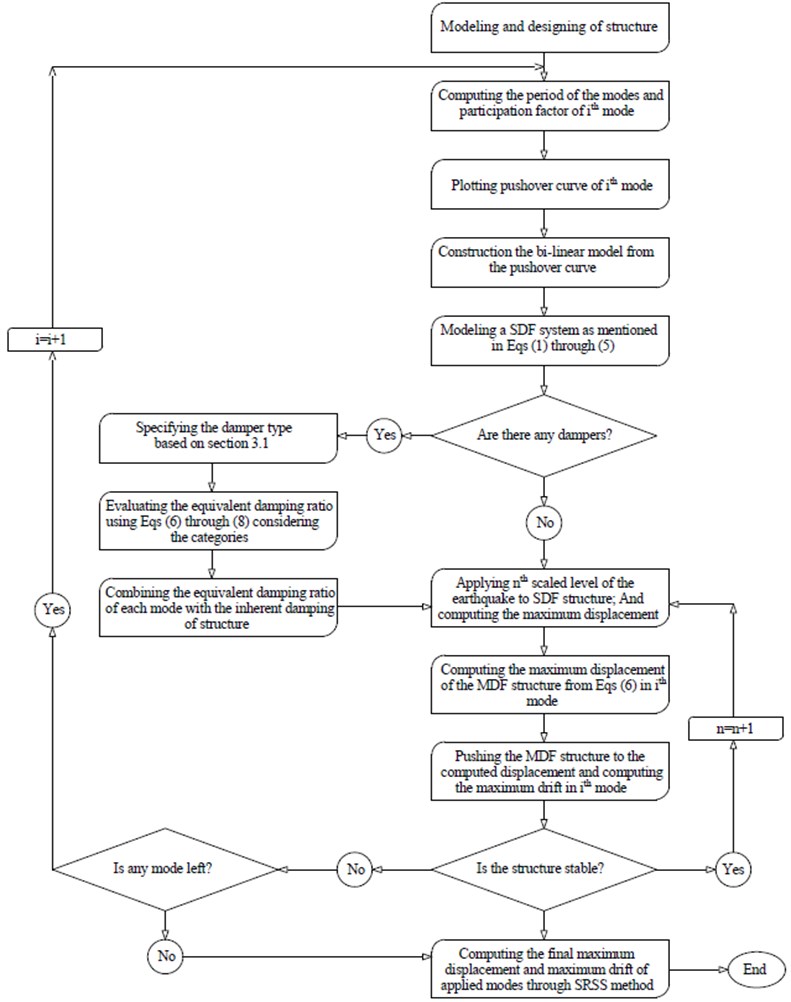
In this regard, in the proposed method, the additional damping has to be converted to the equivalent inherent damping. To calculate the equivalent damping ratio, the equations presented in Section 4.1 could be used. The damping ratio of the SDOF structure has to be calculated by adding the equivalent damping ratio of the additional damper to the inherent damping ratio of the structure. Therefore, as a matter of fact, the additional damping causes a decrease in the target displacement of the MDOF structure; the lower the target displacement, the lower the responses of the structure. This way the effect of the damper would be accounted for. The proposed procedure is presented in the flowchart of Fig. 4.
Fig. 3The model of SDOF oscillator with added damper
5. An example of using the MPA-based IDA method for structures with viscoelastic dampers (VEd)
As described in this part, a comparative study was conducted to compare the MPA-based IDA results with those of IDA. The 2D nonlinear analytical models of both the conventional moment frame and the moment frame with VEd were developed for the nonlinear dynamic analysis with OpenSEES software [33]. The example model is a moment-resisting steel frame designed based on AISC-ASD89 [34] specifications. Column and beam sections vary in stories; column and beam moments of inertia and the cross section area of the braces are presented in Table 2.
Fig. 4MPA-based IDA method flowchart for structures with dampers
For modeling the columns and the beams, nonlinear beam-column elements with distributed plasticity were used. For introducing the braces, elastic truss elements were employed, and for modeling the material, Steel01 material with a bilinear behavior was used. The frame has 5 stories of 3-meter height and three bays of 5-meter spans. Five frames were developed, one with no damper (F1) and four frames with different amounts of damping (F2, F3, F4 & F5), with a VEd in each story as shown in Fig. 5. For each damped frame, the viscoelastic dampers have the same damping coefficient in all stories. Four different amounts of damping were considered.
Fig. 5Configuration of frames
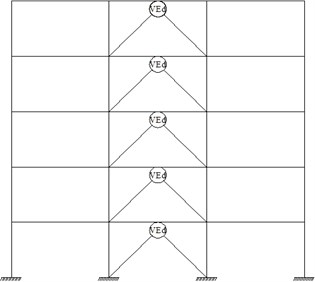
Table 2Frame sections
Story | Column moment of inertia (cm4) | Beam moment of inertia (cm4) | Brace section area (cm2) |
1 | 2640 | 1940 | 27 |
2 | 2640 | 1940 | 27 |
3 | 1738 | 1320 | 22 |
4 | 1738 | 1320 | 22 |
5 | 1738 | 1320 | 22 |
The design of VE dampers was conducted based on the method described in Section 3. The damping coefficient of the VE dampers was selected as the target parameter. In order to cover a high range of damping coefficient values, 4 different values were considered for additional damping (related to 0.7 % to 17 % of critical damping, which is the practical range of damping), as specified in Table 3.
As mentioned previously, the VE material was considered to be the ISD-110, and the GM model used for modeling the VE damper is the one explained in Section 3. Using the procedure explained in Section 3, the stiffness of springs and the damping coefficients of dashpots were calculated, the results of which are illustrated in Table 4. The yield stress of the structural steel is assumed to be equal to 240 MPa. The gravity loads which were considered in the design are selected according to ASCE 07 [35].
Table 3Damping coefficient of frames
Frame label | Damping coefficient (N·S/m) |
F1 | 0 |
F2 | 10000 |
F3 | 20000 |
F4 | 50000 |
F5 | 250000 |
The springs and dashpots are modelled using a zero-length element exhibiting linear stiffness and damping values. The combination of these springs and dashpots would constitute the GM model.
Table 4VE dampers’ spring stiffness (N/m)
VE dampers’ spring stiffness and damping coefficient | |||||
F0 | F1 | F2 | F3 | F4 | |
K0 (N/m) | 0 | 4412.79 | 9022.796 | 23953.18 | 155964.1 |
K1 (N/m) | 0 | 62565.25 | 127926.6 | 339612 | 2211284 |
K2 (N/m) | 0 | 31269.94 | 63937.4 | 169737.2 | 1105194 |
K3 (N/m) | 0 | 254032.8 | 519418.9 | 1378922 | 8978447 |
K4 (N/m) | 0 | 9441.157 | 19304.26 | 51247.78 | 333684.9 |
C0 (N.S/m) | 0 | 540.5668 | 1105.292 | 2934.264 | 19105.6 |
C1 (N.S/m) | 0 | 2502.61 | 5117.066 | 13584.48 | 88451.36 |
C2 (N.S/m) | 0 | 4240.204 | 8669.911 | 23016.36 | 149864.3 |
C3 (N.S/m) | 0 | 1549.6 | 3168.455 | 8411.424 | 54768.53 |
C4 (N.S/m) | 0 | 11701.37 | 23925.7 | 63516.5 | 413569.1 |
5.1. The verification of models and results
The verification and validation of the generated models and the corresponding results have been done by two procedures. It is intended in the first procedure to verify the models by comparing the periods and mode shapes extracted from OpenSEES models with the ones from SAP2000 software [36]. The next procedure is used for verifying the accuracy of the proposed method by comparing the results of the method with those of the exact IDA method. The comparison of the periods of modes and their difference in OpenSEES and SAP2000 is presented in Table 5.
Table 5Comparison of modes periods extracted from OpenSEES and SAP2000
Period of main frame (s) | |||
Mode | Open SEES | SAP2000 | Difference (%) |
1 | 1.996 | 2.040 | 2.16 % |
2 | 0.654 | 0.667 | 1.93 % |
3 | 0.385 | 0.391 | 1.65 % |
4 | 0.276 | 0.279 | 1.08 % |
5 | 0.227 | 0.229 | 0.67 % |
It is clear that satisfactory agreements have been found between the periods of OpenSEES models and those of SAP2000 models.
5.2. Calculating the equivalent damping ratio
As the behavior of viscoelastic dampers are functions of velocity, the equivalent damping ratio is achieved by the use of Eq. (13). The mode shapes and the equivalent damping ratios are shown in Table 6.
Table 6Calculated equivalent damping ratios of frames
For 1st mode | F1 | F2 | F3 | F4 | F5 | |
Mode shape | 1st Floor | 0.001011 | 0.0010199 | 0.0010276 | 0.001047 | 0.0011026 |
2nd Floor | 0.002292 | 0.002299 | 0.002305 | 0.0023193 | 0.00234432 | |
3rd Floor | 0.003395 | 0.0033972 | 0.0033992 | 0.0034031 | 0.00339957 | |
4th Floor | 0.004198 | 0.004196 | 0.0041942 | 0.0041897 | 0.00417579 | |
5th Floor | 0.004636 | 0.0046311 | 0.0046266 | 0.0046163 | 0.00460592 | |
Period (s) | 1.99599 | 1.94899 | 1.90639 | 1.79527 | 1.37860 | |
Equivalent damping ratio | 0 | 0.74 % | 1.45 % | 3.39 % | 17.31 % |
5.3. Records applied to the structures
All of the records are selected from the California state. The criteria for selecting the records are distance to fault, strong motion duration, magnitude of earthquake and also the soil type. The distance to fault is between 15 and 36 km. Thus, no near-fault motions with directivity effects are included. The moment magnitude is within the range of 6.0-6.9. The list of the records and the characteristics of the 30 ground motions are provided in Table 7.
Table 7Utilized records
No | Record | Station | Soil | PGA | Duration | Distance |
1 | Imperial Valley 1979 | Chihuahua | C,D | 0.254 | 40 | 28.7 |
2 | Imperial Valley 1979 | Chihuahua | C,D | 0.27 | 40 | 28.7 |
3 | Northridge 1994 | Hollywood Storage | C,D | 0.231 | 40 | 25.5 |
4 | San Fernando 1971 | Lake Hughes #1 | _,C | 0.145 | 30 | 25.8 |
5 | San Fernando 1971 | Hollywood Stor Lot | C,D | 0.21 | 28 | 21.2 |
6 | Super Stition Hills 1987 | Wildlife Liquefaction Arrey | _,D | 0.134 | 29.805 | 24.7 |
7 | Super Stition Hills 1987 | Wildlife Liquefaction Arrey | _,D | 0.134 | 29.805 | 24.7 |
8 | Super Stition Hills 1987 | Salton Sea Wildlife Refuge | D,D | 0.119 | 21.89 | 21.7 |
9 | Super Stition Hills 1987 | Plaster City | C,D | 0.186 | 22.23 | 21 |
10 | Super Stition Hills 1987 | Calipatria Fire Station | C,D | 0.247 | 22.11 | 28.3 |
11 | Landers 1992 | Barstow | B,D | 0.135 | 40 | 36.1 |
12 | Cape Mendocino 1992 | Rio Dell Overpass | C,B | 0.385 | 36 | 18.5 |
13 | Cape Mendocino 1992 | Rio Dell Overpass | C,B | 0.549 | 36 | 18.5 |
14 | Coalinga 1983 | Parkfield - Fault Zone 3 | _,D | 0.164 | 40 | 36.4 |
15 | Whittier Narrows 1987 | Beverly Hills | B,C | 0.126 | 37.4 | 30.3 |
16 | Northridge, 1994 | LA, Baldwin Hills | B,B | 0.239 | 40 | 31.3 |
17 | Imperial Valley, 1979 | El Centro Array #12 | C,D | 0.143 | 39 | 18.2 |
18 | Loma Prieta, 1989 | Anderson Dam Downstream | B,D | 0.24 | 39.6 | 21.4 |
19 | Loma Prieta, 1989 | Anderson Dam Downstream | B,D | 0.244 | 39.6 | 21.4 |
20 | Loma Prieta, 1989 | Agnews State Hospital | C,D | 0.159 | 40 | 28.2 |
21 | Loma Prieta, 1989 | Anderson Dam Downstream | B,D | 0.244 | 39.6 | 21.4 |
22 | Loma Prieta, 1989 | Coyote Lake Dam Downstream | B,D | 0.179 | 40 | 22.3 |
23 | Imperial Valley, 1979 | Cucapah | C,D | 0.309 | 40 | 23.6 |
24 | Loma Prieta, 1989 | Sunnyvale Colton Ave | C,D | 0.207 | 39.25 | 28.8 |
25 | Imperial Valley, 1979 | El Centro Array #13 | C,D | 0.117 | 39.5 | 21.9 |
26 | Imperial Valley, 1979 | Westmoreland Fire Station | C,D | 0.074 | 40 | 15.1 |
27 | Loma Prieta, 1989 | Sunnyvale Colton Ave | C,D | 0.209 | 39.25 | 28.8 |
28 | Imperial Valley, 1979 | El Centro Array #13 | C,D | 0.139 | 39.5 | 21.9 |
29 | Imperial Valley, 1979 | Westmoreland Fire Station | C,D | 0.11 | 40 | 15.1 |
30 | Loma Prieta, 1989 | Hollister Diff. Array | –,D | 0.269 | 39.65 | 25.8 |
5.4. Performing the IDA and MPA-based IDA technique on the example frames
Selecting the appropriate parameters for intensity measure (IM) and damage measure (DM) is particularly important in IDA analyses. The IM should contain the seismic parameters of the record and it has to be scalable. Therefore, in this research, the intensity measure and the damage measure are considered to be the PGA and the maximum inter-story drift ratio respectively. Twenty-five scale factors were multiplied to each record.
5.4.1. Responses to Rec 01 earthquake
The MPA-based IDA curves and the IDA curves are generated for the thirty records listed in Table 7; in order to make the paper brief, only the results of record 01 are presented here.
5.4.1.1. Comparing the MPA-based IDA and IDA results
The IDA curve is assumed to be the best damage indicator; therefore, as an example, Fig. 6 shows the concordance between the results of the proposed method and those of IDA method for record 01.
Fig. 6Comparing the MPA-based IDA and IDA results for record 01
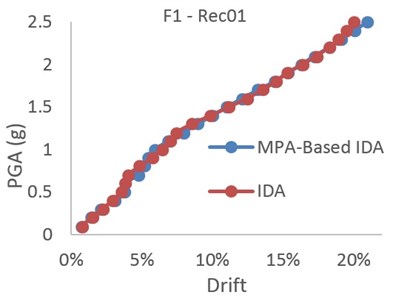
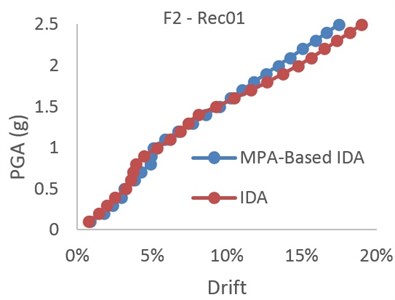
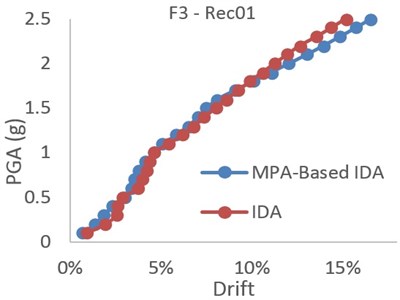
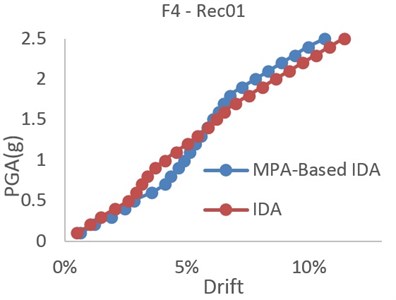
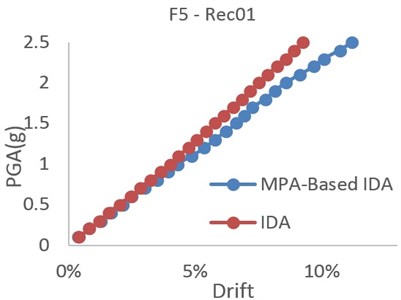
As illustrated in Fig. 6, the proposed method has a suitable coincidence with the MPA-based IDA method. It could be said that the coincidence is slightly dependent on the additional damping value and PGA. By increasing the additional damping or PGA, the accuracy of the method slightly decreases, but the decrement is too little and negligible.
5.4.1.2. Error of MPA-based IDA method
The error of the proposed method is shown in Fig. 7. It is assumed that the IDA method is an exact method; therefore, the error of the proposed method would be equal to the difference between the results of the proposed method and those of the IDA method.
Fig. 7Error of MPA-based IDA method
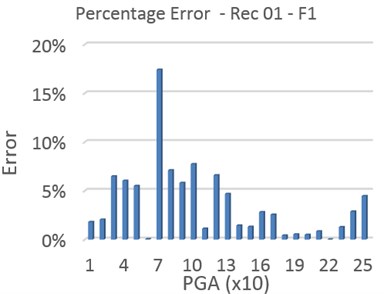
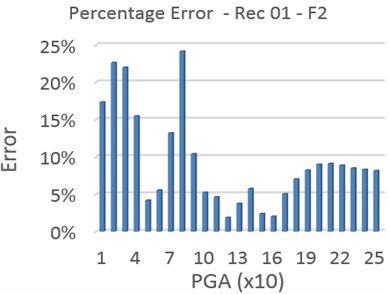
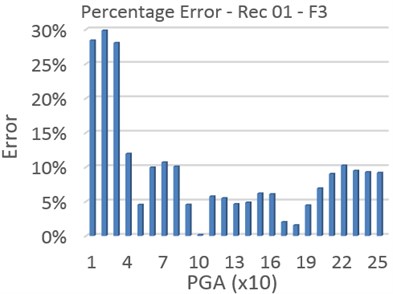
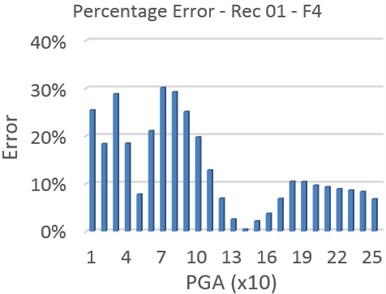
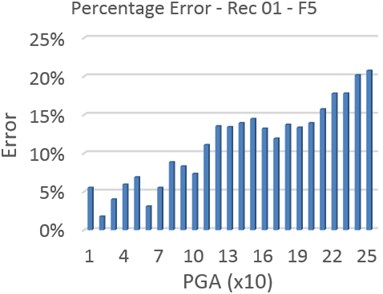
As indicated in Fig. 7, the errors of the proposed method are typically around ten percent, but for some PGAs, they increase up to thirty percent. For Rec 01, the average errors are 3.66 %, 9.3 %, 9.33 %, 13.28 % and 11.27 % for F1, F2, F3, F4 and F5 respectively; these amounts of error are in the acceptable ranges.
5.4.1.3. Variation of the errors with damping increment
As approximate formulas have been employed for calculating the equivalent inherent damping, it is expected that, by increasing the additional damping, the errors become greater. In Fig. 8, the variation of the average errors with the increase in the additional damping is presented.
Fig. 8Error variation with damping increment
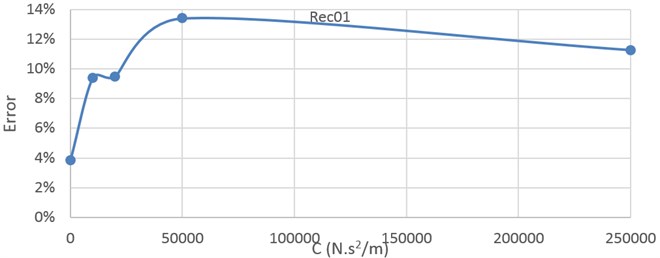
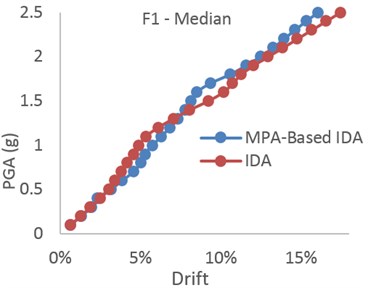
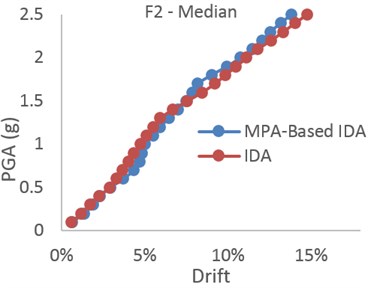
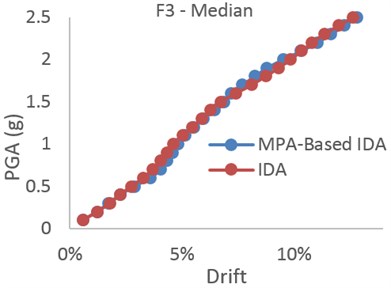
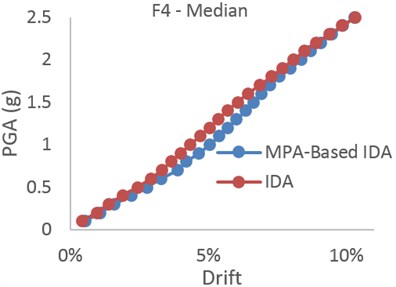
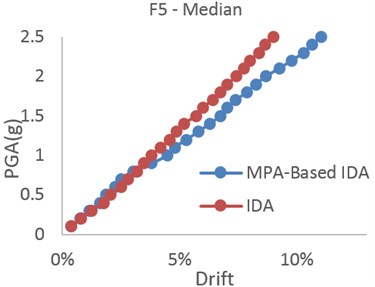
Fig. 9Comparing the MPA-based IDA and IDA results – median of records
5.4.2. Median IDA curve
We have a collection of IDA curves of the same structural model under different records that are all parameterized on the same IM and DM. Therefore, the results are usually summarized in mean, median, 16 % and 84 % response. The median results and a comparison between the results of the proposed method and those of the exact IDA method are presented in Fig. 9.
5.4.2.1. Comparing the MPA-based IDA & IDA results
The median curves could be plotted for all of the records and can be assumed to be the most reliable results. Herein the concordance of the proposed method with the exact IDA method is presented through the median curves.
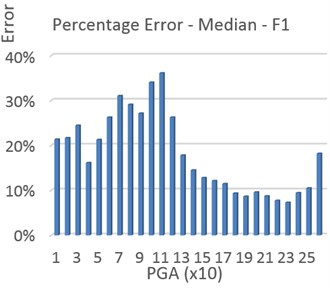
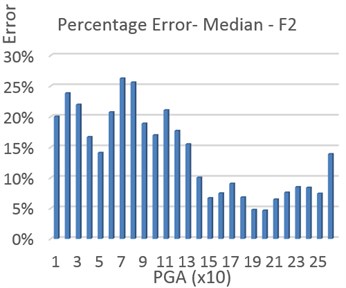
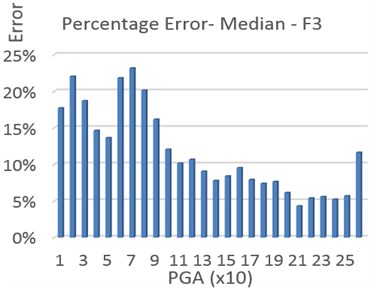
Fig. 10Comparing the MPA-based IDA and IDA results – median of records
As shown in Fig. 9, the good agreement obtained between the results of the proposed method and the exact IDA method is attributed to all records. Based on Fig. 9, the conclusions arrived at in Subsection 5.4.1.1 about the sensitivity of the concordance to the PGA and additional damping are also valid for the median curves.
5.4.2.2. Error of MPA-based IDA method
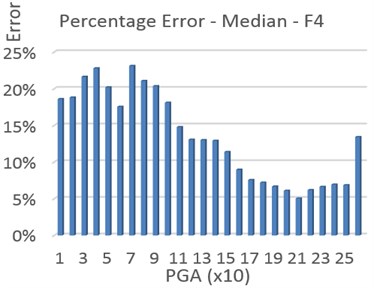
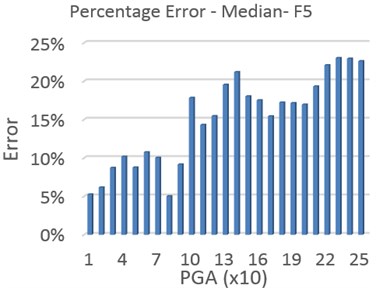
The error of the median response is presented in Fig. 10. Indeed, Fig. 10 is representative of the errors for all records. As it is obvious, the errors are typically around fifteen percent, and for some PGAs, they increase up to thirty-five percent.
5.4.2.3. Variation of errors with damping increment
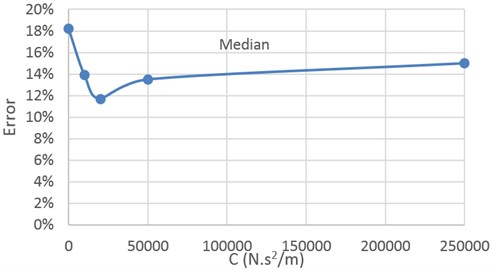
In Fig. 11, the variation of the median results’ errors with increasing additional damping is illustrated. Contrary to all expectations, it is observed that the errors do not depend on additional damping.
Fig. 11Error variation with damping increment
6. Sources of error
Numerical modeling is always accompanied by some errors which are unavoidable. Herein the sources of probable errors are mentioned. It should be noted that despite these errors, the validation has confirmed the sufficient accuracy of the proposed method. The errors would arise from the following possible sources.
First of all, mode combination and use of finite modes lead to some error. On the other hand, idealizing the capacity curve of each mode by a bilinear curve results in inaccuracy. It should be noted also that using the elastic mode shape and pushing the MDOF structure by this height wise distribution result in some error. In addition, using the approximate formulas for converting the additional damping to the equal inherent damping could cause some error to occur. Moreover, the GM model used for modeling the VE damper doesn’t completely coincide with the reality. Finally, the temperature dependence of VE material was ignored in the study.
7. Conclusions
In the present study, an idea was proposed for developing the MPA-based IDA method for structures with VE dampers. According to this idea, the additional damping is converted to the equivalent inherent damping and is added to the real inherent damping of the structure; this way the MPA-based IDA analysis could be followed just like conventional structures. The results confirm the accuracy of the proposed method for structures equipped with VE dampers. The major advantages of the method are its simplicity, short timescale and practicality. The following conclusions can be drawn from this investigation.
– Using the MPA-based IDA method instead of IDA method has a significant effect on reducing the analysis cost.
– The results show a good agreement between MPA-based IDA curve and IDA curve either for damped structures and structures with no dampers.
– As it is shown in Fig. 6 and Fig. 9, the proposed idea for employing the MPA-based IDA method on the structures with additional damping is accurate enough to use. The average error is less than 15 percent.
– The accuracy of the MPA-based IDA method doesn’t depend on the damping coefficient. Adding damping doesn’t change the accuracy of the method in a regular order.
– The adopted earthquake records and their scale don’t affect the equivalent inherent damping. In other words, the proposed method is not sensitive to the record and its scale.
– Increasing the additional damping results in a decrease in the structural response.
References
-
Bertero V. V. Strength and deformation capacities of buildings under extreme environments. Structural Engineering and Structural Mechanics, Vol. 53, Issue 1, 1977, p. 29-79.
-
Nassar A., Krawinkler H. Seismic Demands for SDOF and MDOF Systems. Technical Report 95, Blume Earthquake Engineering Center, Stanford Digital Repository, 1991.
-
Bazzurro P., Cornell C. A. Seismic hazard analysis of nonlinear structures. I: Methodology. Journal of Structural Engineering, Vol. 120, Issue 11, 1994, p. 3320-3344.
-
Luco N., Cornell C. A. Effects of random connection fractures on the demands and reliability for a 3-story pre-Northridge SMRF structure. Proceedings of the 6th US National Conference on Earthquake Engineering, 1998, p. 1-12.
-
Mehanny S. S. F., Deierlein G. G. Modeling and Assessment of Seismic Performance of Composite Frames with Reinforced Concrete Columns and Steel Beams, Stanford University, 1999.
-
Dubina D., Ciutina A., Stratan A., et al. Ductility Demand for Semi-Rigid Joint Frames. Moment Resistant Connections of Steel Frames in Seismic Areas. Vol. 1, 2000, p. 371-408.
-
Psycharis I., Papastamatiou D., Alexandris A. Parametric investigation of the stability of classical columns under harmonic and earthquake excitations. Earthquake Engineering and Structural Dynamics, Vol. 29, Issue 8, 2000, p. 1093-1110.
-
Gupta B., Kunnath S. K. Adaptive spectra-based pushover procedure for seismic evaluation of structures. Earthquake Spectra, Vol. 16, Issue 2, 2000, p. 367-392.
-
Yun S. Y., Hamburger R. O., Cornell C. A., et al. Seismic performance evaluation for steel moment frames. Journal of Structural Engineering, Vol. 128, Issue 4, 2002, p. 534-545.
-
Vamvatsikos D., Allin Cornell C. Incremental dynamic analysis. Earthquake Engineering and Structural Dynamics, Vol. 31, Issue 3, 2002, p. 491-514.
-
Aschheim M., Tjhin T., Comartin C., et al. The scaled nonlinear dynamic procedure. Engineering Structures, Vol. 29, Issue 7, 2007, p. 1422-1441.
-
Mander J. B., Dhakal R. P., Mashiko N., et al. Incremental dynamic analysis applied to seismic financial risk assessment of bridges. Engineering Structures, Vol. 29, Issue 10, 2007, p. 2662-2672.
-
Vamvatsikos D., Cornell C. A. Direct estimation of seismic demand and capacity of multidegree-of-freedom systems through incremental dynamic analysis of single degree of freedom approximation. Journal of Structural Engineering, Vol. 131, Issue 4, 2005, p. 589-599.
-
Mofid M., Zarfam P., Fard B. R. On the modal incremental dynamic analysis. Structural Design of Tall and Special Buildings, Vol. 14, Issue 4, 2005, p. 315-329.
-
Han S. W., Chopra A. K. Approximate incremental dynamic analysis using the modal pushover analysis procedure. Earthquake Engineering and Structural Dynamics, Vol. 35, Issue 15, 2006, p. 1853-1873.
-
Zarfam P., Mofid M. On the modal incremental dynamic analysis of reinforced concrete structures, using a trilinear idealization model. Engineering Structures, Vol. 33, Issue 4, 2011, p. 1117-1122.
-
Bergami A. V., Xu L., Nuti C. Proposal of a modal pushover based incremental analysis. Applied Mechanics and Materials, 2016, p. 333-338.
-
Lee K. S. Seismic Behavior of Structures with Dampers Made from Ultra High Damping Natural Rubber. Ph.D. Dissertation, Department of Civil and Environmental Engineering, Lehigh University, Bethlehem, PA, 2003.
-
Chopra A. K., Goel R. K. A modal pushover analysis procedure for estimating seismic demands for buildings. Earthquake Engineering and Structural Dynamics, Vol. 31, Issue 3, 2002, p. 561-582.
-
Lewandowski R., Bartkowiak A., Maciejewski H. Dynamic analysis of frames with viscoelastic dampers: a comparison of damper models. Structural Engineering and Mechanics, Vol. 41, Issue 1, 2012, p. 113-137.
-
Singh M., Chang T.-S. Seismic analysis of structures with viscoelastic dampers. Journal of Engineering Mechanics, Vol. 135, Issue 6, 2009, p. 571-580.
-
Fan C.-P. Seismic Analysis, Behavior, and Retrofit of Non-Ductile Reinforced Concrete Frame Buildings with Viscoelastic Dampers. Lehigh University, 1998.
-
Lewandowski R., Chorążyczewski B. Remarks on modelling of passive viscoelastic dampers. Proceedings of the 9th International Conference on Modern Building Materials, Structures and Technique, 2007, p. 16-18.
-
Chopra A. K. Dynamics of Structures, Vol. 3. Prentice Hall, New Jersey, 1995.
-
Penzien Clough Dynamics of Structures. McGraw-Hill, 1993.
-
Hao D., Chang K., Lai M., et al. Seismic Behavior and Design Guidelines for Steel Frame Structures with Added Viscoelastic Dampers. National Taiwan University, National Center for Earthquake Engineering Research, 1993.
-
Li C., Reinhorn A. M. Experimental and Analytical Investigation of Seismic Retrofit of Structures with Supplemental Damping: Part II-Friction Devices. University at Buffalo, State University of New York, National Center for Earthquake Engineering Research, 1995.
-
Lee S.-H., Min K.-W., Hwang J.-S., et al. Evaluation of equivalent damping ratio of a structure with added dampers. Engineering Structures, Vol. 26, Issue 3, 2004, p. 335-346.
-
Ou J., Long X., Li Q. Seismic response analysis of structures with velocity-dependent dampers. Journal of Constructional Steel Research, Vol. 63, Issue 5, 2007, p. 628-638.
-
Occhiuzzi A. Additional viscous dampers for civil structures: analysis of design methods based on effective evaluation of modal damping ratios. Engineering Structures, Vol. 31, Issue 5, 2009, p. 1093-1101.
-
Huang B.-W., Tseng J.-G., Ko Y.-L. Stress and vibration of a viscoelastic damping isolator under impact loading. Journal of Vibroengineering, Vol. 16, Issue 5, 2014, p. 2355-2362.
-
Pre-standard F. Commentary for the Seismic Rehabilitation of Buildings, Report FEMA-356. SAC Joint Venture for the Federal Emergency Management Agency, Washington, DC, 2000.
-
Mazzoni, McKenna, Scott, et al. Open System for Earthquake Engineering Simulation (Opensees). User Command Language Manual. University of California, Pacific Earthquake Engineering Research Center, Berkeley, 2006.
-
AISC. Specification for Structural Steel Buildings. Allowable Stress Design (ASD), 1989.
-
ACSE. Minimum Design Loads for Buildings and Other Structures. SEI 7, ASCE Library, 1998, p. 368.
-
Wilson E., Habibullah A. SAP2000 Integrated Finite Element Analysis and Design of Structures. Analysis Reference. Computers and Structures, 1997.
