Abstract
A general assumption about fluid power systems is that the pressure ripple of trapped volume is a primary source for fluid-borne noise. Whereas the high frequency vibration characteristics generated by pressure fluctuations of trapped volume are different under different air content in the oil. This paper presents the non-Newtonian fluid models to describe the oil flow condition in external gear pumps. In this analysis, pressure ripple due to compressibility of fluid is considered, and the effect of pressure ripple in the trapped volume of external gear pumps has been investigated by comparing with 8 % air content and 10 % air content in the oil. It was found that the amplitude of pressure fluctuation would drop about 2.5 MPa with the increase 2 % of the air content under the same conditions of load and speed. The whole work was performed on the computational fluid dynamics (CFD) environment, an efficient tool for the simulation of dynamic engineering systems, and more particularly of fluid power.
1. Introduction
Hydraulic pumps are used in a wide range of applications and they can handle a variety of liquids at relatively adverse working conditions such as high pressure, low temperature and high noise. However, a shortcoming of this system is that the pump itself will produce a series of vibration noise, especially the pump fluid-borne noise. For the gear pumps, the pressure fluctuation of trapped volume is a primary source of fluid-borne noise. Over the years vibration has emerged as one of the key accessible parameters with which to judge the condition of operating machinery. The aim of the present study is to assist in the design of improved gear pumps, particularly for hydraulic system applications, so the ability to predict pressure fluctuation of trapped volume is a key requirement.
The pressure pulsation of trapped volume in gear pumps is not only related with the gear structure, but also be connected with air content of oil. In the operation of a gear pump, trapped volumes of fluid as the gear speed to rapid change, the air is released from the oil at the low pressure region can result in cavitation when the trapped volumes of fluid are in expansion stage. On the contrary, the pressure will rise sharply due to the squeeze of oil when the trapped volumes of fluid are under compression, which cause vibration and noise, affecting the stationarity and stress of the gear machine [1].
A number of investigators have considered the effect of air content on the pressure variations within pumps, by using the mixture model in the calculation. This model has an extra continuity equation for the vapor volume fraction, and solves the continuity and the momentum equations for the mixture. The mixture model is recommended for homogeneous multiphase flow and proposed by Ishii [2], which are already implemented in commercial CFD software such as Fluent [3]. More general CFD approaches have been developed to analyze the cavitation flow characteristics of hydraulic machines through numerical calculations. Such as Medvitz et al. [4], Kunz et al. [5] and Zwart et al. [6]. In 2006, Casoli et al. [7] adopted one-fluid flow approaches based on the continuum assumption to simulate the characterization of fluid properties in swash-plate axial piston pump. The cavitation was considered and the air dissolved into the oil was calculated by Dalton-Henry’s law. In practical hydraulic systems, fluid is a mixture of the basic fluid, dissolved air/gas, air/gas bubbles and sometimes also vapor [8]. Gholizadeh et al. [9] provided a summary many models which were LMS model [10], Ruan and Burton model [11] and Yu model [12] for fluid bulk modulus in the low pressure range and presented some modifications to these models. These models are based on steady-state laws to describe the instantaneous free air content in the fluid.
Previous research has developed advanced models to simulate the physical phenomena in external gear pumps includes a detailed evaluation of the main flow though the unit accounting for the main geometric and kinematic features of the machine through lumped parameter approaches [13-15]. These models can be an effective prediction the dynamic characteristics of the gear pumps, and where the trapped volume was considered, but the air dissolved in the fluid was not mentioned yet. Cavitation phenomena occurs when the fluid pressure falls below the saturation pressure and there is release of the air dissolved in the oil. Campo et al. [16] used the Zwart’s model [6] to study the cavitation effects on the volumetric efficiency of external gear pumps. Where, the total volume of dissolved air is given by the Bunsen coefficient and the value is 0.09 for oil. Zhou et al. [17] presented a new approach to model cavitation due to air release and oil evaporation in lumped parameter model for external gear machines. The instantaneous gas content into the fluid is derived from a simplified version of the Full Cavitation Model [18]. Eaton et al. [19] presented a discrete parameter fluid dynamics approach of predicting the pressure in the trapped volumes of meshing gear pump teeth, and used the experiment to verify the influence of cavitation. Where, the measured air content value of 24 percent. To the author’s best knowledge, all the previous computational or experimental studies were performed on a single trapped volume of gear pumps or air content dissolved in oil, has not been considered the influence of various air content on trapped volume of gear pumps.
The main purpose of this paper is to study the pressure ripple characteristics in the trapped volume of external gear pumps, focusing on the analysis of pressure fluctuation under different air content dissolved in oil. First introducing the governing equations and geometry of the external gear pump. Then, pressure change according to the volume change of oil was calculated, depending on entrained air content.
2. Theoretical formulation
2.1. Governing equations
This paper adopt mixture model to simulate the pressure fluctuation of trapped volume through an intermeshing industrial-scale gear pump. A multiphase system is defined as a mixture of the phases of solid, liquid and gas. Multi-phase flow phenomena are typically dominated by one phase and another non-dominating phase [20]. Ignoring thermodynamical effects, two phases are assumed to move at the same velocity, the dynamics of a two-continua mixture of oil and air is governed by the following equations that model the conservation of mass and momentum [21]:
in which:
where is the mixture density, is the mixture velocity, is the mixture pressure and is the mixture’s viscous stress tensor. , , , and respectively represent the volume fraction, density, velocity, pressure and stress tensor of the phase . It is assumed that two phases have no slip velocity, so the convective momentum transfer between phases is equal to zero that is . Considering the influence of interaction forces , the momentum equation of mixture Eq. (2) can be written as:
2.2. Turbulence model
As a mature turbulence model, the re-normalization group (RNG) - turbulence model is suitable to simulate the complex flow in rotating and high curvature computational domain, such as turbomachines, centrifugal machines, gear machines and so on. Here, the RNG - model is adopted for analyses and proposed by Yakhot et al. [22]. The turbulence kinetic energy and the dissipation rate of turbulent kinetic energy are obtained from the following transport equations:
in which:
where is the mixture velocity vector, and are the inverse effective Prandtl numbers for and , the effective viscosity , is the mixture viscosity, the turbulent eddy viscosity , represents the generation of turbulence kinetic energy due to mean velocity gradients, is the dependent time shear rate. The constants for the turbulent flow model have the following default values [23]: 0.0845, 1.39, 1.42, 1.68, 4.38, 0.012.
3. External gear pump geometry and calculation methods
3.1. External gear pump geometry
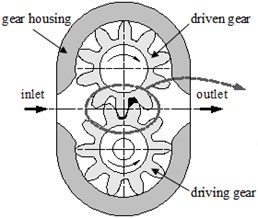
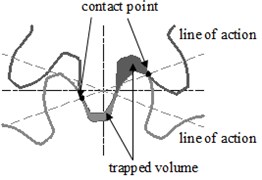
The geometry of external gear pump with an identical number of teeth on each pair of meshing gears is illustrated in Fig. 1(a). Which is simple in its operating principle, as the gears rotate the fluid is transferred from inlet port to outlet port around the outside of the gears, and the displacement of the fluid is accomplished by two meshing gears rotating against each other. When gear teeth meshing with each other, it will form a closed cavity which separates suction side and discharge side, known as the trapped volume (Fig. 1(b)). The trapped volume of fluid with rapid changes results in the generation of pressures above and below the inlet and discharge pressures, cause vibrations and noises, affecting the stationarity and stress of the gear machine. Parameters of the external gear pump are shown in Table 1.
Fig. 1a) Schematic geometry of the external gear pump and b) details of the meshing zone
a)
b)
Table 1Parameters of the external gear pump
Module (mm) | 3 | Addendum coefficient | 1 |
Number teeth | 10 | Radial clearance coefficient | 0.25 |
Pressure angle (°) | 20° | Addendum modification coefficient | 0 |
Tooth width (mm) | 10 | Rotational speed (rpm) | 3000 |
3.2. Calculation methods
According to the internal flow characteristics of a rotary positive displacement pump, the three-dimensional computational model was generated in Pro/E software. The model’s grids, which were composed of an unstructured tetra/mixed, were developed using ICEM. The size of the mesh in the computational region is controlled by the octree in the ICEM. A mesh with about 1 million cells in total was chosen for the simulations. The geometrical operation of the gear pump stems from the rotation of boundaries. So, an arbitrary Lagrangian-Eulerian (ALE) formulation with smoothing and remeshing are employed to the numerical procedure.
The pressure inlet boundary conditions and the pressure outlet boundary conditions were applied at the intake region and the discharge region of the positive displacement gear pump, respectively. At the inlet boundary, the gauge total pressure is set as the atmospheric pressure. At the outlet boundary, the gauge pressure is assigned to 2.5 MPa. The specification methods of the turbulence flow in the inlet and the outlet are described by the turbulent intensity and the hydraulic diameter. The turbulent intensities of inlet and outlet have the same value of 5 %.
The gear pump is able to pump high-viscosity fluids with high efficiency. It is well known that such lubricating oils, with a large quantity of high molecular-weight polymers as the viscosity index improver added, exhibit the same behavior as pseudo-plastic fluids. In 1971, Wada and Hayashi [24] clarified the non-Newtonian characteristics of oil. In 1990, Gecim [25] used the power-law model to study the non-Newtonian effects of two oils under different temperature by the experimental. Therefore, this paper adopt power-law model [26] to simulate the pressure ripple changes of the non-Newtonian fluid in trapped volume of gear pumps. Here, the power-law parameters select of oil A in [25] that is consistency coefficient 0.046, and liquidity index 0.9111. The working fluid is the mixture fluid of air and oil. The reference pressure is 101325 Pa. No slip condition is used in the solid wall.
The time derivative is calculated with a first-order implicit scheme, since this is the only method that the software allows with dynamic mesh [16]. The SIMPLEC algorithm are used for the coupling of velocity with pressure. The gradient is calculated with the Green-Gauss cell based method and the second-order upwind discretization scheme is applied to solve turbulent kinetic energy and turbulent dissipation rate equations. The under-relaxation factors for pressure, momentum, turbulent kinetic energy, and turbulent dissipation rate are 0.2, 0.1, 0.5, and 0.5, respectively. In addition, the minimum residual for all parameters in each time step is 10-6.
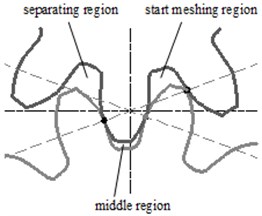
In order to calculate the pressure ripple of trapped volume under different air content, the trapped oil region is divided into three stages: start meshing region, middle region and separating region. That is shown in Fig. 2. Assuming these points , , located in the start meshing region, , , located in the middle region and , , located in the separating region.
Fig. 2Schematic of the trapped volume
4. Numerical results and discussions
In this section, the results obtained from the numerical solution of the flow field within the trapped volume of external gear pump has been presented and the effect of air content dissolved in oil on the pressure ripple of trapped volume has been investigated.
4.1. The pressure ripple of trapped volume
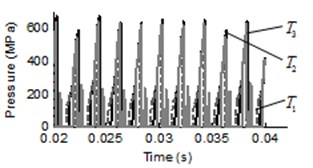
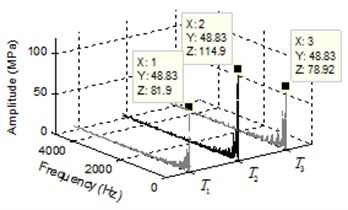
In order to estimate the influence of air dissolved in oil on pressure ripple, the air content value of 8 percent is calculated that is 0.08 in Eq. (1-6). The pressure ripple and pressure frequency of start meshing region shown in Fig. 3. It can be seen from Fig. 3(a) that the points , , have the same pressure fluctuation cycle when the time vary between 0.02 second to 0.04 second. The rotary speed of the rotors is 3000 r/min that means the rotation period of the gear is 0.02 second, the rotational frequency of gear is 50 Hz, and the gear meshing frequency is 500 Hz. The pressure peak appears ten times during a rotation period of gear, it is equivalent to the number of teeth. The pressure fluctuation data in time domain is transformed into frequency spectrum in frequency domain with Fast Fourier Transform (FFT), and the result can be seen in Fig. 3(b). It is obvious from Fig. 3(b) that the dominant frequency of three points are all 48.83 Hz. In theory, the dominant frequency of these points are proportional to the gear meshing frequency, the true value has a certain deviation under influence of bearing rotational frequency and other factors.
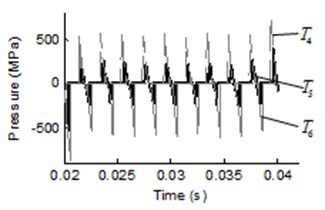
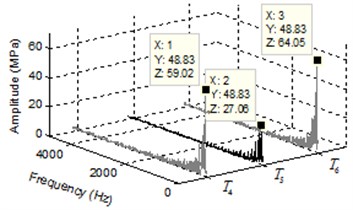
Fig. 4 shows the pressure ripple and spectrum of pressure ripple in middle region of trapped volume in external gear pump. The pressure of positive displacement pump varies with time in a cycle of rotor rotation (0.02 s), as shown in Fig. 4(a), where the start time is 0.02 s. It can be seen that the pressure curves present a symmetric distribution and appear ten times pressure peak in the range of 0.02-0.04 s, where, the plus or minus sign only represents the direction. Considering the discrete points on different position gives insight onto the varying pressure field surrounding the trapped volume. The FFT of the pressure ripple is shown in Fig. 4(b), it is shown that the dominant frequency of three points , and are 48.83 Hz, which is 0.1 times of gear meshing frequency. Where, the amplitude of is smaller than and , because the pressure appear positive and negative values along with the time changes.
Fig. 3a) Pressure transients and b) frequency response of pressure ripple of start meshing region
a)
b)
Fig. 4a) Pressure transients and b) spectrum of pressure ripple of middle region
a)
b)
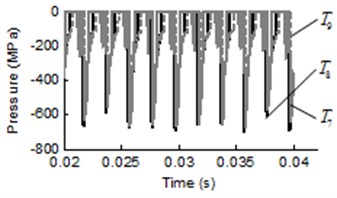
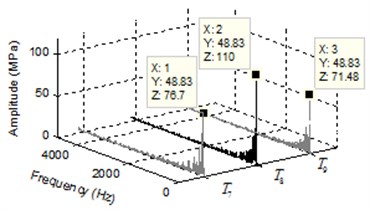
Fig. 5a) Pressure transients and b) spectrum of pressure ripple of separating region
a)
b)
The pressure ripple and spectrum of pressure ripple in separating region of trapped volume are shown in Fig. 5. As evident form Fig. 5(a), the pressure ripple curves of points , and represent sawtooth variation with a cycle time and have the same pressure fluctuation period. The spectrum of pressure ripple in Fig. 5(b) illustrate that the points , and have the same dominant frequency 48.83 Hz. Comparing the Fig. 3(a), Fig. 4(a) and Fig. 5(a), it can be seen that these points in the trapped volume have the same pressure fluctuation period within the rotation period of the gear. From the Fig. 3(b), Fig. 4(b) and Fig. 5(b), the dominant frequency of these points are all 48.83 Hz that is the 1/10 times of gear meshing frequency.
4.2. The pressure ripple in different air content
In order to assess the effect degree of air content on pressure ripple, the author predict the pressure ripple in different air content on the same pump under the same operating conditions. These predictions were compared with experimental measurements in reference [19].
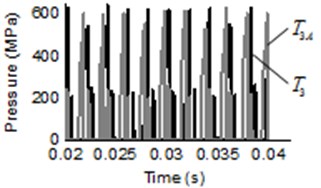
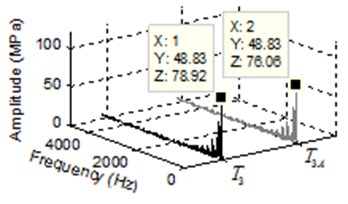
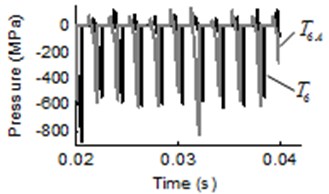
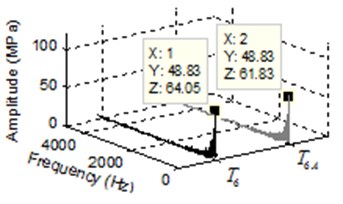
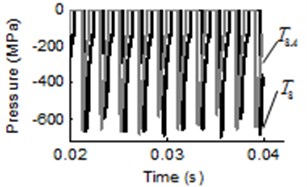
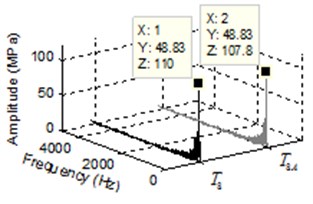
For the air content dissolved in oil and pressure ripple analysis, the pressure ripple and amplitude frequency of trapped volume under different air content are shown in Fig. 6, where the black line represent the pressure ripple with air content value of 8 percent and the gray line represent the pressure ripple with air content value of 10 percent. In Fig. 6, the lines of two cases are represented by different alphabet and . As can be seen from Fig. 6(a), Fig. 6(c) and Fig. 6(e), the pressure ripple at time domain with different air content did not change significantly in start meshing region, middle region and separating region. The FFT of pressure with different air content are illustrated in Fig. 6(b), Fig. 6(d) and Fig. 6(f). It is shown that the dominant frequency of all points are 48.83 Hz, this indicates that the air content has no effect on dominant frequency of trapped volume. The amplitude of pressure ripple with air content value of 10 percent is less than air content value of 8 percent, such as the amplitude of , and , which difference value between the two cases is 2.86 MPa, 2.22 MPa and 2.2 MPa, respectively. The result is in line with the previous studies [19].
Fig. 6Pressure transients and spectrum of pressure ripple in trapped volume under different air content: a), c) and e) are pressure ripple of start meshing region, middle region and separating region, respectively, b), d) and f) are the corresponding spectrum of pressure ripple
a)
b)
c)
d)
e)
f)
5. Conclusions
Results of computational simulations of trapped volume of an external gear pump, taking into account air content effects, have been presented. The mixture model with no slip velocity was used to take into account multiphase flow. Dynamic mesh was modeled through an arbitrary Lagrangian-Eulerian (ALE) formulation with smoothing and local remeshing. A commercial finite-volume code was used to simulate the pressure ripple changes of the non-Newtonian fluid in trapped volume of gear pumps together with the power-law model and the nonlinear RNG - turbulence model.
The pump was simulated at different air content about 8 percent and 10 percent. Whether sampling points were located in start meshing region, middle region or separating region, it’s dominant frequency are all 48.83 Hz. Which is 1/10 times of gear meshing frequency when the rotary speed of the rotors is 3000 r/min. These sampling points have the same pressure fluctuation period, represent sawtooth variation and the number of peaks are equal to the number teeth in a cycle of rotor rotation. For the different air content dissolved in the oil, the pressure ripple at time domain did not change significantly in any position of trapped volume. The amplitude of pressure ripple with air content value of 10 percent is less than air content value of 8 percent, the difference value between the two cases is about 2.5 MPa.
References
-
Mucchi E., Dalpiaz G. Elasto-dynamic analysis of a gear pump – Part III: Experimental validation procedure and model extension to helical gears. Mechanical Systems and Signal Processing, Vol. 50, Issues 51-9, 2015, p. 174-192.
-
Ishii M. Thermo-Fluid Dynamics Theory of Two-Phase Flow. Eyrolles, Paris, 1975.
-
ANSYS Fluent 12.0 Theory Guide. Ansys, Canonsburg, PA, 2009.
-
Medvitz R. B., Kunz R. F., Boger D. V., Lindau J. W., Yocum A. M., Pauley L. L. Performance analysis of cavitating flow in centrifugal pumps using multiphase CFD. Journal of Fluids Engineering, Vol. 124, Issue 2, 2002, p. 377-383.
-
Kunz R. F., Lindau J. W., Billet M. L., Stinebring D. R. Multiphase CFD modeling of developed and supercavitating flows. VKI Special Course on Supercavitating Flows, 2001.
-
Zwart P. J., Gerber A. G., Belamri T. A two-phase flow model for predicting cavitation dynamics. Proceedings of the 5th International Conference on Multiphase Flow, Yokohama, Japan, 2004.
-
Casoli P., Vacca A., Franzoni G., Berta G. L. Modelling of fluid properties in hydraulic positive displacement machines. Simulation Modelling Practice and Theory, Vol. 14, Issue 8, 2006, p. 1059-1072.
-
Kajaste J., Kauranne H., Ellman A., Pietola M. Experimental validation of different models for bulk modulus of hydraulic fluid. The 9th Scandinavian International Conference on Fluid Power, SICFP’05, Linköping, Sweden, 2005.
-
Gholizadeh H., Burton R., Schoenau G. Fluid bulk modulus: comparison of low pressure models. International Journal of Fluid Power, Vol. 13, Issue 1, 2012, p. 7-16.
-
Imagine S. A. HYD Advanced Fluid Properties. Technical Bulletin No. 117, Rev. 7, 2007.
-
Ruan J., Burton R. Bulk modulus of air content oil in a hydraulic cylinder. ASME 2006 International Mechanical Engineering Congress and Exposition, Fluid Power Systems and Technology, 2006, p. 259-269.
-
Yu J. H., Chen Z. N., Lu Y. Z. The variation of oil effective bulk modulus with pressure in hydraulic systems. Journal of Dynamic Systems, Measurement, and Control, Vol. 116, Issue 1, 1994, p. 146-150.
-
Dhar S., Vacca A. A novel CFD – axial motion coupled model for the axial balance of lateral bushings in external gear machines. Simulation Modelling Practice and Theory, Vol. 26, Issue 26, 2012, p. 60-76.
-
Vacca A., Guidetti M. Modelling and experimental validation of external spur gear machines for fluid power applications. Simulation Modelling Practice and Theory, Vol. 19, Issue 9, 2011, p. 2007-2031.
-
Dhar S., Vacca A. A fluid structure interaction – EHD model of the lubricating gaps in external gear machines: formulation and validation. Tribology International, Vol. 62, Issue 6, 2013, p. 79-90.
-
Campo D., Castilla R., Raush G. A., Gamez-Montero P. J., Codina E. Numerical analysis of external gear pumps including cavitation. Journal of Fluids Engineering, Vol. 134, Issue 8, 2012, p. 371-382.
-
Zhou J. J., Vacca A., Casoli P. A novel approach for predicting the operation of external gear pumps under cavitating conditions. Simulation Modelling Practice and Theory, Vol. 45, Issue 6, 2014, p. 35-49.
-
Singhal A. K., Athavale M. M., Li H. Y., Jiang Y. Mathematical basis and validation of the full cavitation model. Journal of Fluids Engineering, Vol. 124, Issue 3, 2002, p. 617-624.
-
Eaton M., Keogh P. S., Edge K. A. The modelling, prediction, and experimental evaluation of gear pump meshing pressures with particular reference to aero-engine fuel pumps. Proceedings of the Institution of Mechanical Engineers, Part I Journal of Systems and Control Engineering, Vol. 220, Issue 5, 2006, p. 365-379.
-
Manninen M., Taivassalo V., Kallio S. On The Mixture Model for Multiphase Flow. VTT Publications, Technical Research Center of Finland, Finland, Vol. 288, 1996, p. 67.
-
Ren B., Li C., Yan X., Lin M. C., Bonet J., Hu S. H. Multiple-fluid SPH simulation using a mixture model. ACM Transactions on Graphics, Vol. 33, Issue 5, 2014, p. 1-11.
-
Yakhot V., Orszag S. A., Thangam S., Gatski T. B., Speziale C. G. Development of turbulence models for shear flows by a double expansion technique. Physics of Fluids a Fluid Dynamics, Vol. 4, Issue 7, 1992, p. 1510-1520.
-
Launder B., Spalding D. Lectures in Mathematical Models of Turbulence. Academic Press, England, 1972.
-
Wada S., Hayashi H. Hydrodynamic lubrication of journal bearings by pseudo-plastic lubricants. Part I: theoretical studies. Bulletin of the Japan Society of Mechanical Engineers, Vol. 14, Issue 69, 1971, p. 279-286.
-
Gecim B. A. Non-Newtonian effects of multigrade oils on journal bearing performance. Tribology Transactions, Vol. 33, Issue 3, 1990, p. 384-394.
-
Ng E. Y., Siauw W. L., Goh W. E. Numerical study of unsteady stenosis flow: parametric evaluation of power-law model. Journal of Medical Engineering and Technology, Vol. 24, Issue 5, 2000, p. 203-209.
