Abstract
Vertical axis wind turbines (VAWTs) are used to convert wind energy to mechanical output or electricity. Vertical axis wind turbines are favorable at buildings as it can receive wind from any direction, have a design that can be integrated simply with building architecture and they have better response in turbulent wind flow which is common in urban areas. Using a calculation code based on the Double Multiple Stream Tube theory, symmetrical straight-bladed NACA0012 wind turbine performance was evaluated. The induction factor for both upwind and downwind zone is determined with the aid of a root-finding algorithm. This numerical analysis highlighted how turbine performance is strongly influenced by the wind speed (Reynolds number) and rotor solidity (turbine radius and blade chord length). Also a dimensional analysis is introduced and is to be considered in such a way to generalize the design for different turbine specifications. One of the qualities provided by dimensional analysis is that geometrically similar turbines will produce the same non-dimensional results. This allows one to make comparison between different sizes wind turbines in terms of power output and other related variables. One of the main problems affecting the turbine performance and dynamics is the torque ripple phenomena. So in this paper a turbine design configuration is introduced in order to decrease the turbine torque fluctuation. This design is carried out by constructing more similar turbine units (stages) on the vertical axis on top of each other with different orientation phase angles. The results showed that using even number of turbine assembly is better than odd number to avoid torque fluctuation and mechanical vibrations acting on the turbine. Also it is preferred to use four turbine stages as the eight stages will have no sensible effect on decreasing the torque fluctuation.
1. Introduction
Paraschivoiu et al. [1] presented an optimal computation of blade’s pitch angle of an H-D Darrieus wind turbine to obtain maximum torque with some results presented using a 7 kW prototype. In order to determine the performance of the straight bladed vertical axis wind turbine a genetic algorithm optimizer is applied in addition to an improved version of “Double Multiple stream tube” model. Where in this model a partition of the rotor is considered in the stream tubes and treats each of the two blade elements defined by a given stream tube as an actuator disk. Dominy et al. [2] in their presentation of vertical axis wind turbines explained the potential advantages of using Darrieus type wind turbines in the small scale and domestic applications where the cost and reliability are very important points in addition to the simplicity of design structure, generator and control system. Their concern was about the ability of the Darrieus turbines to be self-started. Olson and Visser [3] showed the availability of using Darrieus turbines in commercial grid connected utility scale operations. They also mentioned the development of marketing small scale wind turbines due to the social “going green” phenomena and to its economic stand point. Batista et al. [4] mentioned the great interest in the vertical axis wind turbine due to the rapid increase in its power generation, and the need for a smarter electrical grid with a decentralized energy generation, especially in the urban areas. However, estimation of the performance of Darrieus type VAWT is very tough, as the blades rotate in the three-dimensional space around the rotor which results in several flow phenomena such as dynamic stall, flow separation, wake flow and natural incapability to self-starting. Klimas [5] described Darrieus turbines as relatively simple machines. The turbines have a fixed blade geometry, usually two or three blades rotating about a vertical axis generating power to a ground mounted power conversion or absorption machinery, with neither yaw control nor power regulation. Nila et al. [6] dealt with the calculations of a fixed-pitch straight-bladed vertical axis wind turbine of the ‘Darrieus Type’. They made a case study using a well-known NACA0012 turbine blade profile where the wind load calculations were achieved by assuming solid frontal areas of the blades and tower construction. They also assumed that each section of a blade behaves as an airfoil in a two-dimensional flow field. Lobitz [7] showed the importance of the dynamic response characteristics of the VAWT rotor and its influence in the safety and fatigue life of VAWT systems. He also mentioned that the problem is to predict the critical speed at resonance and the forced vibration response amplitude. Sabaeifard et.al [8] discussed the potential of using VAWT for buildings. They explained the aerodynamics and the performance of small scale Darrieus type straight-bladed VAWT through a computational and an experimental study. Alexandru et al. [9] developed a different approach for enhancing the performance of vertical axis wind turbines for the use in the urban or rural environment and remote isolated residential areas. Abhishiktha et al. [10] presented a review of on different types of small scale horizontal axis and vertical axis wind turbines. The performance, blade design, control and manufacturing of horizontal axis wind turbines were reviewed. Vertical axis wind turbines were categorized based on experimental and numerical studies. Magedi and Norzelawati [11] studied a comparison between the horizontal axis wind turbines (HAWTS), and the vertical axis wind turbines (VAWTS). The two types of wind turbines were used for different purposes. Several models of both types were presented from previous research. Baker [12] investigated the most important factors for cost-effective SB-VAWT such as appropriate airfoil to achieve desired aerodynamic performance and to optimize the overall dimensions of the SB-VAWT. In his research a detailed performance analysis on a series of low Reynolds number airfoils was selected to enhance the performance of smaller capacity fixed-pitch SB-VAWT. Haroub et al. [13] designed a three bladed vertical axis wind turbine with a target. The material used was Glass fiber reinforced plastics (GFRP). The study focused on Blade design where a numerical optimization process was done to come up with parameters for the rotor blades. The power coefficient was tested using a wind fan with wind speeds ranging from 4 m/s to 15 m/s. Paul et al. [14] introduced in their work the importance of choosing the airfoil blade shape and its effect on improving the aerodynamic performance for a Darrieus wind turbine blade. The analysis was made under some specifications as using two bladed machines with an infinite aspect ratio, rotor solidity and operating at Reynolds number nearly of three million. Frank et al. [15] studied the aerodynamic performance and wake dynamics of a Darrieus-type vertical-axis wind turbine consisting of two straight blades which was simulated using Brown’s vortices transport model. The predicted variation with azimuth angle of the normal and tangential forces on the turbine blades compared well with experimental measurements. The interaction between the blades and the vortices that are shed and trailed in previous revolutions of the turbine was shown to have a significant effect on the distribution of aerodynamic loading on the blades. Tanja et al. [16] demonstrated that the higher quantity of extreme events in atmospheric wind fields transfers to alternating loads on the airfoil and on the main shaft in the form of torque fluctuations. Their analysis was performed on three different wind field data sets: measured fields, data generated by a standard wind field model and data generated by an alternative model based on continuous time random walks, which grasps the intermittent structure of atmospheric turbulence in a better way.
The objectives of the present study are to make a detailed analysis, which explains the parameters affecting the turbine outputs as a function of the azimuth angle and its effect on the turbine performance. Also to introduce a dimensional analysis, that allows making a comparison between different sizes wind turbines in terms of power output and other related variables. Finally, to introduce a design of multi stage vertical axis wind turbine to decrease turbine torque ripple phenomena and avoid the mechanical vibrations acting on the turbine.
2. Theoretical analysis
In this section the simulation model is assumed to be the Double Multiple Stream Tube (DMST) Model. This model is a combination of the MST model and double actuator theory [17], where the turbine is modeled separately for the upstream half and the downstream half. Also an assumption is made that the wake from the upwind pass is fully expanded and the ultimate wake velocity has been reached before the interaction with the blades in the downwind pass.
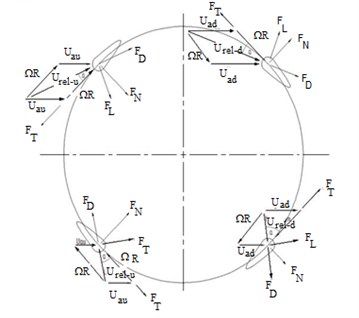
Fig. 1 presents the DMST model diagram. Each airfoil in this model intersects each stream tube twice, one on the upwind pass and the other on the downwind pass. The DMST model solves two equations simultaneously for the stream-wise force at the actuator disk; one obtained by conservation of momentum and other based on the aerodynamic coefficients of the airfoil (Lift and Drag) and the local wind velocity. These equations are solved twice, one for the upwind part and the other for the downwind part. Fig. 2 shows the forces and velocities triangles acting on the turbine un-pitched blade.
Fig. 1Plan view of a double-multiple-stream tube analysis of the flow through a VAWT rotor
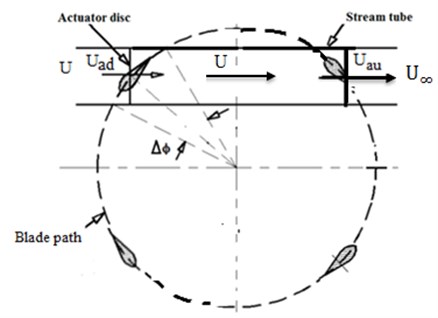
Fig. 2Forces and velocity triangle
2.1. Upwind un-pitched blade analysis
The velocity components on an upwind blade section are illustrated in Fig. 3 and the ratio between relative velocity at upstream and free stream velocity is:
where λ is the tip speed ratio and is represented by λ=ΩR/U.
The local angle of attack is represented by:
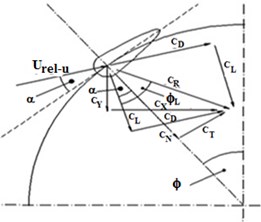
The angle of attack α and Δ∅ play a substantial rule in the force coefficients direction and its magnitude. Fig. 4 shows the force coefficients analysis diagram, on an upwind blade section. The force coefficients depend on the value of angle of attack less or greater than 90°.
Fig. 3Velocity components acting on an upwind blade element
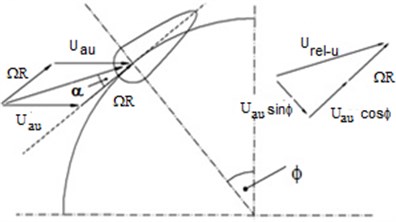
Fig. 4Forces analysis diagram for an upwind blade element
2.1.1. Case when the angle of attack is less than 90 degrees
In this case the normal force coefficient is represented by:
While the tangential force coefficient is:
The force coefficients in x and y directions can be expressed as:
Thrust force coefficient is:
2.1.2. Case when the angle of attack is greater than 90 degrees
In this case the normal and tangential force coefficients are represented by:
While the force coefficients in x and y directions can be expressed as:
Thrust force coefficient is:
For any value of angle of attack the following relations can be applied.
The average aerodynamic thrust can be expressed by a non-dimensional thrust coefficient as the following:
The instantaneous torque on a single airfoil at certain position can be expressed by:
The average torque on the rotor by number of blades N in one complete revolution is given by:
The torque coefficient is represented by the relation between average torque and aerodynamic torque and can be expressed as:
The Power coefficient is represented by the ratio of power that the turbine can extract from wind energy and is expressed as:
2.2. Downwind un-pitched blade analysis
The velocity components for the downwind part can be demonstrated by Fig. 5. Also the force coefficients analysis diagram, on a downwind blade section is illustrated by Fig. 6.
The ratio between relative velocity at upstream and free stream velocity is:
The angle of attack is:
Fig. 5Velocity components acting on a downwind blade element
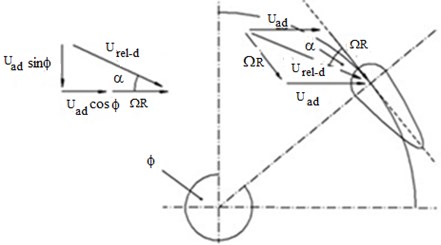
Fig. 6Force analysis diagram of a downwind blade element
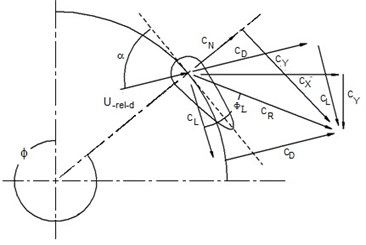
2.2.1. The angle of attack is below 90 degrees
In this case the normal and tangential force coefficients are represented by:
While the force coefficients in x and y directions can be expressed as:
Thrust force coefficient is:
2.2.2. The angle of attack is greater than 90 degrees
The normal and tangential force coefficients is represented by:
The force coefficients in x and y directions can be expressed as:
Thrust force coefficient is:
For any value of angle of attack the following relations can be applied.
The average aerodynamic thrust can be expressed by a non-dimensional thrust coefficient as follows:
where Ue=U(1-2au) and the instantaneous torque is determined by:
While average torque is:
The torque coefficient is represented by:
The Power coefficient can be expressed as:
3. Computational procedure
The computational procedure for a given rotor geometry and rotational speed are done through several steps as the following.
– Making an initial guess for the axial induction factor equals to zero.
– The angle of attack and relative wind velocity acting on a blade are determined.
– The local blade section Reynolds number is determined since it can be expressed as:
– Using the local blade section Reynolds number and the local angle of attack, the blade section lift and drag coefficients are obtained through known experimental data of Sheldal and Klimas [18]. The selection of these coefficients through the mentioned parameters is made with the aid of a “MATLAB” tooling box called “SFTOOL”.
– The normal and tangential force coefficients are calculated and finally the thrust coefficient derived from aerodynamic forces per stream tube and from the actuator disk theory [17] is obtained.
– Comparing both thrust coefficients obtained from both theories. If the thrust coefficients are found the same, then the convergence is achieved. If not, then the axial induction factor is changed and the same steps are followed until the convergence is achieved.
– As the convergence is achieved per stream tube, the required values of the relative velocity, angle of attack, torque and power are then calculated. Convergence is with a relative error less than 10-2. The mentioned procedures are adopted for the up-wind and downwind half cycle. The induction factor is calculated twice for all stream tubes, one for the upwind half stream au and the other for the downwind half stream ad.
4. Dimensional analysis
Wind turbines come in different sizes and they experience a wide range of variables when in operation. These variables complicate the process of comparison of different sizes of turbines in terms of their performance. The general geometric features of H-rotors are rotor radius R, blade height H, number of blades N, chord length C and airfoil shape. These features are all determinants to the aerodynamic performance of the rotor. The environmental conditions include wind velocity U viscosity μ, air density ρ and also the rotational speed of the H-rotor Ω. Usually, the performance of an H-rotor is evaluated by the power coefficient defined as the ratio of the power that the turbine can extract from the wind energy. To deal with this, the help of dimensional analysis is required. One of the advantages of the dimensional analysis is that geometrically similar turbines will produce the same non-dimensional results. This allows one to make comparison between different sizes of wind turbines in terms of power output and other related variables. Based on the determinants of the rotor performance, the power coefficient Cp can be expressed as a function of rotational speed, free stream wind velocity, rotor radius, blade length, number of blades; chord length, air viscosity and air density. There are nine parameters relevant to the power of wind turbine.
The power of turbine can simply be expressed as:
According to Buckingham Pi-theorem, the functional relationship of the dimensionless groups may be obtained and the result may be written as:
The solution may be correct but expressed in terms of some Pi-groups which have no recognizable physical significance. It may then be necessary to combine the pi-groups to obtain new groups which have significance. A solidity term, free stream Reynolds number, power coefficient and tip speed ratio can be expressed as:
By considering the new Pi-groups as mentioned above, the power coefficient CP can be expressed as a function of tip speed ratio λ, free stream Reynolds number Re and solidity σ:
5. Results and discussion
The presentation and discussion of the results obtained from the theoretical work are to be divided into three main parts. The first part is concerned with the detailed analysis, which includes the parameters affecting the turbine outputs as function of the azimuth angle and its effect on the turbine performance. The second part deals with the design charts resulting from dimensional analysis which can be used for any proposed VAWT design under specific limitations. The third part is how to decrease the turbine torque fluctuations and in order to decrease the wind turbine vibrations.
5.1. Effect of wind speed on the power coefficient
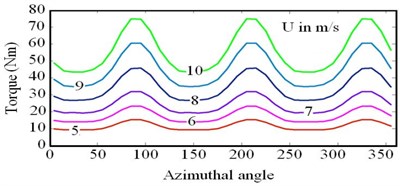
In this section the effect of different wind speeds (5, 6, 7, 8, 9, 10 m/s) on the average power coefficient Cp, are discussed for a turbine of 0.2 m chord length, three blades, 1 m blade height, blade profile NACA0012 and 2 m turbine radius as shown in Fig. 7. Some features can be drawn from this figure; firstly, it can be seen that, by increasing the wind speed the maximum average power coefficient increases. This takes place since; by increasing the wind speed the torque extracted by the turbine increases leading to a higher power coefficient such as shown in Fig. 8. The second feature, which is required to be pointed out, is the relationship between tip speed ratio λ and the power coefficientCp. At low λ (below 3.5) Cp is mainly negative while at larger values of λ (above 3.5) is positive. In order to explain this relation, the turbine characteristics such as, torque, angle of attack, normal and tangential force coefficients and relative velocity acting on the blade are required to be examined. The third feature comes in the region where the higher values of tip speed ratio takes place shows that, when the tip speed ratio increases beyond the design condition 4.5 (Maximum Cp), the power coefficient decreases while the turbine performance approximate the same as the tip speed ratio changes from 5.5 to 6. This is due to the decrease in the mean torque.
Fig. 7Tip speed ratio and power coefficient relationship for different inlet wind speed
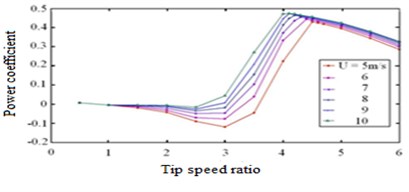
Fig. 8Torque versus Azimuth angle for different inlet wind speeds at maximum Cp
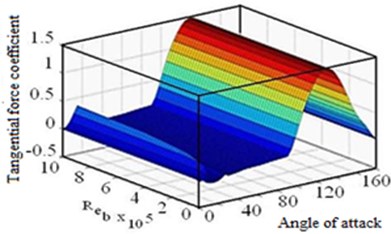
The tangential force coefficient and the blade relative velocity are the main parameters affecting the mean torque value. This coefficient is a function of the lift and drag forces coefficients which depend on the angle of attack and blade Reynolds number and can be obtained from experimental data according to Sheldal and Klimas [18]. The relation between tangential force coefficients, angle of attack and blade Reynolds number is shown in Fig. 9. It can be seen also from the figure that, for all blade Reynolds number as α increases to be greater than 45° the tangential force coefficient always attains positive values especially in the region above 90°, while for α in the range of 25° to 45° the tangential force coefficient is mainly negative. On the other hand for α below 25° the tangential force coefficient sign depends on the blade Reynolds number specially at low blade Reynolds number (below 4×10⁶).
Fig. 9Relation between angle of attack, blade Reynolds number and tangential force coefficient
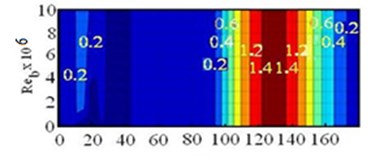
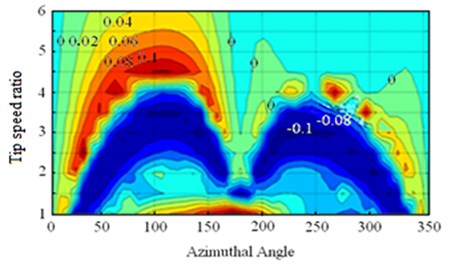
So according to the case U= 5m/s, Figs. 10 ,11 and 12 give a relationship between the blade’s angle of attack, Reynolds number and tangential force coefficient with respect to the azimuth angle at different tip speed ratios respectively. It can be concluded from these figures that, as both angle of attack and blade Reynolds number changes during the whole rotation, the tangential force coefficient also changes.
Fig. 10Angle of attack and azimuth angle relationship
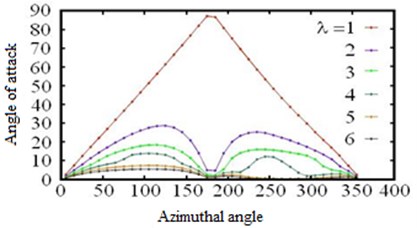
Fig. 11Blades Reynolds number and azimuth angle relationship
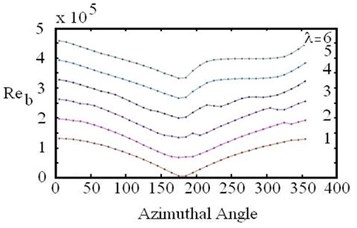
Fig. 12Tangential force coefficient and azimuth angle relationship
5.2. Effect of turbine geometry on the power coefficient
The main turbine geometrical parameters affecting the turbine output are the blade chord length, blade height, along with turbine radius. The effect of each parameter on the power coefficient is to be considered while maintaining the turbine swept area constant and equal to 16 m2. The effects are to be examined for a three bladed turbine and for an airfoil shape NACA0012. In this section the effect of different chord lengths on the power coefficient is presented for a turbine of 2 m blade height, 4 m turbine radius, inlet velocity of 5 m/s. Fig. 13, shows that when the chord length increases the maximum average power coefficient increases.
Fig. 13Effect of turbine chord length on the average power coefficient for different tip speed ratio
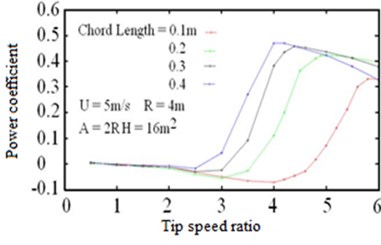
Fig. 14Effect turbine radius on the relation between the average power coefficient and the tip speed ratio λ
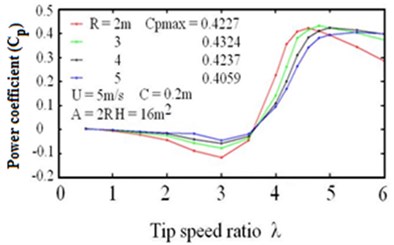
Also by increasing the chord length the negative average power coefficient at low tip speed ratio starts to decrease. The effect of different turbine radii on the average power coefficient is considered for an inlet velocity of 5 m/s, chord length of 0.2 m and swept area of 16 m2 and is shown in Fig. 14.
It can be seen from this figure that, as the rotor radius decreases the maximum power coefficient increases. Also it is to be noticed that at low values of tip speed ratio increasing the rotor radius leads to a lower negative power coefficients.
5.3. Validation the results of DMST model
The DMST model developed in this work was checked against the vertical axis wind turbine using CFD model which was introduced by Biadgo et al. [19]. The computer program used in this work is fitted by the same data used in [19], since the normal NACA0012 airfoil was set to 0.2 m chord length and the turbine radius was set 2 m. The height of turbine is taken to be 4 m with 3 blades. The wind speed used is 5 m/s and tip speed ratios are 0.25, 0.5, 1, 2, 3, 4, 5, 6, and 7, the total number of stream tubes is 12 with ΔΦ= 15°.The computational proceeding was applied to DMST model and the first aspect of the model validation is the comparison of the predicted VAWT power coefficient (Cp) for different tip speed ratio λ as shown in Fig. 15. In this figure the relation between power coefficient and tip speed ratio is graphed for the DMST model introduced by the present work and the results obtained by [19] for both DMST and CFD model.
As can be seen, both CFD and DMST model Cp curves show that the turbine generates negative and/or minimum torque for lower tip speed ratio which implies inability of NACA0012 to be self-starting. The DMST model underestimates the Cp value at lower tip speed ratios but it predicts higher Cp value which is 0.41 at a tip speed ratio of around (4-4.5). Also Fig. 15 is in agreement with Habtamu [20] and Louis et al [21] and also agreement with Franklyn, Isam [22, 23].
The second aspect of validation as shown in Fig. 16 is the comparison of torque with azimuthal angle for DMST model of the present work and CFD model introduced by [19]. In this figure TSR is taken to be 1 and the difference between two models is clear since CFD model gives a positive variation of torque at TSR=1 because the power coefficient is positive but when DMST model is applied a negative variation of torque appears since the value of Cp is also negative.
Fig. 15Power coefficient result for DMST and CFD
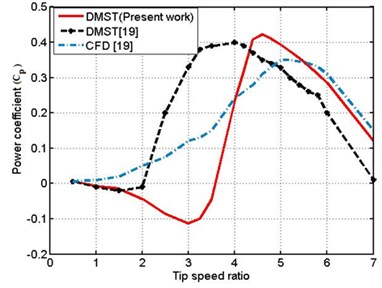
Fig. 16Torque – azimuthal angle relationship for DMST model and CFD model [19]
![Torque – azimuthal angle relationship for DMST model and CFD model [19]](https://static-01.extrica.com/articles/17027/17027-img17.jpg)
6. Dimensional analysis results
The results presented in the previous sections are only applicable for turbine characteristic considered in each section. A dimensional analysis is required and is to be considered to generalize the design for different turbine specifications.
Fig. 17Relationship between free stream, Reynolds number, tip speed ratio and power coefficient at different Rotor Solidities
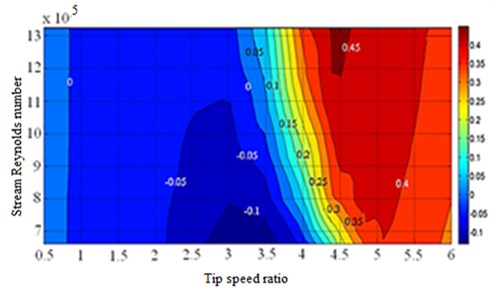
a) Rotor solidity σ=0
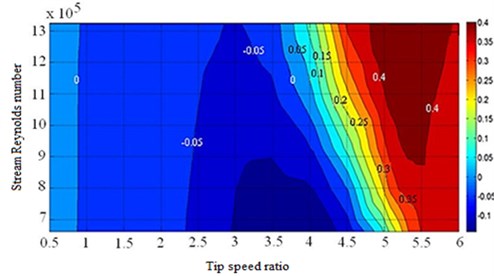
b) Rotor solidity σ=0.225
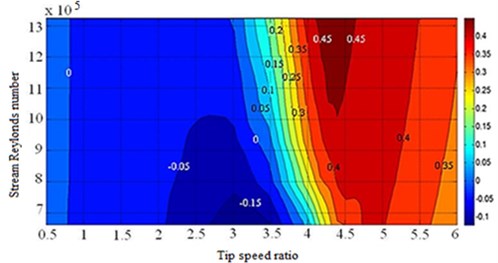
c) Rotor solidity σ=0.2625
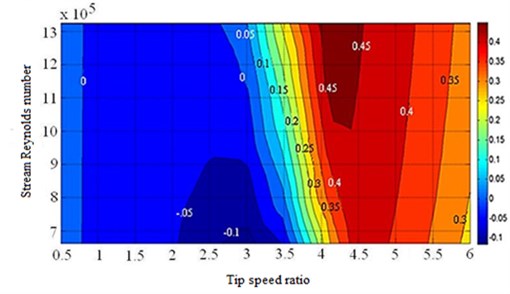
d) Rotor solidity σ=0.3
One of the qualities of dimensional analysis is that geometrically similar turbines will produce the same non-dimensional results. This allows one to make comparison between different sizes of wind turbines in terms of power output and other related variables. Based on the study of the dimensional analysis mentioned before, the power coefficient Cp can be expressed as a function of tip speed ratio λ, free stream Reynolds number Re and solidity σ. From this relation design charts such as that shown in Fig. 17 can be considered showing the relation between Power coefficient CP, free stream Reynolds number Re and Tip speed ratios λ at specific Rotor solidity σ.
7. Turbine fluctuations
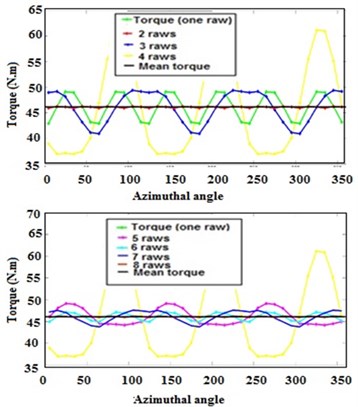
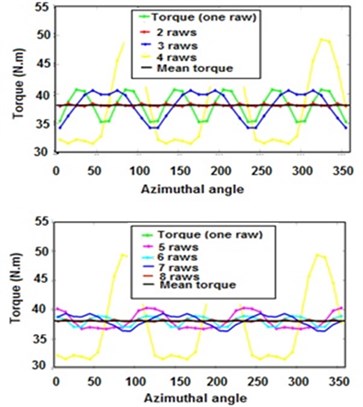
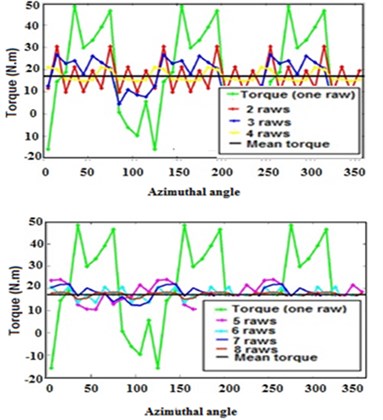
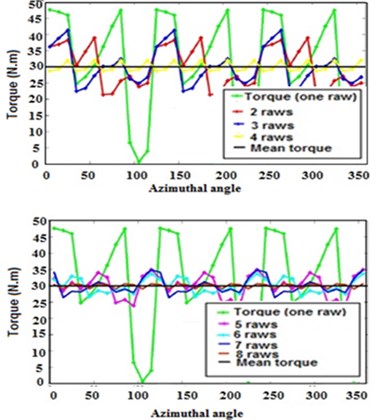
This section focuses on how to decrease the turbine torque fluctuations during its rotation. Decreasing these fluctuations means how to keep the output torque constant which is very important to avoid vibrations of turbine rotor. Avoiding the vibrations allows safe use of full power output from the turbine. This can be achieved by constructing a new turbine assembly, where more similar turbine units are mounted on the vertical axis on top of each other with different phase angles as shown in Figs. 18 and 19.
Fig. 18Single row VAWT assembly
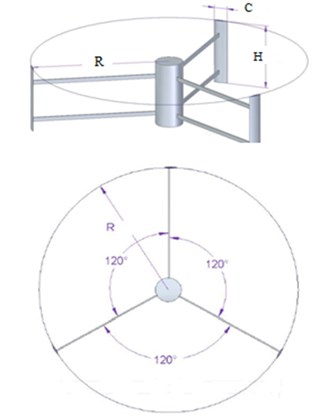
Fig. 19Two rows VAWT assembly with phase angle Ø12
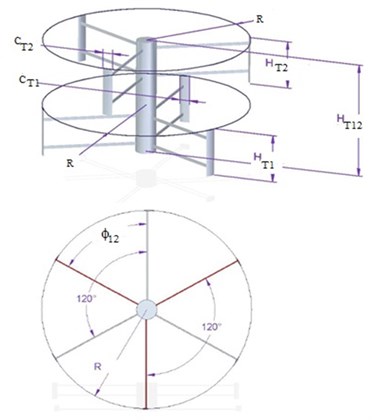
In Fig. 19 HT1 is the blade height for stage 1, HT2 is the blade height for stage 2, CT1 is the cord length of blade for stage 1,
CT2 is the cord length of blade for stage 2, HT12 is the total height between stage 1 and 2, Φ12 is the phase angle between stage 1 and 2. This assembly will decrease the total turbine torque fluctuation taking into account the following conditions:
– The inlet flow to all turbines is the same and is uniform.
– All turbines have the same geometric conditions such as chord length C, blade height H, number of blades N, rotor radius R and airfoil shape.
– An assumption is considered that each turbine stage has no effect on the neighboring stage.
The torque of the first stage of the turbine is determined as mentioned before, and then the second similar turbine is added with a phase angle changing from 10° to 120° degree with a phase step of 10°. The phase angle is measured from the reference (1st turbine 1st blade position). In each phase angle step the total torque of the two turbines and the percentage torque fluctuation are calculated as given below:
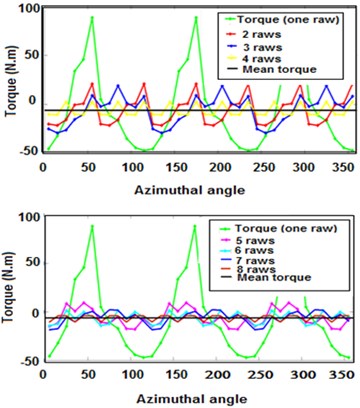
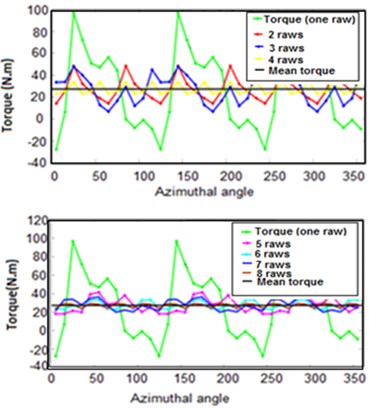
where Q is the total torque, QT1 is the torque of turbine 1, QT2 is the torque of turbine 2, QMax, QMin, QMean are the maximum, minimum and mean values of total torque, Qfr is the percentage torque fluctuation of the set of two turbine assembly at each phase angle. Finally, the phase angle is chosen corresponding to the minimum percentage of torque fluctuation, considering the two turbine stages as a single set. The turbines to follow are added in the same manner to the previous group and the same steps are applied as mentioned above. For an inlet velocity U=5 m/s and swept area A=16 m2 Figs. 20 and 21 show the relation between torque and azimuth angle for different turbine configurations at different tip speed ratios λ and for two values of rotor solidities σ namely 0.3 and 0.15 respectively.
Fig. 20Relation between Torque and Azimuth angle at different λ and for Rotor Solidity = 0.3 per each turbine
a)λ=3.5
b)λ=4
c)λ=4.5
d)λ=5
Fig. 21Relation between Torque and Azimuth angle at different λ and for Rotor Solidity = 0.15 per each turbine
a)λ=5.1
b)λ=5.4
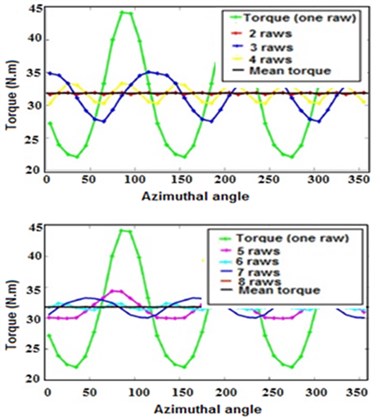
c)λ=5.7
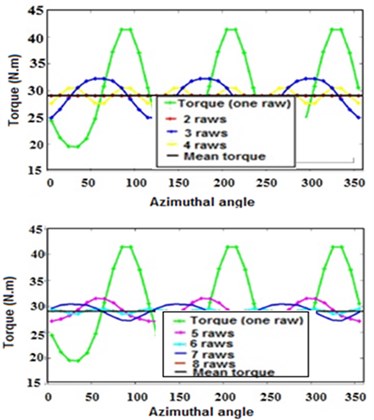
d)λ=6
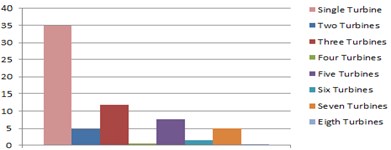
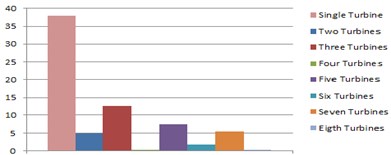
Figs. 22 and 23 show the torque fluctuation percentage for different turbine configurations and at different tip speed ratio and solidity of 0.3 and 0.15 respectively. From these figures it can be concluded that, as the turbine torque fluctuation increases the more turbine assemblies are needed to decrease this fluctuation. Also it is preferable to use an even number of turbine assembly for constructing the wind turbine since using odd number of turbine assembly causes high percentage of torque fluctuation. In addition, the even number of turbine configuration has many advantages. Firstly, at any blade position the turbine output torque is mostly close to the mean torque. This gives better turbine dynamics such as low vibrations level and fatigue conditions. Secondly the methodology of calculating the power coefficient becomes more realistic. In the calculation of the power coefficient mentioned previously, it was assumed that the tip speed ratio is constant throughout all stream tubes and the average torque per revolution was therefore used. However, in reality the tip speed ratio varies per revolution with the variation of the turbine’s rotational speed. The power coefficient will consequently depend mainly on the instantaneous torque and tip speed ratio, leading to different values of Cp. According to the suggested new turbine configuration, this problem is solved because both average torque and instantaneous torque are nearly the same at any blade position giving the same power coefficient Cp. Also Figs. 22 and 23 shows that, at a tip speed ratio corresponding to a maximum power average coefficient, it is preferred to use four turbine stages as the eight stages will have no sensible effect on decreasing the turbine torque fluctuation and this is suitable for minimizing the design cost of the turbine.
Fig. 22Torque fluctuation percentage at different λ and for Rotor Solidity = 0.3
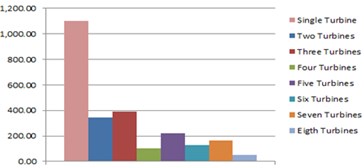
a)λ=3.5
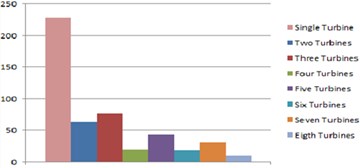
b)λ=4
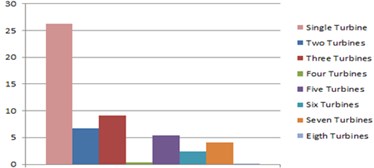
c)λ=4.5
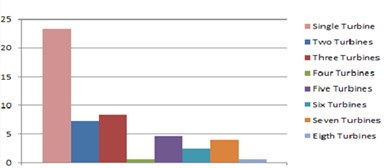
d)λ=5
Fig. 23Torque fluctuation percentage at different λ and for Rotor Solidity = 0.15
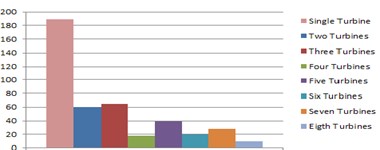
a)λ=5.1
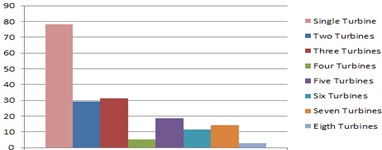
b)λ=5.4
c)λ=5.7
d)λ=6
8. Conclusions
In this paper, analytical investigation of performance of symmetrical straight- bladed VAWT is done using NACA0012 as a blade profile. The analytical investigation is done using DMST model. A detailed analysis, which explains the parameters affecting the turbine outputs as a function of the azimuth angle and its effect on the turbine performance is studied. Also a dimensional analysis is applied which allows to make a comparison between different sizes wind turbines in terms of power output and other related variables. The power coefficient obtained from DMST model is compared by that obtained from CFD model introduced before by another investigator. Finally, a design of multi stages vertical axis wind turbine is introduced to decrease turbine torque ripple phenomena and avoid the mechanical vibrations acting on the turbine.
From the present work the following conclusions are drawn:
– As the wind speed increases from (5-10) m/s the maximum average power coefficient increases.
– As the wind speed changes from (5-10) m/s the tip speed ratio corresponding to the maximum average power coefficient decreases.
– The power coefficient is a function of three main parameters namely the free stream Reynolds number, tip speed ratio and rotor solidity.
– The higher the rotor solidity the higher the maximum average power coefficient with a decrease in the negative power coefficient at low tip speed ratio.
– As the tip speed ratio increases and reaches to the maximum average power coefficient the torque fluctuation reaches nearly a sinusoidal wave form.
– The DMST model predict a negative value of power coefficient at lower tip speed ratio which implies that NACA0012 is not self-starting.
– The DMST model predict higher power coefficient value which is 0.41 at tip speed ratio of around (4-4.5)
– Even number of turbine stages leads to a lower turbine torque fluctuation compared to an odd number of stages.
– Doubling multiple of even number of turbine stages leads to a lower turbine torque fluctuation.
– At a tip speed ratio corresponding to a maximum power average coefficient it is preferred to use four turbine stages as the eight stages will have no sensible effect on decreasing the turbine torque fluctuation and this is suitable for minimizing the design cost of the turbine.
References
-
Paraschivoiu I., Trifu O., Saeed F. H-Darrieus wind turbine with blade pitch control. International Journal of Rotating Machinery, Vol. 2009, 2009, p. 505343.
-
Dominy R., Lunt P., Bickerdyke A., Dominy J. Self-starting capability of a Darrieus turbine. Proceedings of the I MECH E Part A: Journal of Power and Energy, Vol. 221, 2007, p. 111-120.
-
Olson D., Visser K. Self-Starting Contra-Rotating Vertical Axis Wind Turbine for Home Heating Applications. Department of Mechanical and Aeronautical Engineering, 2009.
-
Batista N. C., Melício R., Matias J. C. O., Catalão J. P. S. Self-start performance evaluation in Darrieus-type vertical axis wind turbines: methodology and computational tool applied to symmetrical airfoils. Proceedings of ICREPQ, Gran Canaria, Spain, 2011.
-
Klimas P. C. Darrieus rotor aerodynamics. Journal of Solar Energy Engineering, Vol. 104, Issue 2, 1982, p. 102-105.
-
Nila I., Bogateno R., Stere M. Small power wind turbine (type Darrieus). Journal INCAS Bulletin, Vol. 4, Issue 1, 2012, p. 135-142.
-
Lobitz D. W. Dynamic Analysis of Darrieus Vertical Axis Wind Turbine Rotors. Sandia National Laboratories, Applied Mechanics Division, Albuquerque, New Mexico, 1981.
-
Sabaeifard P., Razzaghi H., Forouzandeh A. Determination of vertical axis wind turbines optimal configuration through CFD simulations. International Conference on Future Environment and Energy, Singapore, Vol. 28, 2012, p. 109-112.
-
Alexandru M. C., Alexandro B., Ionut C. O., Florin F. New urban vertical axis wind turbine design. Incas Bulletin, Vol. 7, Issue 4, 2015, p. 67-76.
-
Abhishiktha T., Ratna K. V., Dipankur K. S., Indrajac V., Krishna V. Hari A Review on small scale wind turbines. Renewable and Sustainable Energy Reviews, Elsevier, Vol. 56, 2016, p. 1351-1371.
-
Magedi M. S., Norzelawati A. Comparison of horizontal axis wind turbines and vertical axis wind turbines. IOSR Journal of Engineering, Vol. 4, Issue 8, 2014, p. 27-30.
-
Baker J. Features to aid or enable self-starting of fixed pitch low solidity vertical axis wind turbines. Journal of Wind Engineering and Industrial Aerodynamics, Vol. 15, 1983, p. 369-380.
-
Haroub A. H., Francis X. O., Kamau Joseph N. Development of a low cost rotor blade for a H-Darrieus wind turbine. Journal of Sustainable Research in Engineering, Vol. 2, Issue 3, 2015, p. 92-99.
-
Migliore Paul G., Fritschen John R., Mitchell Richard L. Darrieus Wind Turbine Airfoil Configurations. Subcontract Report No. AE-1-1045-1, Solar Energy Research Institute, Colorado, 1982.
-
Scheurich Frank, Fletcher Timothy M., Brown Richard E. Simulating the aerodynamic performance and wake dynamics of a vertical-axis wind turbine. Wind Energy, Vol. 14, Issue 2, 2011, p. 159-177.
-
Mücke Tanja, Kleinhans David, Peinke Joachim Atmospheric turbulence and its influence on the alternating loads on wind turbines. Wind Energy, Vol. 14, 2011, p. 301-316.
-
Manwell J. F., Mcgowan J. G., Rogers A. L. Wind Energy Explained: Theory Design and Application. Second Edition. John Wiley and Sons, 2009.
-
Sheldal R. E., Klimas P. C. Aerodynamic Characteristics of Seven Airfoil Sections through 180 Degrees Angle of Attack for Use in Aerodynamic Analysis of Vertical Axis Wind Turbines. Sandia National Laboratories, Albuquerque, 1981.
-
Biadgo Asress Mulugeta, Simonovic Aleksandar, Komarov Dragan, Stupar Slobodan Numerical and analytical investigation of vertical axis wind turbine. FME Transactions, Vol. 41, Issue 1, 2013, p. 49-58.
-
Beri Habtamu, Yao Yingxue Double multiple stream tube model and numerical analysis of vertical axis wind turbine. Energy and Power Engineering, Vol. 3, 2011, p. 262-270.
-
Danao Louis Angelo, Edwards Jonathan, Eboibi Okeoghene, Howel Robert The performance of a vertical axis wind turbine in fluctuating wind – a numerical study. Proceedings of the World Congress on Engineering, London, UK, Vol. 3, 2013.
-
Kanyako Franklyn, Janajreh Isam Vertical axis wind turbine performance prediction for low wind speed environment. Innovations in Technology Conference (InnoTek), 2014, p. 1-10.
-
Kanyako Franklyn, Janajreh Isam Vertical axis wind turbine performance prediction, high and low fidelity analysis. Proceedings of the IAJC-ISAM International Conference, 2014.

