Abstract
In order to study the distribution of unsteady pressure in volute type axial flow pump, the k-ε turbulence model was applied, and ANSYS CFX was provided for numerical simulation calculation. Experiments of external characteristics and pressure fluctuation have been done to verify the results of numerical simulation. The results show that under the design operating condition, the main fluctuation frequencies in the volute, at the inlet and outlet of the impeller are the blade passing frequency. The amplitudes of fluctuation at the inlet of the impeller decrease gradually from the rim to the hub, while those at the export decrease firstly and then increase, the amplitudes at the tongue are much higher than that at other sections of the volute. Under the off-design operating conditions, the main fluctuation frequency at the inlet and outlet of the impeller is still the blade passing frequency, while that at the tongue is between the twice shaft frequency and the blade passing frequency, fluctuation amplitudes are both larger than those under the design operating condition. Under the design operating condition, the radial force on the impeller is the minimum, however, the axial force increases with the increase of flow rate. The distributions of unsteady pressure in volute type axial flow pump are different with general centrifugal or axial flow pump.
1. Introduction
Axial flow pumps are widely used in large water conservancy projects for the characteristics of large flow and low head, such as the South to North water diversion project. Material conveying are much stricter for traditional submersible axial flow pumps, and the volute type axial flow pumps had been tested that the flow capacity and the stability can be improved. Inside the axial flow pump, the rotor-stator interaction between the impeller and the volute initiates pressure fluctuation, and the pressure fluctuation leads to the phenomenon of resonance, making noise and vibration during the pump operating [1-3]. Therefore, it is greatly significant to study the distribution characteristics of pressure fluctuation in the volute type axial pump.
With the development of computational fluid dynamics and computer technology, domestic and foreign scholars have done a lot of researches on pressure fluctuation in the pump [4-7]. Shi Weidong [8, 9] et al. did statistics for the distribution of pressure fluctuation over radial direction under different speeds in a axial flow pump, when the rotational speed changed, the RMS of pressure fluctuation mixing amplitude changed along the radial direction. Zhang Desheng [10] et al. conducted experimental studies for the characteristics of pressure fluctuation under different operating condition in a axial flow pump, and revealed the principle of pressure fluctuation in different positions separately. Yuan Jianping [11] et al. simulated the whole flow fields of centrifugal pumps with three long blades and three short blades by the LES and indicated the distribution characteristics of press fluctuation in the volute, which was the largest at the tongue on the interface between the impeller and volute along the circumferential direction, and the pressure fluctuation was obvious in the volute. Cao Weidong [12] et al. investigated the characteristics of pressure fluctuation at the export of the impeller and the different positions of the radial diffuser in the multistage centrifugal pump and indicated the characteristics near the torque and the distribution principle of the radial force acting on the impeller. Liu Houlin [13] et al. researched the change law of pressure fluctuation at the import of the channels in each stage vane of the multistage centrifugal pump and indicated that the fluctuation was the severest in the first vane and the amplitudes decreased gradually with the stage increasing. Lee Rennian [14] et al. studied the influence of the rotor-stator interaction on the unsteady pressure fluctuation in the mixed flow pump and calculated the pressure fluctuation at the inlet and outlet section of the impeller and the dynamic-static coupling surface, then found that the maximum amplitude occurred in the rim of the impeller. Sudo [15] et al. provide some experimental information concerning the variation in pressure pulsations at the pump discharge due to the cutwater gap, skew of the cutwater tongue and the clocking of the impeller. Tourret [16] et al. have tested a centrifugal pump with a casing and found that the most severe pressure fluctuations occur at the volute cut off. Spence and Teixeira [17] has shown the feasibility of generating a numerical model of a complete pump geometry. That study also compared the pressure pulsations from the numerical analysis at locations within the impeller, volute and leakage flow passages with experimental test data and reasonable agreement was found. Akinori Furukawa [18] et al. researched the pressure fluctuation from the export of the impeller to the vane, which revealed that the interference between the impeller and the vane had a more obvious effect on pressure fluctuation in the vane than the wake of the impeller. Guo [19] et al. chose the high head pump as the research object, mainly studied the interference phenomenon between the impeller and the vane, which found that pressure fluctuation under the large flow operating condition was much severer than the design flow operating condition.
Previous studies on the combination of axial flow vane and volute were relatively few. In this paper, this study focused on the numerical simulation for the whole flow field of the volute type axial pump by ANSYS CFX and analyzed the characteristics of pressure fluctuation under different operating conditions. The work could provide a reference for predicting the characteristics of pressure fluctuation in the pump, reducing the vibration of volute and improving the stability of the pump.
2. Simulation model and numerical calculation
2.1. Model parameter
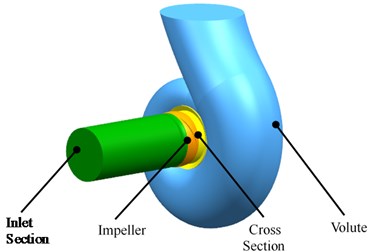
In this paper, a single stage volute type axial flow pump was taken as the research object. The main design parameters: the flow rate at best efficiency point Q= 216 m3/h, the head H= 4 m, rotation speed n= 2900 r/min; geometric parameters: the diameter of the impeller D1= 140 mm, hub ratio Dh/D1= 0.35, blades number Z= 3; the diameter of basic circle of the volute D2= 180 mm, the width of the import b= 100 mm. The simulated domain of the whole flow field was shown in Fig. 1.
Fig. 1Computational domain
2.2. Meshing
The simulated domain mainly included five parts: the inlet section, the impeller, the cross section, the volute and the outlet section. In this paper, structured hexahedral meshed were used to mesh the computational domain except the volute and due to the special shape of the volute, the tetrahedral meshes were a better choice. The mesh of the impeller and volute were shown in Fig. 2.
Fig. 2Partial fluid mesh of pump
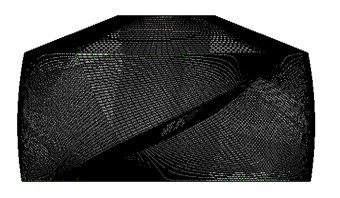
a) Impeller mesh
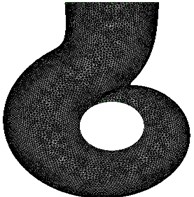
b) Volute mesh

c) Inlet section mesh
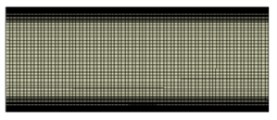
d) Outlet section mesh
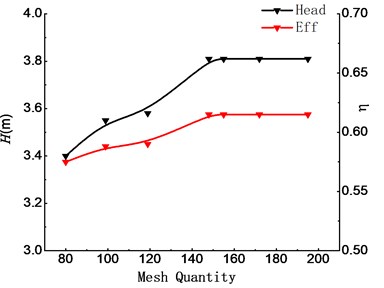
In order to reduce the influence of the mesh number on the calculation result, the head and efficiency at the rated flow point were chosen as the target, the independence test of mesh was carried out, the results were shown in Fig. 3. When the mesh number was over 1.55 million, the head and efficiency tended to be stable, so the final number of mesh was about 1.75 million. The value of y+ is between 30 and 100.
Fig. 3Mesh independence verification
2.3. Simulation method and boundary condition setting
The standard k-ε turbulence model was adopted in the ANSYS CFX. The inlet boundary condition was set as the mass flow rate, and the outlet boundary condition of the pump was set as a static pressure condition, the condition of wall was set as no slip wall and the roughness is set as 0.025 mm. The interfaces between the inlet section, as well as the interfaces between impeller and the flow section, were set as the Frozen Rotor rotor-stator coupling surface. The convergence accuracy is 10-5. Firstly, steady calculation for the whole flow field of the pump was taken, and under the same boundary condition, the results of steady calculation were used as the initial value of the unsteady calculation. The turbulent kinetic energy kin and turbulent energy dissipation rate εin at the inlet were calculated as follows:
where uin is the import speed and l= 0.07 Dinlet, Dinlet is the import diameter.
The three-dimensional non-constant turbulent calculation was based on the result from the constant calculation. The impeller rotating 1 degree was set as a time step, one time step lasts 0.0000574 s and one cycle was 0.020664 s. After impeller rotating eight cycles, the flow feed showed periodicity; the total computation time was 0.165312 s.
2.4. Pressure monitoring point
The distribution of the monitoring points for time domain and frequency domain analyses were shown in Fig. 4, the points were set in the inlet and outlet of the impeller, the 1st, 3rd, 5th and 7th section of the volute.
The expression of pressure coefficient Cp is:
where Δp (Pa) is the difference between pressure and mean pressure at the monitoring points, u2 (m/s) is the circumferential velocity at the export of the impeller, ρ (kg/m3) is the density of the fluid.
Fig. 4Location of monitor points
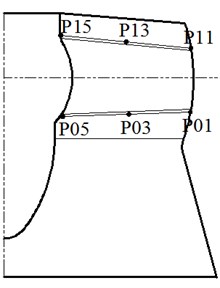
a) Impeller
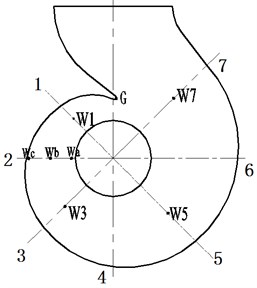
b) Volute
3. Simulation results and analysis
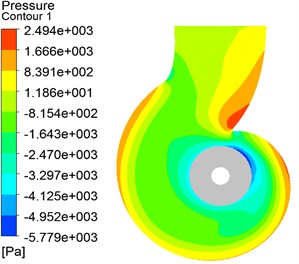
Fig. 5 shows the distribution of static pressure on the middle section of the volute in the model pump. With the increasing of the radius, the static pressure increases gradually. The lowest pressure occurs near the inlet of the first section of the volute, and the highest pressure occurs at the tongue near the outlet of the volute. This is mainly due to the velocity of fluid decreases through the diffusion section. However, there may be back-flow near the tongue, resulting in the significant increase of the pressure near the tongue.
Fig. 5Static pressure distribution in the volute
3.1. Time and frequency domain analysis for pressure fluctuation under design operating condition
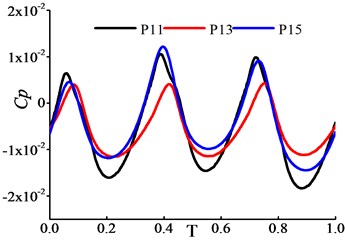
After the impeller rotated five cycles, the flow field presents obviously periodicity. The data from the 6th to the 8th cycle were chosen for the further pressure fluctuation analysis. As shown in Fig. 6, under the design operating condition, there are three peaks and troughs of pressure fluctuation at the monitoring points such as P01, P03, P05; the number of blades is also 3. At the point P01, the amplitude and range of pressure fluctuation are the largest, from the rim to the hub, the amplitude and range at the point P03 and P05 decrease gradually. In Fig. 7, the law of pressure distribution is still obvious; there are three peaks and three troughs. The amplitudes of pressure fluctuation decrease firstly and then increase from the rim to the hub, reaching the maximum in the hub side. The fluctuations at the monitoring points in the inlet of the impeller import are more regular than those in the outlet. The monitoring points locating near the interface between the rotating domain of impeller and the static domain are influenced by the rotor-stator interaction.
Fig. 6Cp at the inlet of impeller
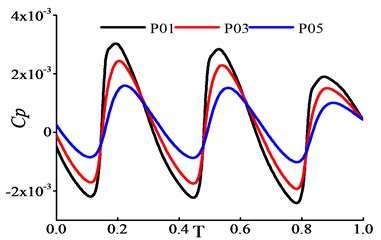
Fig. 7Cp at the outlet of impeller
In Fig. 8, the distribution of pressure fluctuation at the monitoring points of each section in the volute presents periodicity; there are three peaks and troughs too. The ranges of pressure fluctuation at different monitoring points are also regular; the amplitude of pressure fluctuation at the point G near the tongue is the largest. From the 1st to 7th section of the volute, the amplitude and range of pressure fluctuation reduce gradually. In Fig. 9, pressure fluctuation at points wa, wb and wc have obviously periodicity. The gap of pressure fluctuations between the three monitoring points is small; the amplitude of pressure fluctuation at the point wb is almost the largest.
The speed of the impeller is 2900 r/min, the number of blades is 3, and the rotating frequency is 48.33 Hz, the blade passing frequency is 145 Hz. Fig. 10 shows the frequency domain of pressure fluctuation at each monitoring point in the axial flow pump. In Fig. 10(a), the main frequency of pressure fluctuation at the monitoring points at the inlet of the impeller is the blade passing frequency. The difference of pressure fluctuation range between the three monitoring points is small. In Fig. 10(b), the main frequency of pressure fluctuation at the monitoring points at the outlet of the impeller is also the blade passing frequency.
Due to the influence of the rotating blades, the amplitude of pressure fluctuation at the P15 is higher. In Fig. 10(c), the main frequency of monitoring points on different sections of the volute is still the blade passing frequency. The amplitude of pressure fluctuation at the tongue is the largest. The main frequency of different monitoring points on the second surface in the volute is also the blade passing frequency, while the amplitude of wb is the largest at the main frequency, as shown in Fig. 10(d).
Fig. 8Cp in the volute
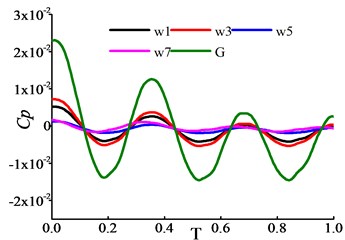
Fig. 9Cp at the second section of volute
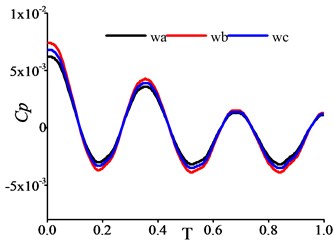
Fig. 10Time domain in monitor points of axial-pump
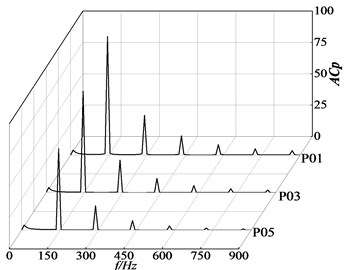
a) Frequency domain of pressure fluctuation at the inlet of the impeller
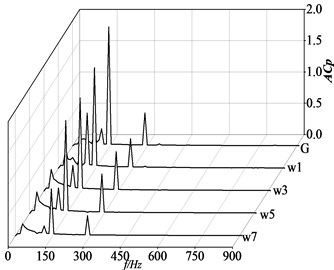
b) Frequency domain of pressure fluctuation at the outlet of the impeller
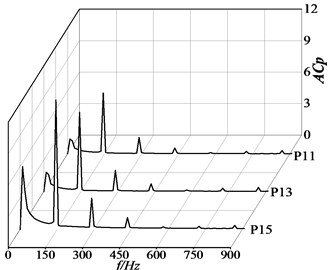
c) Frequency domain of pressure fluctuation at the inlet of the volute
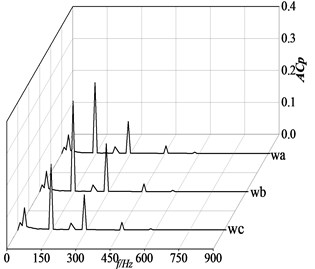
d) Frequency domain of pressure fluctuation at the second section of the volute
3.2. Time and frequency domain analysis of pressure fluctuation under different operating condition
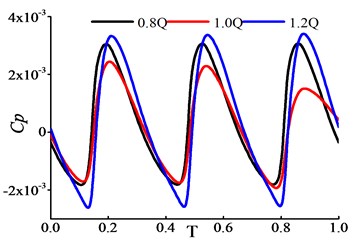
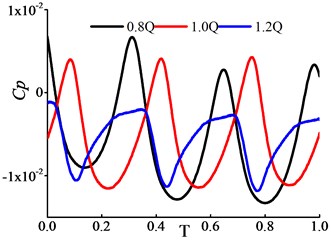
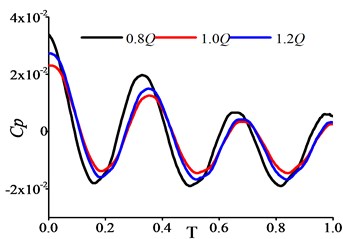
Fig. 11 shows the time domain of pressure fluctuation at the monitoring points of P03, P13 and point G near the tongue under 0.8Q, 1.0Q and 1.2Q operating condition. In Fig. 11(a), pressure fluctuation of the monitoring points P03 at the inlet of the impeller is steady under the three-operating condition. Among them, the amplitude under the design operating condition is the smallest, and those under the small and large flow operating condition are larger. In Fig. 11(b), pressure fluctuation of the P13 monitoring point at the outlet of the impeller presents regular, while due to its locating on the dynamic-static interface, pressure fluctuation shows differences at different operating condition. In Fig. 11(c), pressure fluctuation at the G monitoring point near the tongue has an outstanding regularity. Under the design condition, the amplitude of pressure fluctuation is the smallest, while those under the off-design operating condition are larger. Among them, under the 0.8Q operating condition, the amplitude of pressure fluctuation is the largest. The increasing of pressure fluctuation is affected by the backflow caused by the fluid shock at the G point under off-design operating condition.
Fig. 11Time domain in P03, P13 and G points under various flow rates
a) P03
b) P13
c) G at the tongue
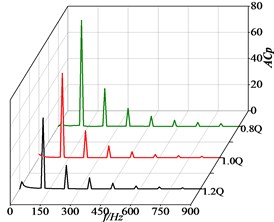
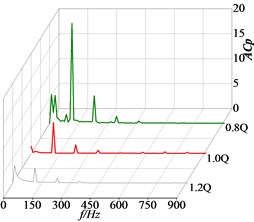
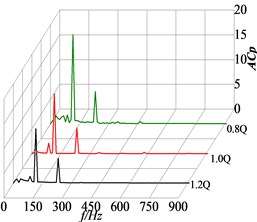
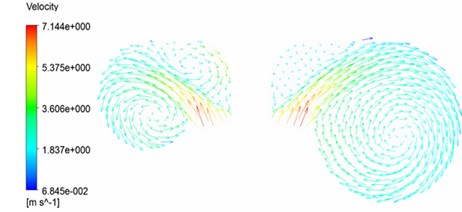
Fig. 12 is the frequency domain of pressure fluctuation at the P03, P13 monitoring points and G point at the tongue under the 0.8 Q,1.0 Q and 1.2 Q operating condition. The main frequency of pressure fluctuation is the blade passing frequency at the monitoring points at the inlet and outlet of the impeller under the three operating condition. The gap of the amplitude of pressure fluctuation under the three operating condition at the P03 monitoring point is small. In Fig. 12(c), the main frequency of pressure fluctuation of the monitoring point at the tongue is between the twice shaft frequency and blade passing frequency, which is caused by the unsteady flow at the tongue, the distributions of velocity near tongue has been shown in Fig. 12(d).
4. Experiment
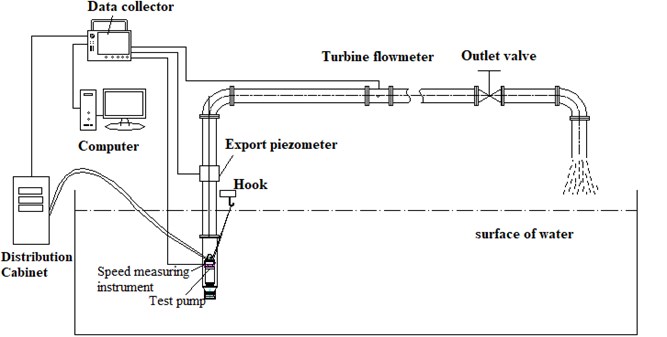
The pump model was produced using 3D printing rapid prototyping technology and other processes. The external characteristics experiment equipment’s mainly include: pressure transmitter, turbine flow meter, power meter and external characteristics data acquisition instrument. The WT2000 series pressure transmitter was adopted, the measuring range is 0-1 MPa and the precision level is 0.2 %. The LWGY-150A0A3T type turbine flowmeter with the precision level was 0.5 % adopted in the experiment. The test bench was arranged as shown in Fig. 13.
Fig. 12Frequency domain in P03, P13 and G points
a) P03
b) P13
c) G at the tongue
d) Velocity distribution in the volute
The results of numerical simulation were compared with that of the experiment, as shown in Fig. 14, the tendency of the external characteristics in simulation and experiment are basically consistent. Near the design operating condition, the relative gap of the head between the experiment and the simulation is 1.2 %, and the overall relative error is within 3 %. The gap of efficiency under the design operating point is 2.39 % and the overall relative error is within 2.5 %. The results show that the selection of turbulence model is basically reliable in the numerical simulation for the volute type axial pump.
Fig. 13Arrangement of test bench
The main measurement equipment of pressure fluctuation includes submersible high frequency pressure sensor and data acquisition instrument. The HY6305 pressure sensor with measuring range of 0-1 MPa and a precision rating of 0.25 % was adopted, and the HSJ-2010 type hydraulic mechanical comprehensive test instrument were used. As shown in Fig. 16, monitoring points for pressure fluctuation measurement were set on the 3rd, 5th, 7th section and outlet of the volute, and the sampling frequency of each monitoring point was set as 2048 Hz.
Fig. 14External characteristic of experiment and simulation
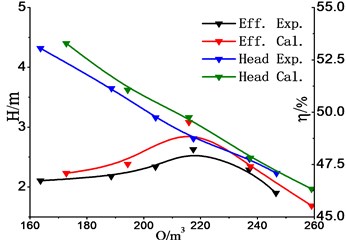
Fig. 15Test instruments for pressure fluctuation
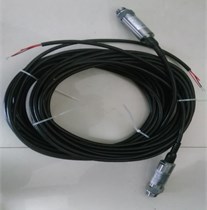
a)
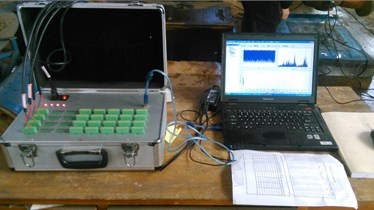
b)
Fig. 16Pressure sensors installed in the test pump
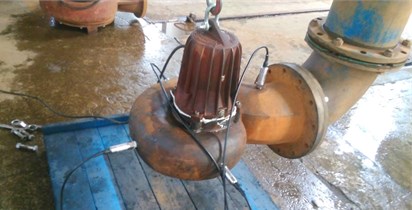
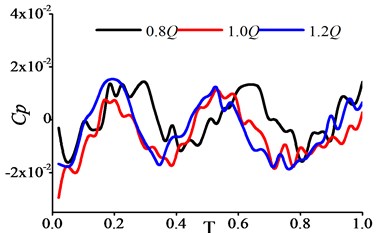
Fig. 17 is the time domains of pressure fluctuation at the monitoring points of the volute in a cycle. There are three fluctuation cycles at each monitoring point, which is consistent with the results of numerical simulation. As the fluid flowing to the outlet gradually growing stable, the pressure fluctuation at the P3, P5 monitoring points is obviously larger than that at the P7 monitoring point, which is the same as the trend of the unsteady numerical simulation. Fig. 18 is the time domains of pressure fluctuation at the four monitoring points under different operating conditions, those both have obvious periodicity under different conditions with three peaks and troughs. The amplitudes of pressure fluctuation have no obvious regularity under different operating conditions.
Fig. 19 is the frequency domains of pressure fluctuation at different monitoring points under the design operating condition. It can be seen from the figure that the main frequencies at the four monitoring points are both 134 Hz, which is different with the simulation blade passing frequency, 145 Hz. That’s because of the overpower of the motor when the model pump is operating (matching motor power is 3 KW, but the highest power consumption in operating is 4.2 KW), which causes the true speed of the motor didn’t reach 2900 r/min, and the real shaft and blade passing frequency declined. Comparing the amplitudes of the four monitoring points under the main frequency, it can be seen that the frequency at the P3 is the maximum. The amplitude of pressure fluctuation at P5, P7 and Pout decreases gradually, and the pressure fluctuation at Pout is relatively low.
Fig. 17Time domains in different points of volute under design point
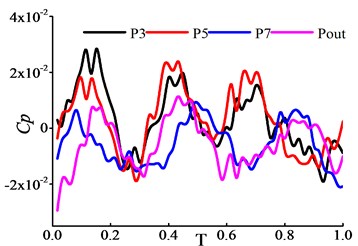
Fig. 18Time domains of volute monitor points under various flow rates
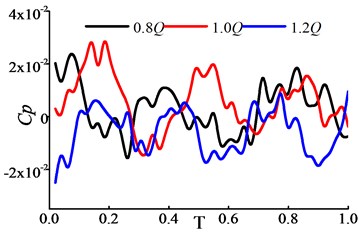
a) p3
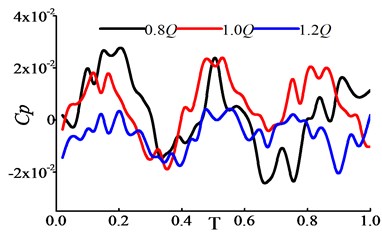
b) p5
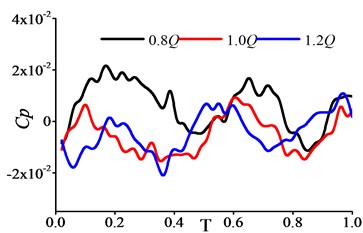
c) p7
d) pout
Fig. 19Frequency domains in different points of volute under design point
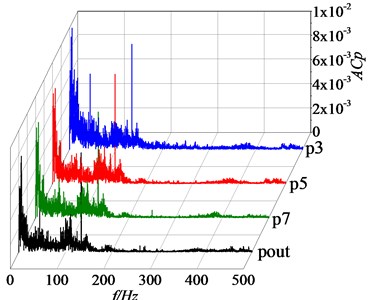
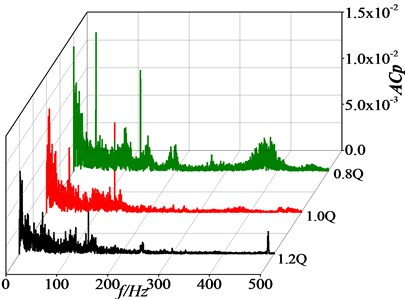
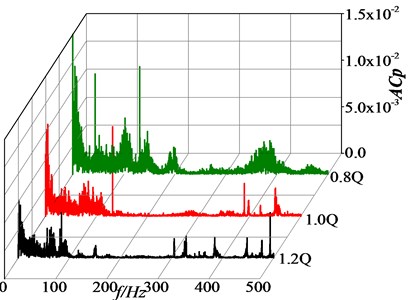
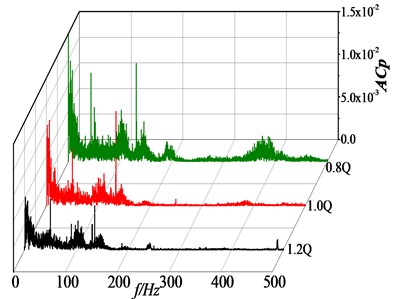
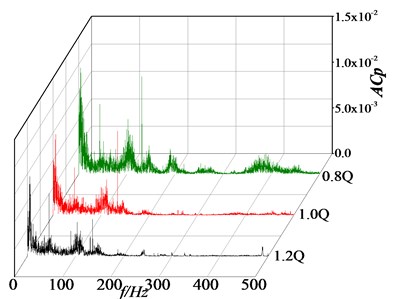
Fig. 20 is the frequency domains of pressure fluctuation for every monitoring points under the 0.8Q, 1.0Q and 1.2Q operating conditions. The main frequency at P3 is the shaft frequency under the 0.8Q operating condition. While the main frequencies are the blade passing frequency under the 1.0Q and 1.2Q operating conditions. The main frequency of P5 is between the shaft frequency and the twice shaft frequency under the 1.2Q operating condition, and the main frequency of the P7 monitoring point is the blade passing frequency under the three operating conditions. The main frequency of the Pout is the blade passing frequency under the 0.8Q and 1.0Q operating conditions, and the main frequency is the shaft frequency under the 1.2Q operating condition. These characters are different with general centrifugal or axial-flow pump.
Fig. 20Frequency domains of volute monitor points under various flow rates
a) p3
b) p5
c) p7
d) pout
5. Radial and axial force
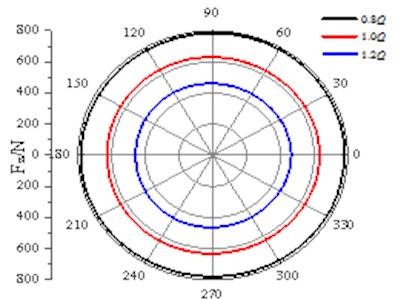
The volute type axial flow pump can produce the radial force on the impeller in operation, which causes the shaft to be subjected to the alternating stress, and produces the directional disturbance, which affects the safe operation of the pump. Choosing the whole blades include the hub as the research object, the magnitude of the radial force is F=√Fx+Fy. The x and y directions of the model pump are shown in Fig. 21.
Fig. 22 is the changes in a cycle of the radial force under the 0.8Q, 1.0Q and 1.2Q operating conditions. As shown in the Fig. 22, the radial force pulses periodically with time. The variation tendencies of the radial force under the three operating conditions are the same. But the values are different, among them, the maximum is under the 0.8Q operating condition and the minimum is under the 1.0Q operating condition.
The time-domain diagram of the axial force on the impeller are shown in Fig. 23. Define the direction pointing to the inlet of the impeller as the positive direction. As can be seen form the Fig. 23, the axial force changes very little while the impeller rotates for one cycle whether under the 0.8Q, 1.0Q or 1.2Q operating condition. The axial force on the impeller has the maximum under the 0.8Q operating condition, and the minimum under the 1.2Q.
Fig. 21Schematic diagram of radial force
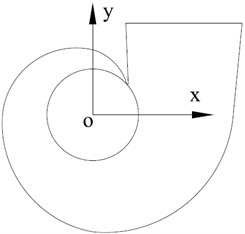
Fig. 22Transient radial force variation
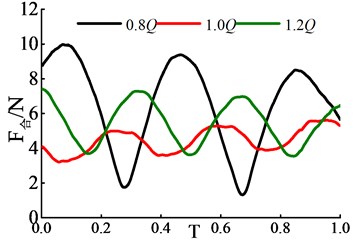
Fig. 23Distribution of axial force
6. Conclusions
As a new type pump, the volute type axial flow pump can adapt to the large flow conveying with high concentration fiber, the characteristic of pressure fluctuation still needs a systematic research. In this paper, one pump was chosen to do experiment and numerical simulation of pressure fluctuation. The main conclusions are as follows:
1) Under the design operating condition, the main frequencies of pressure fluctuation at the inlet and outlet of the impeller are both the blade passing frequency. The fluctuation amplitude at the inlet decreases gradually from the rim to the hub, while it is at the outlet, it decreases first and then increases from the rim to the hub. The main frequency in the volute is the blade passing frequency, and the fluctuation amplitude near the tongue is much higher than other sections.
2) Under the off-design operating conditions, the main frequency of pressure fluctuation at the inlet and outlet of the impeller is still the blade passing frequency. The main fluctuation frequency near the tongue in the volute is between the twice of shaft frequency and the blade passing frequency, the fluctuation amplitudes are both higher than that in the design operating condition. Therefore, the pump needs to avoid off-design operating.
3) Under different flows, the radial and axial forces on the impeller both pulses periodically with time. Under the design operating condition, the radial force on the impeller is the minimum. The axial force changes very little while the impeller rotates for one cycle. The axial force on the impeller has the maximum under the 0.8Q operating condition, and the minimum under the 1.2Q.
References
-
Wang Fujun, Zhang Ling, Zhang Zhimin Analysis on pressure fluctuation of unsteady flow in axial-flow pump. Journal of Hydraulic Engineering, Vol. 38, 2007, p. 1003-1009.
-
Shi Weidong, Leng Hongfei, Zhang Desheng, et al. Performance prediction and experiment for pressure fluctuation of interior flow in Axial-flow pump. Transaction of the Chinese Society of Agricultural Machinery, Vol. 42, Issue 5, 2011, p. 44-48.
-
Tang Fangping, Zhang Ling, Fu Jianguo, et al. Prediction and numerical analysis for pressure fluctuation of axial-flow pump. Journal of Drainage and Irrigation Machinery Engineering, Vol. 10, 2013, p. 834-840.
-
Zobeiri A., Kueny J. L., Farhat M., et al. Pump-turbine rotor -stator interactions in generating mode: pressure fluctuation in distributor channel. Proceedings of the 23rd IAHR Symposium on Hydraulic Machinery and Systems, Yokohama, 2006.
-
Zhang Desheng, Shi Weidong, Chen Bin, et al. Unsteady flow analysis and experimental investigation of axial flow pump. Journal of Hydrodynamics, Vol. 22, Issue 1, 2010, p. 35-44.
-
Zhang Desheng, Zhang Guangjian, Xu Yan, et al. Numerical investigation of pressure fluctuation induced by rotor-stator interaction in a mixed-flow pump. Journal of Comparative Neurology, Vol. 6, 2013, p. 611-619.
-
Yuan Shouqi, Ni Yongyan, et al. Unsteady turbulent simulation and pressure fluctuation analysis for centrifugal pumps. Chinese Journal of Mechanical Engineering, Vol. 1, 2009, p. 64-69.
-
Yao Jie, Shi Weidong, Wu Suqing, et al. Numerical calculation and experiment on pressure fluctuation in Axial-flow pump. Transaction of the Chinese Society of Agricultural Machinery, Vol. 1, 2013, p. 119-125.
-
Yao Jie, Shi Weidong, Zhang Desheng, et al, Test comparative study on impact of different revolving speed on pressure fluctuation in axial flow pump. Transactions of the Chinese Society of Agricultural Machinery, Vol. 35, 2014, p. 67-71.
-
Zhang Desheng, Wang Haiyu, Shi Weidong, et al. Experimental investigation of pressure fluctuation with multiple flow rate in scaled axial flow pump. Transactions of the Chinese Society of Agricultural Machinery, Vol. 11, 2014, p. 139-145.
-
Yuan Jianping, Fu Yanxia, Liu Yang, et al. Analysis on pressure fluctuation within volute of centrifugal pump based on lager eddy simulation. Journal of Drainage and Irrigation Machinery Engineering, Vol. 4, 2010, p. 310-314.
-
Cao Weidong, Liu Guanghui, Shi Weidong, et al. Distribution of unsteady pressure in multistage centrifugal pump. Chinese Society of Agricultural Engineering, Vol. 14, 2014, p. 64-70.
-
Liu Houlin, Zhou Xiaohua, Wang Kai, et al. Analysis on pressure fluctuation of radial diffusers in a multistage centrifugal pump. Journal of Central South University: Science and Technology, Vol. 45, Issue 9, 2014, p. 3295-3300.
-
Li Yibin, Li Rennian, Wang Xiuyong, et al. Numerical analysis of pressure fluctuation in low specific speed mixed-flow pump. Journal of Drainage and Irrigation Machinery Engineering, Vol. 3, 2013, p. 205-209.
-
Sudo S., Komatsu T., Kondo M. Pumping plant noise reduction: reduction of pressure pulsation in pump discharge pipe systems. Hitachi Review, Vol. 5, 1980, p. 217-222.
-
Tourret J., Badie Cassagnet A., Bernard G., Foucault J. P., Kermarec J. Experimental studies of noise emission and noise generation from a centrifugal pump. ASME Paper No. 95-WA/FE-8, 1985.
-
Spence R. R. G., Teixeira J. A. Investigation into pressure pulsations in a centrifugal pump by numerical and experimental methods. Computers and Fluids, Vol. 37, Issue 6, 2008, p. 690-704.
-
Akinori Furukawa, Hisasada Takahara Pressure fluctuation in a Vaned diffuser downstream from a centrifugal pump impeller. International Journal of Rotating Machinery, Vol. 9, Issue 4, 2003, p. 285-292.
-
Guo Lei, Liu Jintao, Wang Leqin, et al. Pressure fluctuation propagation of a pump turbine at pump mode under low head condition. Science China Technology Science, Vol. 57, Issue 4, 2014, p. 811-818.
-
Zhang Lin, Shi Weidong, Zhang Desheng, et al. Analysis of instable flow on mix-flow pump base on LES. Journal of Drainage and Irrigation Machinery Engineering, Vol. 4, 2017, p. 303-308.
-
Shi Lei, Zhang Desheng, Yong Xin, et al. A study on tip leakage vortex dynamics and cavitation in axial-flow pump. Fluid Dynamics Research, Vol. 49, Issue 3, 2017, p. 35504.
About this article
This work was supported by Project of key research and development in Zhenjiang (SH2017049).

