Abstract
The conventional state space method for force identification has the disadvantage of large discretization error with a low sampling frequency. This paper presents an improved method based on the function interpolation of the external force in time domain. Two types of the interpolation functions are investigated, one is the linear interpolation, and the other type is the sigmoid curve interpolation. Gauss integration method is used for integration computation. Numerical studies show that both of the improved methods based on the two types of interpolation function are more accurate especially when the sampling is long and/or with a low sampling frequency. In addition, the proposed method is also extended for the case of high noise level. The key idea is to divide the time step of measured responses into several smaller time steps to form an overdetermined equation of the inverse force identification. Then, the least square algorithm is adopted, which helps to reduce the effect of the high random noise to improve the accuracy of identified solution.
1. Introduction
Accurate knowledge of the dynamic force on a structural system is of great importance in many structural dynamic problems, such as structural dynamic design, response reconstruction, condition assessment and health monitoring. However, direct measurement of the external forces is very difficult, especially the interaction force between different substructures of a large structural system. Also, in some situations, if force gauges are inserted into force transfer path to measure those dynamic excitations, it is difficult to obtain the accurate forces since the existence of force gauges may alter the system properties. Instead, vibration responses can be conveniently measured. The indirect method of force identification is to perform an inverse identification process with the measured structural responses and the known structural system, which is an important topic in the identification of structural systems under operational conditions.
Existing force identification methods can be mainly classified into two categories of approaches, the frequency domain [1-5] and time domain methods [6-10]. The frequency domain methods of estimating forces were originally developed in the 1980s using the frequency response functions. The identified forces are just in frequency domain. To obtain the forces in time domain, inverse Fourier transform is required. This makes those methods suitable for stable and stationary random forces, and difficult to identify impact transient forces. Later, the time domain methods have been proposed. Both of the frequency and time domain methods are mainly concerned as the deterministic approaches. In recent years, the probabilistic/statistical methods [11-13] have been developed, such as Bayesian methods [14] and Kalman filtering methods [15]. In this paper, we focus on the force identification method based on the state space method which is the most popular method among the existing time domain methods. The state space method relates the structural responses, the system parameters and the input forces with the Markov parameters, and they are not sensitive to the initial values and have no cumulative errors produced by the previous time step compared with many other time domain force identification methods. Law and Fang [16] presented a state space method for moving force identification. Kammer [17] and Law et al. [18] adopted the zeroth order system Markov parameters to identify the external forces. Nordberg and Gustafsson [19] proposed an explicit block inversion algorithm to invert the associated upper block triangular Toeplitz matrix for force identification using the state space method. Mao et al. [20] established a precise force identification model based on the precise time-step integration method for Markov parameters in the state space method, and Tikhonov regularization technique was adopted to obtain the regularization solution. Law and Yong [21] used the state space method to identify the interface forces and the external forces for structural condition assessment. The state space method was also adopted by the Kalman filter method [22] and the augmented Kalman filter method [23] for force estimation. Recently, a novel approach of force identification based on average acceleration discrete algorithm was presented in the state space [24]. In addition, sensor placement problem for force identification based on Markov parameters was also investigated in Ref. [25]. Two methods of sensor placement were proposed: One was based on the condition number of Markov parameter matrix, and the other was based on the correlation analysis of Markov parameter matrix.
Although the state space method is widely used in force identification, it still has an important problem. The method is assumed that the force is a constant value during each time interval. The assumption can be satisfied only when the time step is small enough. A required high sampling frequency may not only lead a heavy computation, but also increase the ill-posedness of the Markov parameter matrix. Along with the increase of the sampling time step, the state space method is less accurate for force estimation. Referring to the finite element method in structural dynamics, one knows the shape function interpolation for space discretization of structural responses. Thus, a suitable interpolation function for time discretization of the input force may be practicable for establishing a more accurate model of force identification. In this paper, an idea based on the time discretization of the force is first introduced in the conventional state space method for force identification, and two types of the interpolation functions are employed: One is the linear interpolation, and the other type is the sigmoid curve interpolation. Then, Gauss numerical integration method is used for integration computation. Finally, a Tikhonov regularization technique is used to solve the ill-posed problem of force reconstruction, and the L-curve and the generalized cross-validation (GCV) criterion are both adopted to find the optimum regularization parameter. Additionally, the proposed method is extended for the case of high noise level. The idea is to divide the time step of measured responses into several smaller time steps to form an overdetermined equation of the inverse force identification, while the time step of the discrete force is still the original time step of the proposed method. Then, the least square algorithm is employed, which helps to smooth out the high random noise to improve the accuracy of identified force.
This paper proceeds as follows. Section 2 first introduces the improved state space method based on the interpolation function method for force reconstruction. Then the Tikhonov regularization method is introduced briefly. Section 3 presents the extension version of the proposed method for dealing with the case of high noise level. In Section 4, numerical studies are conducted to demonstrate the effectiveness of the proposed methods. Effects of measurement noise (including high level of noise), multiple forces reconstruction and white noise excitations are also considerable. Finally, several conclusions and remarks are drawn based on the current study. In addition, the conventional force identification method based on the state space method is listed in Appendix.
2. The theory of force identification
The general equation of motion of a damped structure can be written as:
where , and are the mass, damping and stiffness matrices of the structure, respectively; , , are, respectively, the nodal acceleration, velocity and displacement vectors of the structure; is the load vector. Rayleigh damping is assumed in this paper, where and are the Rayleigh damping coefficients. However, there is no limitation on the type of damping model adopted in the proposed method just as the conventional state space method.
2.1. The improved state space method based on interpolation function
The equation of motion of the structural system in Eq. (1) can be expressed in the state space as:
where , , and .
Eq. (2) can be converted into the following discrete equation as:
where . In the conventional state space method, the force in Eq. (3) is assumed to be constant in each time step (from to ). However, it is known that the solution is close to exact only when the time interval is very small. A very small time interval will lead to make a large size of Markov parameter matrix, which may form an ill-posed equation. In the improved method, the force is assumed as a function varying with time at each time interval, not just a constant value. This will make the model of force identification more accurate, and allow the time step being larger at some extent. Suppose the force being a function as:
Substituting Eq. (4) into Eq. (3) has:
The Lagrange linear interpolation is well-known, and it is adopted in this article. The linear interpolation function is defined as:
Therefore, the force is approximated as a linear function varying with time in each time step, which is represented as:
Substituting Eq. (6) into Eq. (5), we obtain:
The integration is computed by Gauss integration which is a well-known numerical integration algorithm. Then, one obtain:
where is the number of the integration points, is the weight coefficient and is the coordinate of the integration point.
The output equation can be written as:
where ,, are the mapping matrices associate with the DOFs of the measured acceleration, velocity and displacement, respectively. is the number of sensor, is the total number of DOFs in the structure.
Vector can be rewritten as:
where and .
Eq. (11) can be converted into the following discrete equation as:
The output can be solved from Eqs. (9) and (12) with the assumption of zero initial response of the structure and we have:
where , ,
Eq. (13) can be rewritten in the matrix form as:
where:
Eq. (14) is the force identification model to estimate the time history of input force from the measured responses, and it is the same form as Eq. (A11) in the Appendix.
The sigmoid curve is a well-known transfer function, which is often used in neural network [26-27]. The sigmoid function is a bounded differentiable real function with a threshold of (0, 1). In some extent, it can be regarded as an approximate linear function with slope. So, the sigmoid curve can be also used as an interpolation function. It is written as [28]:
where is the coefficient varying with , in this paper, is equal to 12.
Then, Substituting Eq. (15) into Eq. (5), and employing Gauss integration, one can obtain the following equation as:
The following identification procedure is just the same as the above description about the linear interpolation method. The only difference is the terms of and .
2.2. Force identification with regularization technique
Like many other inverse problems, the force identification problem is ill-posed. Regularization method would provide an improved solution to the ill-posed problem. The damped least-squares method proposed by Tikhonov [29] is widely used. Eq. (17) shows the application of the regularization method in force identification as:
where is the non-negative damping coefficient governing the participation of the least-squares error in the solution. Solving Eq. (17) is equivalent to minimizing the function:
The L-curve [30] and the generalized cross-validation (GCV) [31] criterions are the two famous methods to find the optimal regularization parameter . In this paper, both of them are adopted for force identification.
To illustrate briefly in the following text, LISS represents the improved identification method based on linear function interpolation, and SISS represents the improved identification method based on sigmoid curve function interpolation.
3. Improvement of the proposed method for the case of high noise level
In this section, the proposed LISS method for force identification is extended for the case of high noise level. We divide each time interval into two small sub-time intervals, according to Eq. (3), one can get the two following equations as:
Assuming the force is still linear during as above, we have:
where:
The output vector can be written as:
With the knowledge of the recurrence matrices of the state vector and the above output matrices, one can obtain the force identification equation just as similar as the equation of the above proposed method in Eq. (14). The identification equation is expressed as:
where:
Assuming , the differences between Eq. (14) and Eq. (25) are the matrices in:
where:
It should be noted that the force identification equation is over determinated, and the size of the matrix is . This means that the least square algorithm is needed to solve this inverse problem, which can reduce the effect of the random noise to improve the accuracy of identified force, especially when the noise is loud. It is also necessary to point out that the output Eq. (23) has an approximation of the node force, and this will influence the identification accuracy when the acceleration response at the acting point of force is used as the measured response. In fact, the measured sensor is not placed at the location of force.
Except for the case of the two sub-time intervals, the case of the four sub-time intervals is also studied. The derivation process is similar as the case of the two sub-time intervals, and the identification equation is the same as Eq. (25). The only difference is the values of the following several matrices. So only the final results are listed as follows:
in which:
To illustrate briefly in the following text, ILISS2 and ILISS4 represent the improved methods of the two sub-time intervals and four sub-time intervals, respectively.
4. Numerical studies
In this section, numerical studies are considered to evaluate the performance of the proposed method with comparison to the conventional state space method. A 12-bay plane truss structure is taken as the numerical model. This truss structure is modeled using 61 planar truss finite elements without internal nodes giving 52 DOFs. Node 1 is pin-supported and Node 26 is roller-supported, as shown in Fig. 1. The cross-sectional area of all elements is 0.0016 m2, and all horizontal and vertical members are of 1.0 m length. The first eight natural frequencies of the structure are 1.579, 5.266, 7.066, 12.662, 18.500, 21.295, 29.016 and 32.349 Hz, respectively. Rayleigh damping is assumed, and the two damping coefficients are 0.1523 and 4.6503×10⁻⁴. The mass density and elastic modulus of material are 7.85×10³ kg/m3 and 2.06 GPa, respectively.
Fig. 1a) Truss structure, b) node number, the external forces and sensors placement

a)

b)
4.1. The accuracy of force identification
This case is used to validate the accuracy of the proposed methods. In order to express briefly, the SS method represents the conventional state space method.
One excitation force is considered in this case, which is applied at Node 3 in the negative direction of axis. It is described as:
Three different sampling frequencies are studied, which are 2000, 1000, and 500 Hz, respectively. The time duration of measurement varies from 0.2 s to 0.6 s with 0.2 s increment. The ‘measured’ acceleration responses are represented by the analytical responses which are computed by the modal superposition method and Duhamel integration. The acceleration signals at DOF-4 and 5 in the vertical direction are used for force identification. No noise terms are added to the measured signals. The force is identified directly by inversion computation without any regularization techniques.
The relative error of identification for all the methods are defined as:
where , are the identified and real force time histories, respectively.
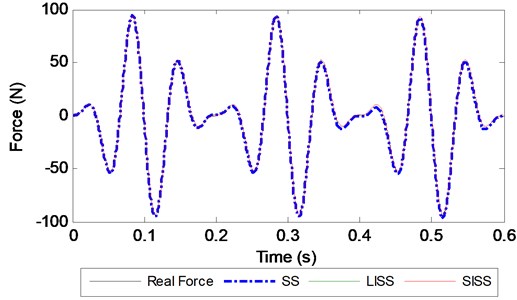
The REs of the three approaches are listed in Table 1. As seen from Table 1, the RE slightly increases when the time duration of measurement increases at the same sampling frequency for all the methods, while the RE quickly increases when the sampling frequency decreases. All the REs of the LISS and SISS methods are very small, and the largest RE value is 2.40 % as the sampling frequency is low to 500 Hz. The identified REs of the SS method are much larger than them of the two proposed methods for any situation especially when the sampling frequency is equal to 500 Hz. In this situation, the RE is 21.23 % with a time duration of 0.6 s, while the REs of the LISS and SISS methods are 2.17 % and 2.40 %, respectively. We also find that the REs of the proposed methods at a 500 Hz sampling frequency are even smaller than those of the SS method at 2000 Hz. In addition, Table 1 presents the condition number (CN) of the Markov parameter matrix for the three identification methods together with the RE. It can be observed that all the CN values of the SS method are larger than those of the two proposed methods. Figs. 2-4 show the identified forces of the three methods together with the real force time histories at different sampling frequencies for a 0.6 s time duration. From them, we can see that the identified errors of the SS method increase with a reduction in the sampling frequency more quickly than those of the two proposed methods for the same time duration. All the observations indicate that the proposed methods based on the interpolation function method are more accurate than the SS method especially when the sampling frequency is low.
Table 1Related errors (%) in the identified force and the condition numbers (CN) of different methods
Sampling frequency (HZ) | Time duration (second) | LISS | SISS | SS | |||
RE | CN | RE | CN | RE | CN | ||
2000 | 0.2 | 0.08 | 240.4 | 0.07 | 241.2 | 3.27 | 251.2 |
0.4 | 0.12 | 557.5 | 0.13 | 559,2 | 4.19 | 584.7 | |
0.6 | 0.14 | 1287.2 | 0.14 | 1290.8 | 5.02 | 1366.3 | |
1000 | 0.2 | 0.33 | 235.5 | 0.31 | 238.5 | 6.83 | 259.5 |
0.4 | 0.47 | 546.9 | 0.50 | 553.4 | 8.62 | 607.5 | |
0.6 | 0.57 | 1263.3 | 0.56 | 1277.4 | 10.35 | 1438.2 | |
500 | 0.2 | 1.25 | 218.1 | 1.65 | 229.0 | 15.58 | 275.5 |
0.4 | 1.75 | 512.7 | 1.84 | 537.1 | 17.99 | 654.0 | |
0.6 | 2.17 | 1169.6 | 2.40 | 1228.5 | 21.23 | 1586.1 | |
SS: the conventional state space method. LISS: the improved state space method based on linear shape function interpolation. SISS: the improved state space method based on sigmoid curve function interpolation. | |||||||
Fig. 2Identified force with different methods at a 2000 Hz sampling frequency
4.2. Force identification with noise
To investigate the effect of the noise level on the performance of the identification method, environment noise is added to the original measured signal. The noise is defined as a normally distributed random noise with zero mean and unit standard deviation, which can be written as:
where is the added noise to the original measured signal; is the noise level; is a standard normal distribution vector with zero mean and unit standard deviation and is the standard deviation of the original measured response. 5 % random noise is adopted.
Fig. 3Identified force with different methods at a 1000 Hz sampling frequency
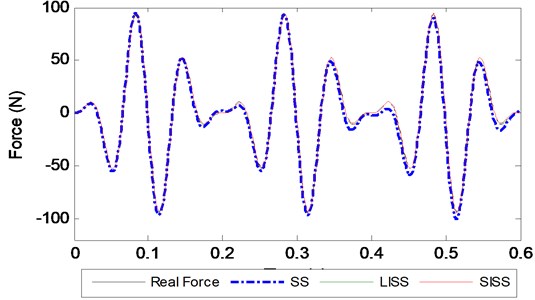
Fig. 4Identified force with different methods at a 500 Hz sampling frequency
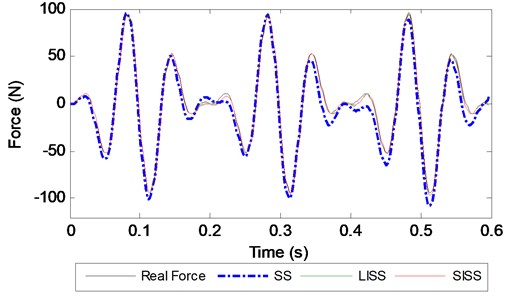
Table 2Related errors (%) in the identified force under 5 % noise with different regularization methods
Sampling frequency (HZ) | Time duration (second) | LISS | SISS | SS | ||||||
NR | L-C | GCV | NR | L-C | GCV | NR | L-C | GCV | ||
2000 | 0.2 | 3.05 | 3.26 | 3.26 | 2.61 | 2.35 | 2.35 | 5.49 | 4.92 | 4.92 |
0.4 | 5.83 | 4.26 | 3.84 | 4.89 | 3.77 | 3.52 | 8.26 | 6.16 | 6.12 | |
0.6 | 5.30 | 3.85 | 3.06 | 4.96 | 3.44 | 2.92 | 9.89 | 6.20 | 6.14 | |
1000 | 0.2 | 2.48 | 2.48 | 2.48 | 3.56 | 3.71 | 3.71 | 7.51 | 6.72 | 6.71 |
0.4 | 4.85 | 4.12 | 3.81 | 3.31 | 3.12 | 3.02 | 13.10 | 9.68 | 8.57 | |
0.6 | 9.08 | 3.36 | 2.73 | 9.81 | 5.21 | 4.32 | 15.75 | 9.96 | 8.96 | |
500 | 0.2 | 1.98 | 2.46 | 2.42 | 2.94 | 2.96 | 2.96 | 16.77 | 15.87 | 15.72 |
0.4 | 9.76 | 5.27 | 4.12 | 9.36 | 6.17 | 4.83 | 16.05 | 15.81 | 15.45 | |
0.6 | 13.17 | 6.12 | 5.08 | 12.36 | 5.69 | 4.98 | 19.30 | 16.81 | 15.11 | |
NR: no regularization. L-C: L-curve criterion. | ||||||||||
In this case, Tikhonov regularization technique is used due to the effect of the random noise. Two types of criterion for obtaining an optimal regularization parameter are employed, which are the L-curve and the GCV criterion respectively. The REs of different identified methods with L-curve and GCV criterion are listed in Table 2, and the REs without any regularization of the three methods are also listed. As seen from Table 2, the REs without regularization heavily increase compared with those presented in Section 4.1 due to the effect of the random noise, and the REs with regularization techniques are smaller than those without any regularization, especially in the situation of a low sampling frequency. The REs of all the methods with GCV criterion are a little smaller than them with the L-curve criterion for this case. Otherwise, it can be observed that the identification REs of the SS method are larger than those of the two proposed methods for the same sampling frequency and time duration, which indicates that the proposed methods based on the function interpolation have higher accuracy than the SS method in the presence of measurement noise especially when a low sampling frequency is taken.
4.3. Multiple forces identification
In this case, another three external forces are considered to act on the structure together with as shown in Fig. 2:
The acceleration sensors are arranged near these four excitations, and they are also shown in Fig. 2 as the nodes marked with a dark square, which denote the vertical measurements. A sampling frequency of 1000 Hz and a time duration of 0.6 s are used to have less discretization effect. Only the GCV criterion is adopted for the regularization due to its accuracy of this case.
The noise of 5 % level is added to the measured responses. The REs are listed in Table 3. The identified REs of the proposed methods are smaller than those of the SS method, which proves that the proposed methods based on the function interpolation have the better capability than the SS method for the case of multiple forces identification. Moreover, the CN values are computed as shown in Table 3. It is observed that as for this case of identifying multiply forces, the CN values increase 10 times more than those of identifying single force in Section 4.1, the SS method makes the CN much larger than the proposed methods, which indicates the SS method has a stronger ill-posedness.
Table 3Related errors (%) in the identified force and the condition numbers (CN) of different methods
Force | LISS | SISS | SS | |||
RE | CN | RE | CN | RE | CN | |
F1 | 15.57 | 15736 | 15.21 | 15135 | 17.29 | 21809 |
F2 | 12.23 | 11.41 | 16.96 | |||
F3 | 12.78 | 13.36 | 15.90 | |||
F4 | 9.50 | 9.27 | 16.98 | |||
4.4. White noise excitation
In this case, four forces are adopted as Section 4.3 except that the excitations are replaced with four white noise excitation having a magnitude of 75 N. A level of 5 % random noise is added to the measured responses. The REs of different methods are shown in Table 4. The REs of the LISS and SISS methods are smaller than those of the SS method, which indicates that the proposed methods are capable for the case of white noise excitations.
Table 4Related errors (%) in the identified force with white noise excitations
Force | LISS | SISS | SS |
F1 | 13.28 | 11.12 | 31.39 |
F2 | 9.00 | 11.76 | 28.86 |
F3 | 9.76 | 13.30 | 28.21 |
F4 | 13.13 | 10.46 | 28.14 |
4.5. High noise level
This case is to validate the effectiveness of the improved version of the LISS method presented in Section 3 for dealing with the situation of high noise level. Three different high noise levels are adopted, which are 10 %, 25 %, and 50 %. Four forces are adopted as the last study. The identified REs are listed in Table 5. From Table 5, we can see the RE increases with the high noise levels. The REs obtained by the ILISS2 and ILISS4 methods are the smaller than those of the LISS method, and the REs of the ILISS4 method are the smallest among all the methods. Table 5 lists the computation time of all the methods. As seen from Table 6, the most accurate ILISS4 method has the maximum computation time, which is almost 5 times than that of the LISS method. However, given the better results, the computational effort is justified.
From the case, it can be concluded that applying the improved LISS method is better than employing the LISS method with a smaller time step to obtain a more accurate result.
Table 5Related errors (%) in the identified force for high levels of noise
Noise level | Force | LISS (%) | LISS2 (%) | ILISS2 (%) | ILISS4 (%) |
10 % | F1 | 27.32 | 30.23 | 21.48 | 17.86 |
F2 | 17.75 | 18.52 | 14.95 | 12.60 | |
F3 | 22.69 | 25.53 | 19.72 | 15.89 | |
F4 | 16.84 | 17.84 | 13.33 | 11.42 | |
25 % | F1 | 52.65 | 56.94 | 45.76 | 34.19 |
F2 | 33.33 | 33.14 | 25.20 | 20.93 | |
F3 | 42.70 | 48.64 | 38.78 | 30.88 | |
F4 | 30.34 | 32.16 | 26.11 | 21.46 | |
50 % | F1 | 73.45 | 77.89 | 63.11 | 52.12 |
F2 | 47.88 | 47.90 | 37.66 | 30.89 | |
F3 | 58.41 | 69.07 | 53.42 | 45.43 | |
F4 | 45.74 | 46.04 | 34.83 | 29.04 | |
LISS2: represents the LISS method with a time step of 0.5 ( represents the time step of the LISS method) | |||||
Table 6Required computation time for different methods
Noise level | LISS (s) | LISS2 (s) | ILISS2 (s) | ILISS4 (s) |
10 % | 16.52 | 133.08 | 30.77 | 82.30 |
25 % | 17.37 | 133.54 | 30.39 | 82.76 |
50 % | 16.65 | 133.62 | 30.35 | 82.42 |
5. Experimental validation
A rectangle steel plate is validated in the section as shown in Fig. 6. The size of the plate is 650×450×1.9 mm. The physical parameters of the steel plate are as follows: The modulus of elasticity is 201 GPa, Poisson ratio is 0.3, density is 7900 kg/m3. The boundary conditions are taken as simply supported at four edges of the plate. Fig. 6 and Fig. 7 show the layout of the experimental system which includes LMS SCADAS Mobile front end, power amplifier, PCB086C03 force hammer head and PCB acceleration sensors. Modal test is firstly carried out to validate the simply supported boundary condition. Table 7 compares the frequencies of the first 8 modes between the FEM and the experiment. It can be seen the boundary condition of the plate under test well meets the requirement of simply supported condition.
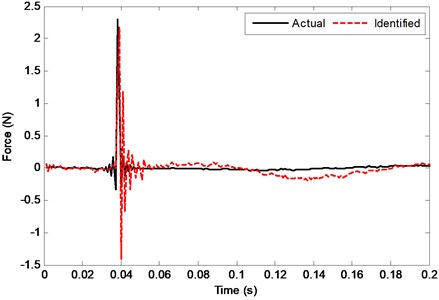
Then, identification of impact force is conducted. The impact force of the force hammer is applied at the center of the plate (325 mm, 225 mm). Two acceleration signals obtained from the PCB acceleration sensors are used for force identification, and the layout of sensors is shown in Fig. 8. According to the proposed LISS method, the impact force is identified as shown in Fig. 9. From it, it can be seen that the identified value is close to the actual measured value, which demonstrates the effectiveness of the proposed identification method.
Fig. 5The experimental rectangle steel plate
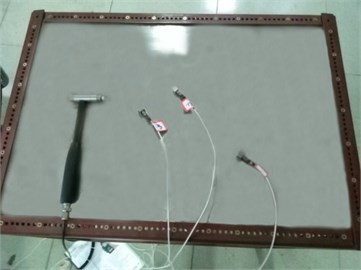
Fig. 6The test front end and power amplifier
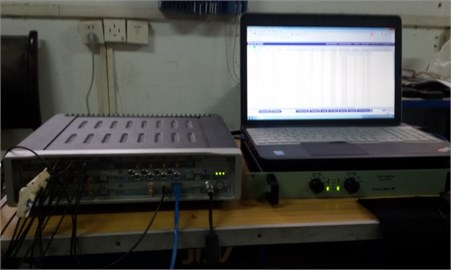
Table 7Mode frequency of a simply supported plate
FEM (Hz) | Experiment (Hz) | Error (%) | |
1 | 33.1 | 34.4 | –3.8 |
2 | 65.6 | 66.8 | –1.79 |
3 | 100.0 | 97.2 | 2.9 |
4 | 118.3 | 116.3 | 1.7 |
5 | 130.3 | 130.2 | 0.08 |
6 | 181.3 | 185.6 | –2.3 |
7 | 194.0 | 203.4 | –4.62 |
8 | 211.6 | 210.1 | 0.7 |
Fig. 8The layout of the impact force and sensors
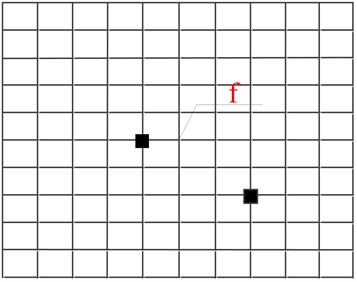
Fig. 9The actual and identified values of the impact force
6. Conclusions
The main work of this paper is introducing the function interpolation of the force in time domain into the conventional force identification method based on the state space method for the first time, and presenting two types of the interpolation functions to identify force: One is linear interpolation, and the other is sigmoid curve interpolation. Using the function interpolation of the external force, the proposed improved SS methods have better performance in force identification compared with the conventional SS method especially when the time step is large at some extent. Another contribution of this paper is extending the LISS method to deal with the case of high noise level. The least square algorithm is employed to solve the overdetermined formulation of the ILISS method. The advantage of optimal fitting of the least square algorithm is adopted to reduce the effect of the random noise to improve the accuracy of the original LISS method, which is the key point of the ILISS method.
In the future, the effect of sensor placement is required to be studied, it is reported that a good arrangement of sensors can reduce the ill-posedness of inversion computation [25, 32, 33]. In addition, this paper just considers the two points interpolation of input forces, the more points interpolation methods are also required to be studied later.
References
-
Fabunmi J. A. Effects of structural modes on vibratory force determination by the pseudoinverse technique. AIAA Journal, Vol. 24, 1986, p. 504-509.
-
Stevens K. K. Force identification problems: an overview. Proceedings of SEM Spring Conference on Experimental Mechanics, Houston, Texas, 1987, p. 838-844.
-
Parloo E., Verboven P., Guillaume P., Van Overmeire M. Force identification by means of in-operational modal models. Journal of Sound and Vibration, Vol. 262, 2003, p. 161-173.
-
Turco E. A strategy to identify exciting forces acting on structures. Numerical Methods in Engineering, Vol. 64, 2005, p. 1483-1508.
-
Vanlanduit S., Guillaume P., Cauberghe B., Parloo E., De Sitter G., Verboven P. On-line identification of operational loads using exogenous inputs. Journal of Sound and Vibration, Vol. 285, 2005, p. 267-279.
-
Law S. S., Chan T. H., Zeng Q. H. Moving force identification: a time domain method. Journal of Sound and Vibration, Vol. 201, 1997, p. 1-22.
-
Zhu X. Q., Law S. S. Identification of vehicle axle loads from bridge dynamic response. Journal of Sound and Vibration, Vol. 236, 2000, p. 705-724.
-
Zhu X. Q., Law S. S. Identification of moving loads on an orthotropic plate. Journal of Vibration and Acoustics, Vol. 123, 2001, p. 238-244.
-
Klinikov M., Fritzen C. P. An updated comparison of the force reconstruction methods. Key Engineering Materials, Vol. 347, 2007, p. 461-466.
-
Law S. S., Zhu X. Q. Moving Load Identification – Problems and Identification. Research Monograph, Taylor and Francis, London, 2011.
-
Sanchez J., Benaroya H. Review of force reconstruction techniques. Journal of Sound and Vibration, Vol. 333, 2014, p. 2999-3018.
-
Granger S., Perotin L. An inverse method for the identification of a distributed random excitation acting on a vibrating structure. Part 1: Theory. Mechanical Systems and Signal Processing, Vol. 13, 1999, p. 53-65.
-
Tanio M., Hirata Y., Suzuki H. Reconstruction of driving forces through recurrence plots. Physics Letters A, Vol. 373, 2009, p. 2031-2040.
-
Zhang E., Antoni J., Feissel P. Bayesian force reconstruction with an uncertain model. Journal of Sound and Vibration, Vol. 331, 2012, p. 798-814.
-
Ma C., Chang J., Lin D. Input forces estimation of beam structures by an inverse method. Journal of Sound and Vibration, Vol. 259, 2003, p. 387-407.
-
Law S. S., Fang Y. L. Moving force identification: optimal state estimation approach. Journal of Sound and Vibration, Vol. 239, 2001, p. 233-254.
-
Kammer D. C. Input force reconstruction using a time domain technique. Journal of Vibration and Acoustics, Vol. 120, 1998, p. 868-874.
-
Law S. S., Bu J. Q., Zhu X. Q. Time-varying wind load identification from structural responses. Engineering Structures, Vol. 27, 2005, p. 1586-1598.
-
Nordberg T. P., Gustafsson I. Dynamic regularization of input estimation problems by explicit block inversion. Computer Methods in Applied Mechanics and Engineering, Vol. 195, 2006, p. 5877-5890.
-
Mao Y. M., Guo X. L., Zhao Y. A state space force identification method based on Markov parameters precise computation and regularization technique. Journal of Sound and Vibration, Vol. 329, 2010, p. 3008-3019.
-
Law S. S., Yong D. Substructure methods for structural condition assessment. Journal of Sound and Vibration, Vol. 330, 2011, p. 3606-3619.
-
Hwang J., Kareem A., Kim W. Estimation of modal loads using structural response. Journal of Sound and Vibration, Vol. 326, 2009, p. 522-539.
-
Lourens E., Reynders E., De Roeck G., Degrande G., Lombaert G. An augmented Kalman filter for force identification in structural dynamics. Mechanical Systems and Signal Processing, Vol. 27, 2012, p. 446-460.
-
Ding Y., Law S. S., Wu B., Xu G. S., Lin Q., Jiang H. B., Miao Q. S. Average acceleration discrete algorithm for force identification in state space. Engineering Structures, Vol. 56, 2013, p. 1880-1892.
-
Wang J., Law S. S., Yang Q. S. Sensor placement methods for an improved force identification in state space. Mechanical Systems and Signal Processing, Vol. 41, 2013, p. 254-267.
-
Ito Y. Representation of functions by superpositions of a step or sigmoid function and their applications to neural network theory. Neural Networks, Vol. 4, 1991, p. 385-394.
-
Harrington P. D. B. Sigmoid transfer functions in backpropagation neural networks. Analytical Chemistry, Vol. 65, 1993, p. 2167-2168.
-
MATLAB User Guide. Mathworks Inc.
-
Tikhonof A. N. On the solution of ill-posed problems and the method of regularization. Soviet Mathematics, Vol. 4, 1963, p. 1035-1038.
-
Hansen P. C. Analysis of discrete ill-posed problems by means of the L-curve. SIAM Review, Vol. 34, 1992, p. 561-580.
-
Elden L. A note on the computation of the generalized cross-validation function for ill-conditioned least squares problems. BIT Numerical Mathematics, Vol. 24, 1984, p. 467-472.
-
Thite A. N., Thompson D. J. Selection of response measurement locations to improve inverse force determination. Applied Acoustics, Vol. 67, 2006, p. 797-818.
-
Zheng S., Zhou L., Lian X., Li K. Technical note: coherence analysis of the transfer function for dynamic force identification. Mechanical Systems and Signal Processing, Vol. 25, 2011, p. 2229-2240.
About this article
This work was supported by the National Natural Science Foundation of China (No. 51405093) and the Technology Foundation of Nantong (GY12016043).
