Abstract
Multiple parameters affect energy cost and comfort during cycling, and for some of them there is a trade-off between both phenomena. The aim of this paper is to present a methodology to evaluate the influence of different cycling conditions on energy cost and cyclist’s comfort. The proposed methodology is based on on-road tests where power on pedals and vertical accelerations are measured. The experimental data is used to calculate energy cost and comfort indices to compare different cycling conditions. A case study of the tire pressure influence on energy cost and comfort is presented.
1. Introduction
Energy cost in cycling quantifies the required amount of mechanical energy to ride a certain distance. On the other hand, comfort analyzes the vertical vibration of cyclist to avoid high levels of discomfort and fatigue. During cycling there are multiple parameters that affect both phenomena, and in some particular configurations, a decrease of energy cost can be achieved while level of vibration is increased, or vice versa. Therefore, some cycling conditions generate a trade-off between energy cost and comfort; nonetheless, several authors have investigated these phenomena as independent issues.
The quantification of the power requirement has been proposed as a method to analyze energy cost [1-3]. Some authors describe simplified models to calculate the power requirement on cycling [4, 5], while other studies estimate the power requirement based on coast-down tests [6, 7]. Furthermore, some studies use ergometers and rollers to evaluate input power under controlled environments in indoor tests. Other studies are focused on outdoor testing in more realistic scenarios; in [8, 9] the influence of cycling position and tire pressure on energy cost is evaluated using power meters.
The analysis of ride quality has become an important issue in recent years given that some levels of vibration produce discomfort and fatigue on cyclists. Some authors have evaluated the static and dynamic behavior of road bike wheels under developed test rigs [10, 11], and they have found that different tested wheels can be ranked according to their associated comfort level. However, they concluded that for cyclists’ comfort analysis it is necessary to perform tests over the whole bike-cyclist set due to the complexity of the interrelation between them. Therefore, some authors have measured vibrations on the contact points between cyclists and bike during indoor tests [12-14] and outdoor tests [15-18]. Some of them also use strain gauges to measure forces and calculate the power absorbed by the cyclist’s body, but as concluded in [14], acceleration measurement is simpler than force measurement and allows one to determine comfort level for different cycling configurations.
The aim of this paper is to present a methodology for the simultaneous evaluation of energy cost and comfort during road cycling. Different cycling conditions are tested through on-road tests and compared using indices based on power on pedals and vertical acceleration measurements. A case study is presented for the evaluation of tire pressure influence on energy cost and comfort of cyclist.
2. Methodology
The aim of the proposed methodology is to evaluate the influence that the variation of multiple parameters has on the energy cost and cyclist’s comfort. The methodology has four main characteristics. First, testing sessions are performed on-road on a given circuit; as a result, realistic conditions are evaluated. Second, the evaluation is conducted over the whole system, so the interrelationship between bike components and cyclist is taken into account. Third, results apply to the particular bike-cyclist-circuit set tested. Finally, the methodology is not intended to evaluate the physiological effects of cyclist neither regarding the metabolic energy expenditure nor fatigue levels due to vibrations.
2.1. Testing procedure
A particular bike-cyclist-set is defined to evaluate energy cost and comfort. The parameters to be studied are identified while other parameters are kept constant. Based on that, the required instrumentation is defined. For the experimental procedure, the cyclist rides on the circuit following a given speed profile of interest as many times as necessary to assess the influence of variation of parameters. The power on pedals and vertical acceleration are measured during the experimental procedure.
2.2. Energy cost indices
To determine energy cost, two indices are calculated: the mean power on pedals -Pp shown in Eq. (1) and energy cost EC shown in Eq. (2):
where T is the test time, Pp(t) is the measured power on pedals and L is the circuit length.
2.3. Comfort index
To determine the comfort of cyclist, the acceleration data on cyclist’s contact points is weighted based on the frequency weighting curves of standard ISO 2631-1 [19] which take into account the perception of the human body. Based on the weighted acceleration aw(t), the weighted r.m.s. acceleration aw is calculated as in Eq. (3):
In case of a crest factor (ratio of the peak value of aw(t) to aw) higher than 9, an alternative method such as the fourth power vibration dose value (VDV) have to be used. Eq. (4) shows the VDV calculation:
3. Case study: tire pressure influence
Tire pressure variation changes the interaction between tire and road surface; therefore it modifies energy cost and comfort. High tire pressures decrease rolling resistance and therefore energy cost. In addition, high tire pressures produce higher level of vibrations and hence less comfort [17]. The aim of this case study is to evaluate the trade-off between energy cost and comfort when tire pressure is varied following the methodology described in the previous section.
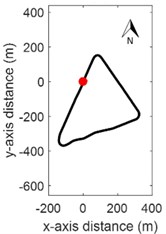
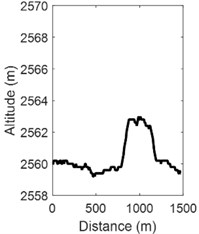
The characteristics of the bike-cyclist-circuit set are described in Table 1. The altimetry and planimetry of the circuit are shown in Fig. 1. During tests, tire pressure was varied between 3 and 8 bar with 1 bar increments while other parameters that influence energy cost and comfort were kept constant. The mass of the bike-cyclist set was leveled to 89.5 kg. The cyclist gave special attention to keeping the same position with hands on the top of the handlebar and arms fully stretched. Also, a constant gear setting was used. A GPS data logger was mounted in the handlebar to measure speed and distance. A pedal-based power meter was used to measure power directly on pedals. In addition, an accelerometer data logger was mounted on the saddle with a sampling rate of 500 Hz.
Table 1Basic characteristics of cyclist-bike-circuit set
Cyclist | Bike | Circuit | |||
Type | Healthy male triathlete | Type | Road bike | Type | Amateur training |
Age | 25 years | Materials | Aluminum: frame, wheels, seatpost, stem, handlebar. Carbon fiber composite: fork | Main surface | Asphalt |
Body mass | 76 kg | Wheel type | 700×23 C | Length | 1470 m |
Height | 1.83 m | Mass | 10.1 kg | Mean altitude | 2562 m.a.s.l |
Fig. 1Testing circuit: a) planimetry, b) altimetry
a)
b)
Tests were performed under similar environmental conditions. The temperature was in the range of 12.9±3.3 °C, the relative humidity 95±5 % and the barometric pressure 752±1 hPa. Wind speed was monitored, and no peaks above 3 km/h were reported.
The defined speed profile for each lap consisted of a nominal speed of 25 km/h during the entire circuit, with the exception of the descending section where the cyclist stopped pedaling and coasted down. The cyclist rode ten laps following this speed profile for each tire pressure. He kept the defined body position. Each lap was ridden in about 212 seconds while power on pedals and acceleration of saddle were measured.
4. Results and discussion
Based on the methodology described for tire pressure influence evaluation, the power on pedals and vertical acceleration measurements are showed. The evaluation of energy cost and comfort is presented based on the indices proposed in the methodology.
4.1. Testing results
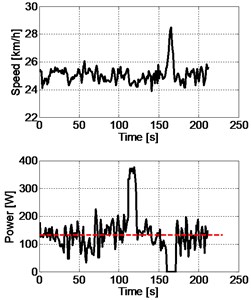
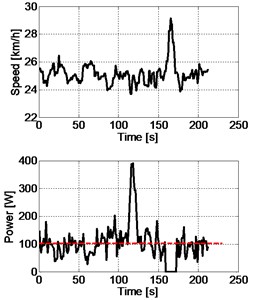
Fig. 2 shows the speed and power on pedals for one lap at 3 and 8 bar tire pressures. It can be seen that the speed was kept close to the nominal speed of 25 km/h except for the descent section where it increased. In the power measurement figures, there is a power increment due to the ascent section of the circuit, and there is a zero power interval due to the coast down during the descent section. The red dashed lines in power plots show the mean power for each lap: 132.5 W at 3 bar and 101.7 W at 8 bar.
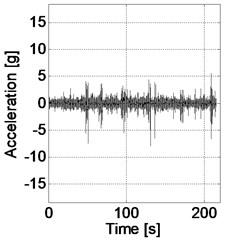
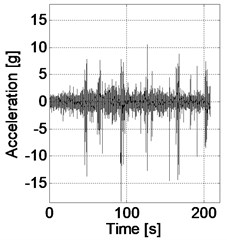
Fig. 3 shows the vertical acceleration on the saddle for one lap at 3 and 8 bar tire pressures. As expected, the vertical acceleration at 8 bar is higher than that at 3 bar tire pressure.
Fig. 2a) Speed and power on pedals for one lap at 3 bar tire pressure, b) speed and power on pedals for one lap at 8 bar tire pressure
a)
b)
Fig. 3a) Acceleration measurement on the saddle for one lap at 3 bar tire pressure, b) acceleration measurement on the saddle for one lap at 8 bar tire pressure
a)
b)
4.2. Energy cost evaluation
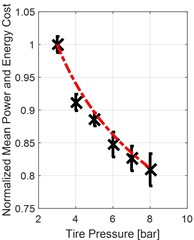
To evaluate energy cost, the two indices proposed in the methodology are calculated for each lap. The average mean power and energy cost of the 10 laps at each tire pressure is reported. An ANOVA showed that the mean power and energy cost calculation is sensitive enough to assess the influence of the tire pressure changes (p-value < 0.01). Fig. 4(a) shows the normalized mean power on pedals and normalized energy cost. The normalization corresponds to the maximum mean power on pedals value (129.6 W) or the maximum energy cost value (18.6 kJ/km) at 3 bar tire pressure. The error bars correspond to the 95 % confidence interval.
4.3. Comfort evaluation
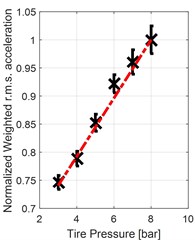
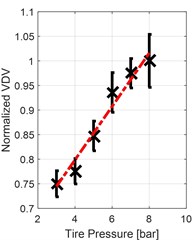
To evaluate comfort, the weighted r.m.s. acceleration is calculated as in Eq. (3). Fig. 4(b) shows the normalized weighted r.m.s. acceleration for the tire pressure range; the normalization was done based on the maximum r.m.s value of 2.77 m/s2 at 8 bar tire pressure. An ANOVA revealed that the weighted r.m.s. acceleration is sensitive enough to assess the influence of the tire pressures changes (p-value < 0.01). The crest factor (ratio of the peak value of aw(t) to aw) for all tire pressures is in the range from 19.7 to 21.3; according to ISO2631-1, it implies that high peak values are present. The VDV is used as alternative method, and it is calculated as Eq. (4). Fig. 4(c) shows the normalized VDV; the normalization was done based on the maximum value of 25.30 m/s1.75 at 8 bar tire pressure. An ANOVA revealed that the VDV is sensitive enough to assess the influence of the tire pressures changes (p-value < 0.01).
Fig. 4a) Normalized mean power on pedals; also normalized energy cost, b) normalized weighted r.m.s. acceleration, c) normalized fourth power vibration dose value (VDV)
a)
b)
c)
4.4. Energy cost and comfort relation for tire pressure variation
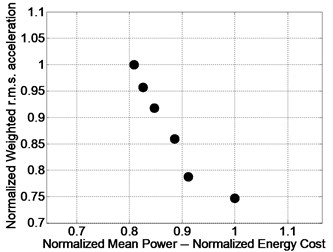
There is a trade-off between energy cost and comfort when different tire pressures are used. Fig. 5 shows the “comfort-energy cost” relation for the tested tire pressures in which each phenomenon is improved when a low value is selected. Due to the monotonic behavior of both phenomena with tire pressure, it is not possible to select a tire pressure for which one of the phenomena improves without worsening the other. Nonetheless, the proposed methodology could be extended to the evaluation of additional parameters.
Fig. 5Comfort and energy cost relation for different tire pressures
5. Conclusions
A methodology for the simultaneous evaluation of energy cost and comfort on cycling was presented. Four indices were proposed for the evaluation of both phenomena based on on-road tests with a particular bike-cyclist-circuit set. A case study for the evaluation of tire pressure influence is presented; the methodology applied proved to be enough sensitive to the tire pressure assessment. The proposed methodology can be extended to evaluate other parameters; consequently, non-dominated cycling conditions can be found and a preferred solution could be defined for purposes of training planning, cycling equipment selection and cycling components design.
References
-
Capelli C., Ardigò L. P., Schena F., Zamparo P. Energy cost and mechanical efficiency of riding a human-powered recumbent bicycle. Ergonomics, Vol. 51, Issue 10, 2008, p. 1565-1575.
-
Paton C. D., Hopkins W. Tests of cycling performance. Journal of Sports Medicie, Vol. 31, Issue 7, 2001, p. 489-496.
-
Hopker J., Jobson S. Laboratory and field assessment of cycling ability. Performance Cycling: the Science of Success, 2013, p. 40-60.
-
Whitt F. R. A note on the estimation of the energy expenditure of sporting cyclists. Ergonomics, Vol. 14, Issue 3, 1971, p. 419-424.
-
Di Prampero D. E., Cotilini G., Mognoni P., Saibene F. Equation of motion of a cyclist. Journal of Applied Physiology, Vol. 47, Issue 1, 1979, p. 201-206.
-
Candau R. B., Grappe F., Ménard M., Barbier B., Millet G. Y., Hoffman M. D., Belli A. R., Rouillon J. D. Simplified deceleration method for assessment of resistive forces in cycling. Medicine and Science in Sports and Exercise, Vol. 31, Issue 10, 1999, p. 1441-1447.
-
Grappe F., Candau R., Barbier B., Hoffman M. D., Belli A., Roullon J. D. Influence of tyre pressure and vertical load on coefficient of rolling resistance and simulated cycling performance. Ergonomics, Vol. 42, Issue 10, 1999, p. 1361-1372.
-
Lim A. C., Homestead E. P., Edwards A. G., Carver T. C., Kram R., Byrnes W. C. Measuring Changes in aerodynamic/rolling resistances by cycle-mounted power meters. Journal of Medicine and Science in Sports and Exercise, Vol. 43, Issue 5, 2011, p. 853-860.
-
Roa S., Muñoz L. On-road evaluation of energy cost on cycling: a case study for analyzing tire pressure influence. 17th International Conference on Advanced Vehicle Technologies AVT, ASME International Design Engineering Technical Conferences, 2015.
-
Petrone N., Giubilato F. Methods for evaluating the radial structural behavior of racing bicycle wheels. 5th Asia-Pacific Congress on Sports Technology (APCST), 2011.
-
Lépine J., Champoux Y., Drouet J. Technique to measure the dynamic behavior of road bike wheels. Society for Experimental Mechanics Series, Vol. 31, 2012.
-
Lépine J., Champoux Y., Drouet J. Road bike comfort: on the measurement of vibrations induced to cyclist. Sports Engineering, Vol. 17, Issue 2, 2014, p. 113-122.
-
Lépine J., Champoux Y., Drouet J. The relative contribution of road bicycle components on vibration induced to the cyclist. Sports Engineering, Vol. 18, Issue 2, 2015, p. 79-91.
-
Pelland-Leblanc J., Lépine J., Champoux Y., Drouet J. Using power as a metric to quantify vibration transmitted to the cyclist. Conference of International Sports Engineering Association, 2014.
-
Hölzel C., Höchtl F., Senner V. Cycling comfort on different road surfaces. 9th Conference of International Sports Engineering Association (ISEA), 2012.
-
Giubilato F., Petrone N. A method for evaluating the vibrational response of racing bicycles wheels under road roughness excitation. 9th Conference of International Sports Engineering Association (ISEA), 2012.
-
Vanwallghem J., Mortier F., De Baere I., Loccufier M., Van Paepegem W. Design of an instrumented bicycle for the evaluation of bicycle dynamics and its relation with the cyclist’s comfort. 9th Conference of International Sports Engineering Association (ISEA), 2012.
-
Olieman M., Marin-Perianu R., Marin-Perianu M. Measurement of dynamic comfort in cycling using wireless acceleration sensors. 9th Conference of International Sports Engineering Association (ISEA), 2012.
-
ISO 2631-1:1997(E) Mechanical Vibration and Shock – Evaluation of Human Exposure to Whole-Body Vibration – Part 1: General Requirements. International Organization for Standardization (ISO), 1997.
