Abstract
The identification of structural modal parameter is an important link in the dynamics monitoring and diagnosis for the structural health. The passive monitoring mode of piezoceramic is used to solve the natural vibration frequency identification problem of hydraulic concrete structure. Based on self-made concrete piezoelectric smart module (CPSM), a system is developed to obtain the modal parameters of hydraulic concrete structure. The CPSM is regarded as a sensor to monitor passively the structural natural vibration frequency. The method and process are proposed to identify the natural vibration frequency of hydraulic concrete structure. Based on the physical model and numerical simulation model, the rationality and feasibility of the proposed method are verified.
1. Introduction
It is known from the structural dynamics that vibration is a sensitive indicator describing the structural integrity. The structural damage can lead to the changes of physical and mechanical parameters, and then cause structural dynamic response change. To implement the dynamic diagnosis for the structural health, the structural modal parameters need to be identified and obtained.
Piezoelectric ceramic transducer has advantages such as wide frequency response range, fast response speed, simple structure, less power consumption, low cost, etc. Structural health monitoring system composed of PZT has ability to sense and detect the structural damage and the intensity changes effectively. It has been applied widely in many fields, such as civil engineering, aerospace, construction, and material science [1, 2]. The traditional research is mainly focused on reinforced concrete structures. A smart-aggregate-based damage detection method for fiber-reinforced-polymer-strengthened columns is developed [3]. The feasibility of using impedance-based damage assessment for pipeline systems is analyzed [4]. However, PZT is rarely used to monitor the health of plain concrete structure under dynamic loads.
The focus of this paper is on the natural frequency identification of hydraulic concrete structure using piezoceramic sensor. Based on self-made concrete piezoceramic smart module (CPSM), a system is designed to obtain the modal parameters of hydraulic concrete structure. The method and process are proposed to identify the natural vibration frequency of hydraulic concrete structure. The numerical and physical model tests are implemented.
The paper is organized as follows. Section 2 introduces the design of CPSM and CPSM-based structural health monitoring system. Section 3 presents the time domain identification method obtaining the natural frequency of hydraulic concrete structure. The physical and numerical examples are used to demonstrate feasibility and advantages of the proposed method in Section 4. Finally, some conclusions are drawn in Section 5.
2. Concrete piezoceramic smart module design and its monitoring theory
2.1. Monitoring principle of structural health based on piezoceramic
There are two implementation patterns contained during the structural health monitoring and diagnosis with piezoceramics, active and passive monitoring. Active monitoring at present mainly has impedance-based analysis and wave-based analysis two methods included; passive monitoring mainly includes the impact load, structure vibration modal monitoring and passive monitoring based on acoustic emission.
2.1.1. Combination mode between piezoceramic patch and monitored structure
When piezoelectric ceramic chip is used as the main sensor element of structural health monitoring and diagnosis, the common two combination ways include surface-mounted type and embedded type. What specific kind will be taken mainly depends on the material characteristics of body structure, and the monitoring mode adopted, etc.
1) The surface-mounted type.
The way is that pasting the piezoceramic patch directly on the surface structure after grinding and wiping the contact parts between piezoceramic sensors and the structure. The combination has its positive virtues to operate easily, and the stress distribution on the piezoceramic patch is simple. On the other hand, as a result of the sensitivity of piezoelectric materials on temperature and humidity, etc. greater deviation monitored will come from sticking patches on the structure surface. That is to say, it is easy to lead to the damage of piezoceramic patch because of the external factors such as natural disasters or human activities.
2) The embedded type.
Embedded type is mainly used for reinforced concrete structure, it buried the piezoceramic patch into the body structure, so as to attenuate some effects from environment outside such as temperature, humidity on piezoelectric ceramic piece, and the ontology structure can provide its protection for them, which extend the service life of piezoceramic patch greatly, then the effectiveness of long-term health monitoring process can be guaranteed. Since the material is so fragile to resist the risks from the construction of the ontology structure, the direct embedment is forbidden. Effective encapsulation of piezoceramic patch is key technology when the embedded type is utilized.
2.1.2. Test process of structural modal with piezoceramic
The basic principle of structure vibration modal monitoring can be expressed as follow: At first, paste the patches on the surface of the structure or bury them into body, with the piezoceramic, to obtain the structural vibration signal under the excitation of the external environment, then process the vibration signal received for the vibration modal analysis. The task of modal analysis is that obtain modal parameters of the monitoring structure, such as natural frequency, modal vibration mode, stiffness and modal damping ratio, etc.
In passive monitoring, the piezoceramic patches embedded in or pasted on the surface are regarded as an acceleration sensor used in gm modal test. That is to say the piezoceramic is utilized to obtain the vibration signals of the monitored structure under the excitation signal for the structural experimental modal monitoring. The flow diagram monitoring structural modal with piezoceramic is shown in Fig. 1.
Fig. 1Monitoring flowchart of structural modal with piezoceramic

2.2. CPSM design and preparation
The proposed CPSM in this paper is mainly composed of concrete specimens, and the piezoceramic patches buried in, etc, the prepared CPSM is utilized as the mean to detect the health and diagnosis the damage of hydraulic concrete structure by the fluctuation analysis. Therefore, the shape design and preparation process of CPSM should be developed according to the monitored object structure and monitoring requirements, etc, to make it more suitable for monitoring of hydraulic concrete structure.
2.2.1. Piezoceramic patch production
CPSM needs both the abilities of transmit and receive ultrasonic signals. So the transmitted power and sensitivity factors must be considered during the selection of piezoceramics. In this experiment, the piezoceramic patches adopted is the PIC151 from the PCB company.
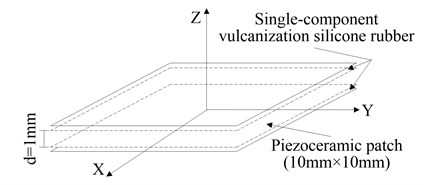
The flexibility, economy and emission of ultrasonic are considered. The piezoceramic patch can be cut into a specification as follows: length×width×thickness = 10 mm×10 mm×1 mm. Then clean the cut piezoceramic patch with alcohol to remove the oxide film on the surface and ensure that the piezoceramic smart module has its good performance in charge transfer function; after being surface drying, welding wire and keeping the welding point small enough to make sure that the surface waterproof layer coated could be thin enough. At last, clean the surface again with alcohol after welding finished. Since the piezoceramic is relatively brittle itself, and outsourcing concrete is a complicated phase composite material, if the piezoceramic patch directly buried in concrete module without any measure, concrete volume will gradually shrink and produce contraction stress in the process of concrete condensation, which will lead to the stress concentration formed on the piezoceramic patches embed, and damage the pieces. Therefore, by covering a layer of single-component vulcanization silicone rubber on the periphery of piezoceramic, the integrity of patches in the concrete can be protected, as shown in Fig. 2.
Fig. 2Protective measures of piezoceramic patch
Due to outsourcing concrete of piezoceramic have only the effect of a transfer stress, rather than the body of the bearing, so the materials, such as the coarse aggregate, as well as steel, is not added into during the production, cemesnt mortar is adopted during the pouring of PZT, which consist of water, fine aggregate, cement (C32.5 Portland cement) at the ratio of 1:2.9:2.09. Such processing can reduce the local stress concentration of the piezoceramic patches, which produced by uneven distribution of the coarse aggregate, steel and other properties of ingredients.
One-component vulcanization silicone rubber is soft, and is good at water proofing, and can avoid stress concentration phenomenon better that may occur on piezoceramic patches embedded in concrete.
2.2.2. Pouring process of CPSM
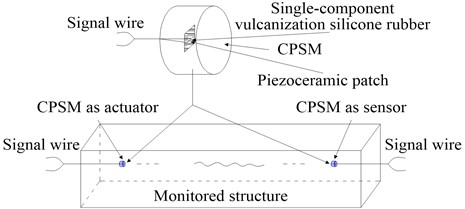
CPSMs are sensor components, running in the most front of the health monitoring system in the whole hydraulic concrete structure, as the means to detect the physical change and environmental effect. With the pouring of CPSM, various factors should be taken into consideration comprehensively, such as the nature that the piezoceramic patch is damage easily and the application properties of CPSM receiving and transmitting signals and so on. In this paper, the shape of CPSM is determined to cylinder. Considering other instruments related and comparative analysis, CPSM in the experiment is poured into 25 mm×(25-30) mm cylinder, as shown in Fig. 3. The poured CPSM needs be cured in the standard curing box for 28 days. When the concrete intensity is increased to a certain level, the manufactured CPSM can be used to monitor structural strength and damage.
Fig. 3Basic components of CPSM
2.3. Structural health monitoring system based on CPSM
The signal generating device, signal acquisition device and CPSM form a health monitoring system of concrete structure.
This experiment adopts the dSPACE (digital Signal Processing and Control Engineering) system which is used for signal transmission and acquisition. dSPACE system is a platform for the development of control system and structural testing based on MATLAB/Simulink, it can be integrated to realize that facilitate the generation of digital signal and the control of system, it connected with the MATLAB/Simulink seamlessly and equipped with the hardware system with high-speed computing power. Real-Time Interface is adopted to compile the code for the Simulink model, with the aid of dSPACE Control Desk, for integrated management of the testing process, in order to realize the real-time testing, control and processing function.
The dSPACE system adopted in this experiment is the DS1103 system from dSPACE company, the signal emission of its built-in function of integrated I/O and D/A module at 8 channel can be achieved through Simulink, signal received of A/D module at 20 channel also can be achieved by Simulink.
Fig. 4Data flow in structural health monitoring system based on CPSM

dSPACE system can be affected easily by the outside noise during the experiment, in the experiment, only the A/D channels of dSPACE system is for numerical signal acquisition; Agilent arbitrary waveform generator is for signal generation, they are used to drive the piezoceramic smart module; meanwhile other CPSM embedded in the ontology structure as sensor for receiving signals; the leakage phenomenon is inevitably during process of making concrete piezoceramic smart module, so as to the received signal is likely to be mixed with the frequency of the alternating current, for measuring the amplitude of stress wave that go through the oscilloscope, the sensor should be connected to the digital filter, the wave through the system can be used for structural health monitoring. The specific flow diagram of monitoring process can be shown in Fig. 4.
3. Time domain method identifying natural frequency of hydraulic concrete structure
There are two main identification methods about modal parameters for signals obtained through the test, namely frequency domain analysis and time domain analysis method. For the modal parameter identification, frequency domain analysis method is influenced by the length of the measurement data, at the same time, the noise mixed in measuring signal also affects the measurement precision of transfer function. To a certain extent, the time domain analysis method avoids the shortcoming of frequency domain analysis method, when the measured signal is a stable, normal distribution, zero mean random time series, it can accurately reflect the characteristic of the signal itself. That is to say, the time-domain analysis method is suitable for processing the shorter dates.
Time domain identification methods of modal parameters includes time domain least squares, ITD method, STD method and complex index method (Prony method), time sequence analysis method at ARMA model, etc. [5-7]. This paper adopts the NExT method to obtain the cross-correlation function of any two points in the structure under random excitation, then take the cross-correlation function as input dates to extract the structural test modal parameters via the ITD method.
3.1. NExT method
NExT method (Natural Excitation Technique) is also known as natural stimulation technology, the basic principle is that the cross-correlation function of any two points in the structure has a similar expression with the impulse response function under random excitation, after obtaining the cross-correlation function responded to between two points, then identify the modal parameters by using the modal parameter identification of time domain method.
At first, the vibration response signal is processed with the cross-correlation function, during the modal parameters identification, which is based on multipoint processing, one measuring point should be selected as reference, then calculate the cross-correlation function of other points with the point. The cross-correlation function received above is regarded as input data to ITD method. The calculation of the cross-correlation function needs to calculate the cross-power spectrum of the measured signal firstly, then the measured cross-correlation function will be obtained by Fourier inverse transformation.
For the linear system with N degrees of freedom, when the point k in the system is under the excitation fk(t), and the response xik(t) of the point i can be expressed as:
where ϕir is the first r order modal vibration mode of the point i; αkr is a constant only with incentive point k and modal order r.
When the point k is motivated by the unit impulse force, the impulse response hik(t) of the point i can be represented as:
The incentives fk(t) is inputted to the point k, responses the point i and j of system obtained after testing are respectively xik(t) and xjk(t), the cross-correlation function between the two responses is shown as follows:
=∑2Nr=1∑2Ns=1ϕirϕjsαkrαks∫t-∞∫t-τ∞eλr(t+τ-p)eλs(t-q)E[fk(p)fk(q)]dpdq.
Assume that power spectrum of incentives f(t) is uniformly distributed over the whole frequency domain. Based on the definition of correlation function, there is:
where δ(t) is for the pulse function; αk is a constant associated with the point k incented only.
Substituting Eq. (3) into Eq. (4), follow on integrating, as shown below:
Eq. (5) can be simplified as below:
Eq. (6) is modified as:
where bjr=∑2Ns=1ϕjsαkrαksαk[-1/(λr+λs)] is a constant defined only to the reference point j and the modal order time r.
3.2. ITD method identifying time domain modal parameters
ITD method (The Ibrahim Time Domain Technique) is an identification method of modal parameter utilized for displacement of structural free vibration responses, velocity or acceleration time-domain signal. The basic principle of ITD method: free decay response from the multi-degrees of freedom system with viscous damping linear system, it can be regarded as the basis of the modal combination theory in each order structure. According to the free attenuation response signal of structure, three different delay sampling is taken for the construction of augmented matrix which is based on the data come from structure free response under certain frequency adopted, the complex exponential relationship between the response value and characteristic value is used to build the mathematical model of the characteristic matrix, then to solve the eigenvalue problem, after obtaining the characteristic value and characteristic vector of data model, the modal parameter of system could be received on the basis of the relationship between eigenvalues.
The multi degree vibration equation of the structure:
where M, C, K is mass matrix, damping matrix and stiffness matrix, respectively; δ is for the displacement matrix.
The results of Eq. (8) can be expressed as:
where δ(t) is for the free vibration response vector; φ is the eigenvector matrix namely modal shape matrix est=[es1tes2t…es2Nt], sr is the eigenvalue of the r order; N is for the number of degrees of freedom, namely the modal order number.
The follows can be obtained from Eqs. (8) and (9):
The small damping linear system is affected by the characteristic root of Eq. (10), as shown below:
where ωr is to the inherent circular frequency of corresponding r order modal; ξr is the corresponding damping ratio.
The free vibration response of the measuring point i at the moment tk can be represented as a collection form of separate order modal response:
where ϕir is the first i component of the r order modal vector ϕr; M is two times of the modal order of system, namely, M=2n.
When the actual measurement point is far less than 2 times of the system freedom degree, constructing a virtual point from actual measuring point through delay method, integer times of the sampling time interval is adopted as time delay, when the delay is equal to the sampling time interval:
The response matrix ΔM×L is built based on the response value of the free vibration made by M points in L different times of the actual measuring point and virtual one, the relation of the response matrix is established as follows:
The response matrix built by the free vibration response value after the delay Δt from M measured points and the virtual points at L different moments can be expressed as:
where ˜ΦM×M=ΦM×MαM×M.
Eqs. (14), (15) lead to:
Cancel Λ, the function can be lead to:
where A is the unilateral least squares solution of the equation AΔ=˜Δ.
The two expressions of pseudo inverse method of matrix A as shown below:
The th order eigenvalue of matrix , the corresponding eigenvectors is the th column of matrix. The value received is satisfied for:
Thus modal frequency and damping ratio of the system obtained, that is:
4. Experimental analysis of physical model and numerical model
In order to fully verify rationality and feasibility of identifying the natural frequency of hydraulic concrete structure based on CPSM, numerical model and physical model test of concrete gravity dam are adopted, and compared the test results of concrete gravity dam model based on CPSM with the test results of traditional technology (PCB accelerometer) and the results of finite element numerical simulation.
4.1. Physical model experiment of natural frequency identification
4.1.1. Experiment design
In order to minimize interference to the CPSM signal, the same water-cement ratio (Water: fine sand: cement= 1:2.9:2.09) as piezoceramic module is adopted for improving the quality of the CPSM signal, The concrete gravity dam model poured as shown in Fig. 5. For the contrast and analysis of results, 6 PCB acceleration sensors and four piezoceramic smart modules mentioned in Section 2.2 are installed on the model as shown in Fig. 5.
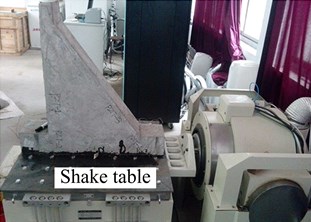
To maintain rigid cement between the concrete gravity dam and the shake table, the bottom of concrete gravity dam is spliced on the shake table with the epoxy resin, so that concrete gravity dam model can be incented with the output signal from the shake table, the random noise signal output from table is relatively rich ranged from to 100-2000 Hz, it is easy to inspire the natural frequency of structure during the different orders range. Model test device is shown in Fig. 6.
In this paper, different equivalent acceleration is utilized to control the energy size of the input signal, six equivalent accelerations such as 0.5 g, 1.0 g, 1.5 g and 2.0 g, 2.5 g and 3.0 g are received for controlling the energy size of input. In theory, the greater the equivalent acceleration the table output, the higher order of natural vibration frequency of the model is inspired.
Fig. 5Dam model with sensors
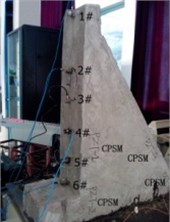
Fig. 6Model test device
4.1.2. Experiment result analysis for natural frequency of physical model
During the experiment, the white noise excitation is adopted and excitation frequency is from 100 Hz to 2000 Hz, the system of dSPACE data acquisition is utilized for monitoring and data collection, sampling frequency is 4000 Hz. The excitation direction of white noise is vertical to the axis of the dam, which is expressed as a horizontal in Fig. 6.
Under the equivalent vibration acceleration of 2.0 g, vibration signal from CPSM and PCB is utilized as a sample for analysis. Due to the frequency of white noise excitation ranges from 100 Hz to 2000 Hz, the modal frequency greater than 200 Hz of the model is selected for comparison analysis considering the great influence on the low frequency.
The reference point needs to be selected for identifying the modal parameters based on NExT method, as shown in Fig. 5, known from the CPSM piezoelectric smart module arrangement of the concrete gravity dam model, PZT-2-2 located closely to the shake table, the vibration effect is small, it can be used as a reference, such a case, the cross-correlation function of PZT-1-1, PZT-1-2, PZT-2-1 relative to the PZT-2-2 through the NExT method is available as shown in Fig. 7.
Fig. 7Cross-correlation function curves (CPSM method)

The cross-correlation function values calculated as input data to ITD time domain modal parameter identification, the impulse response function curves is shown in Fig. 8 shows respectively.
Through the NExT method and ITD, the CPSM signals of passive monitoring of concrete structures are fitting to results as shown in Figs. 7 and 8. It is known from Fig. 8 that the data collected with the CPSM passive technology can be very regular.
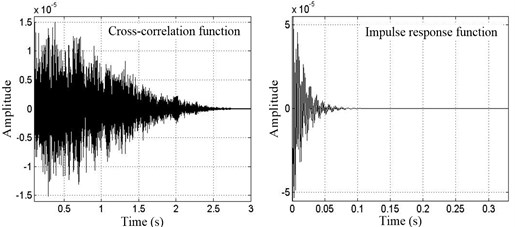
As the same way, select 2# point as reference to analyze the acceleration signal acquired with PCB accelerometer, the results are shown in Fig. 9.
The modal parameter of concrete gravity dam is extracted through ITD method and NExT time domain model, considering the inevitably occurred leakage phenomenon during CPSM production process, removed the ac frequency 50 Hz contained in the frequency components. With the complete structure and equivalent acceleration of 2.0 g, modal parameters obtained by the CPSM and the PCB acceleration sensor, respectively are shown in Table 1.
Fig. 8Impulse response function curves (CPSM method)

Fig. 9Cross-correlation function and impulse response function curves between 1# and 2# points (PCB)
4.2. Numerical model experiment of natural frequency identification
Firstly, concrete compressive strength test is used to collect the concrete elasticity modulus, on the basis, the finite element ANSYS is utilized for the analysis of concrete gravity dam modal to obtain different order frequency of the concrete gravity dam.
4.2.1. Natural frequency analysis
Damping has little impact on the natural frequencies and mode shapes, it is usually ignored during calculating the natural frequencies and mode shapes, equation of motion to free vibration without damping can be obtained as follows:
This is a homogeneous linear differential equation with constant coefficient, the form of the solution as below:
Substitute Eq. (22) into Eq. (21), lead to the homogeneous equation as follows:
During the free vibration, each point amplitude of structure is zero incomplete, so the determinant of a matrix in brackets on the left of Eq. (23), must be equal to zero:
Structural stiffness matrix and mass matrix are both order matrix, Eq. (24) is an algebraic equation of order about , it called the characteristic equation of structural free vibration, is referred as the characteristic value. This equation can solve eigenvalues, substituting it into Eq. (23), it can be worked out with values , is known as the eigenvector. represents the autooscillation circular frequency of free vibration frequency without damping, is the th natural frequency of the structure, namely the th vibration mode of the structure.
Table 1First eight orders of modal frequency (Hz)
Modal order number | 1 | 2 | 3 | 4 | Remarks |
PZT-1-1 | 446.18 | 477.62 | 857.27 | 1117.54 | Relative error 1 represents the relative error between CPSM and PCB. Relative error 2 represents the error between CPSM and ANSYS. Relative error 3 represents the error between PCB and ANSYS. |
PZT-1-2 | 454.17 | 513.81 | 860.25 | 1133.32 | |
PZT-2-1 | 418.93 | 493.00 | 858.74 | 1084.51 | |
PCB | 450.85 | 565.40 | 823.29 | 1056.19 | |
ANSYS | 410.20 | 499.80 | 1004.40 | 1077.00 | |
Relative error 1-1 (%) | 1.04 | 15.53 | 4.13 | 5.81 | |
Relative error 1-2 (%) | 0.74 | 9.12 | 4.49 | 7.30 | |
Relative error 1-3 (%) | 7.08 | 12.81 | 4.31 | 2.68 | |
Relative error 2-1 (%) | 9.91 | 13.13 | 18.03 | 1.93 | |
Relative error 2-2 (%) | 10.72 | 2.80 | 14.35 | 5.23 | |
Relative error 2-3 (%) | 2.13 | 1.36 | 14.50 | 0.70 | |
Relative error 3 (%) | 9.91 | 13.13 | 18.03 | 1.93 | |
Modal order number | 5 | 6 | 7 | 8 | |
PZT-1-1 | 1336.34 | 1566.66 | 1663.77 | 1836.04 | |
PZT-1-2 | 1336.82 | 1567.58 | 1662.33 | 1836.82 | |
PZT-2-1 | 1337.74 | 1565.62 | 1662.50 | 1838.71 | |
PCB | 1418.42 | 1546.36 | 1605.90 | 1818.75 | |
ANSYS | 1199.80 | 1369.00 | 1522.70 | 1783.90 | |
Relative error 1-1 (%) | 5.79 | 1.31 | 3.60 | 0.95 | |
Relative error 1-2 (%) | 5.75 | 1.37 | 3.51 | 0.99 | |
Relative error 1-3 (%) | 5.69 | 1.25 | 3.52 | 1.10 | |
Relative error 2-1 (%) | 18.22 | 12.96 | 5.46 | 1.95 | |
Relative error 2-2 (%) | 11.42 | 14.51 | 9.17 | 2.97 | |
Relative error 2-3 (%) | 11.50 | 14.36 | 9.18 | 3.07 | |
Relative error 3 (%) | 18.22 | 12.96 | 5.46 | 1.95 |
4.2.2. Natural frequency calculation
The following method is commonly used to determine the specific numerical of mode in the practical work.
1) The normalized mode: if the th item is 1, i.e. , then ;
2) Regularization mode: assume a mode obtained , and , then the regularization mode of vibration can be shown as .
In mathematics, Eq. (23) is called the problem of generalized eigenvalue, usually written as:
Eq. (25) can be modified to:
The methods of solving the generalized eigenvalue equation usually can be divided into two categories, one is the classical method, such as Jacques ratio method, find transformation matrix to make all vice element disappear, the characteristic of method is obtained all the frequency and vibration mode at the same time, obtain an integrated solution at one time, and have a available standard procedure, but such method is not very well when the order is very big; the second method is iterative method, the subspace iteration method, etc. The subspace iteration method is a most commonly and effective method for solving large matrix eigenvalue problem, it is regarded as a mean widely used in finite element analysis of structural dynamics, the function of the iterative process as shown below, until the two results of iterations before and after are close enough:
4.2.3. Structural natural frequency identification by modal analysis
Modal analysis is an approximate method in the study of structural dynamic characteristics. The vibration modal is the inherent characteristics of the elastic structure. Through modal analysis, in a certain susceptible range, the basic characteristics of each order modal can be leant, obtain the actual vibration response of the structure under the relevant spectrum and various effects from external or internal. Then the modal parameters can be received such as the natural frequency, modal mass, modal stiffness, modal damping and the modal vibration mode of the structure. In this article, only the method of establishing a finite element model to identify the inherent frequency of structure is utilized to evaluate the feasibility of structure modal test analysis with CPSM.
Fig. 10FEM mesh of dam model
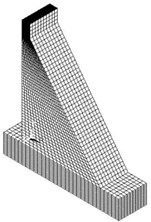
Table 2Natural frequency obtained by ANSYS (Hz)
Order | Frequency | Order | Frequency |
1 | 410.20 | 5 | 1199.80 |
2 | 499.80 | 6 | 1369.40 |
3 | 1004.40 | 7 | 1522.70 |
4 | 1077.00 | 8 | 1783.90 |
The FEM mesh of the concrete gravity dam model with ANSYS is built as shown in Fig. 10. Solid226 and Solid65 elements are chosen as the piezoelectric and concrete material elements separately. The contact analysis of rigid body-soft body is chosen in ANSYS contact analysis for the different elastic modulus values between concrete and piezoelectric. TARGET170 element is selected for “Target face” of the polarization direction of the piezoelectric plate. The concrete contact face with the piezoelectric plate is chosen as the “contact face” and the CONTA174 element is applied. The face to face contact pair is built. The friction coefficient is set 0.7 between piezoelectric and concrete. The piezoelectric and concrete are considered as the linear elastic materials. Through the concrete standard cube compressive strength test, the elastic modulus of concrete is 14.27 GPa. The density of concrete is 2100 kg m-3.
Due to random vibration excitation ranges from 100 Hz to 2000 Hz, the extraction of each order natural frequency within the scope is significant, with the aid of ANSYS analysis, the first eight order modal frequency obtained of the concrete gravity dam model as shown in Tables 1, 2. The finite element model evaluation calculation of the modal natural frequencies, Table 2, indirectly embodies the uncertainty extent of experimental process.
Through the finite element analysis and Table 2, the first-order modal natural frequency of concrete gravity dam model can reach to 410 Hz.
4.3. Contrast analysis for experimental results of numerical and physical models
1) Compared with the first 8 order modal frequency obtained between CPSM and PCB accelerometer, the difference of other each order modal natural frequency is small except the second order modal, relative error are mostly below 5 %.
2) Compared the experimental modal identification value from CPSM with the ANSYS numerical analysis results, the 3th, 5th, and 6th order natural frequency of vibration is the relative error (>10 %) the difference of natural frequency are more large than other order modals and PCB acceleration sensor also has a similar situation.
Overall, the structure modal frequency acquired through CPSM and PCB test access are at high similarity, but both have bigger difference with the modal frequencies from ANSYS numerical simulation, the errors may be caused by ANSYS numerical simulation and the Poisson ratio also failed to pass the test measurements, just get the value based on the experience of previous studies. As the analysis shown above, vibration signal of structure from the concrete piezoceramic smart module CPSM, and then using the received signal to identify the structure modal parameter is feasible.
5. Conclusions
Reliable access to structure natural frequency and other modal parameters, it is the premise of structural health monitoring and diagnosis, with the help of gravity dam model test, this paper studies the natural frequency identification of hydraulic concrete structure with CPSM, through the comparison and analysis with the results from the analog test and the traditional methods, verify the feasibility and effect of the methods described above.
1) The production process of CPSM is investigated, discussed the protective measures of piezoceramic patch, the key techniques include outsourcing material composition and casting, and design a structural health monitoring system with CPSM.
2) In this article, analyzed the identification principle of the structure natural frequency by combining the NExT method with ITD method, interpreted the recognition process, namely the NExT method is used to calculate the cross-correlation between two points for collecting signal by use of CPSM or PCB and the cross-correlation function is regarded as input data, then recognized the natural vibration frequency of different orders with the aid of ITD method.
3) The identification of modal natural frequencies to measurement data based on CPSM and PCB accelerometer is analyzed with numerical simulation results. It is known that the extraction results between the CPSM and PCB accelerometer experimental modal natural frequency are similar. The experimental results demonstrate that the self-made CPSM in extracting structure natural frequency is feasible.
References
-
Song G., Gu H., Mo Y. Smart aggregates: multi-functional sensors for concrete structures-a tutorial and review. Smart Material and Structure, Vol. 17, Issue 3, 2008, p. 1-17.
-
Park G., Sohn H., Farrar C. R., Inman D. J. Overview of piezoelectric impedance-based health monitoring and path forward. The Shock and Vibration Digest, Vol. 35, Issue 6, 2003, p. 451-463.
-
Howser R., Moslehy Y., Gu H., Dhonde H., Mo Y., Ayoub A., Song G. Smart-aggregate-based damage detection of fiber-reinforced-polymer-strengthened columns under reversed cyclic loading. Smart Materials and Structures, Vol. 20, Issue 7, 2011, p. 1-9.
-
Park G., Cudney H., Inman D. J. Feasibility of using impedance-based damage assessment for pipeline systems. Earthquake Engineering and Structural Dynamics Journal, Vol. 30, Issue 10, 2001, p. 1463-1474.
-
Dolatshahi K. M., Rofooei F. R. Inverse vibration problem forun-damped 3-dimensional multi-story shear building models. Journal of Sound and Vibration, Vol. 333, Issue 1, 2014, p. 99-113.
-
Su H. Z., Hu J., Tong J. J., Wen Z. P. Rate effect on mechanical properties of hydraulic concrete flexural-tensile specimens under low loading rates using acoustic emission technique. Ultrasonics, Vol. 52, Issue 7, 2012, p. 890-904.
-
Zhang J., Ouyang H., Yang J. Partial eigenstructure assignment for undamped vibration systems using acceleration and displacement feedback. Journal of Sound and Vibration, Vol. 333, Issue 1, 2014, p. 1-12.
About this article
This research has been partially supported by Jiangsu Natural Science Foundation (SN: BK2012036), National Natural Science Foundation of China (SN: 51179066, 41323001, 51139001), the Doctoral Program of Higher Education of China (SN: 20130094110010), Non-profit Industry Financial Program of MWR (SN: 201301061, 201201038), Open Foundation of State Key Laboratory of Hydrology-Water Resources and Hydraulic Engineering (SN: 20145027612).
