Abstract
The paper presents a procedure to precisely estimate the natural frequencies of structures. It implies the acoustic excitation of the structure and the evaluation of the frequencies from the response signals, involving an advanced method developed by the authors. The study is performed on a cantilever beam. To demonstrate the efficiency of the contrived procedure, the values of the frequencies by applying this procedure are compared whit those obtained by standard frequency estimation made for the response to an impulsive excitation.
1. Introduction
A precise evaluation of the natural frequencies of structures represents a critical issue in various technical fields. To this aim, the structure is excited and the response signal is acquired and processed to extract the natural frequencies [1, 2]. There are two ways to intentionally make a structure to vibrate. The first excitation type implies an impulse, produced either by hitting the structure for instance with an impact hammer or by moving the structure out from the rest position followed by releasing the force that caused the displacement. The typical response to an impulsive excitation is a free damped vibration [3]. The second excitation type is based on applying a variable force for the whole test duration [4]. The evolution in time of this force can be harmonic, sine-based or random [5-7]. In all cases, in order to ensure a linear of the structure, tests must be performed at a low level of excitation.
Theoretical and practical aspects of modal analysis are widely discussed in [8-10]. Because applying impulsive forced require simple equipment and implies low costs, this excitation technique is largely used. A broadband response is obtained, but a rapid decrease of the amplitudes of higher-order modes is noticed [11]. Also, a poor signal to noise ratio (SNR) and bead repeatability limit the precision of the method. Excitation with sine-based signals permits controlling the energy transferred to the structure. This focused energy transfer reduces the effect of noise and ensures a good repeatability of the experiments. The disadvantage is the extensive time necessary to extract several frequencies, because each frequency must be approached separately.
In previous studies [12, 13], we developed an algorithm to accurately evaluate the frequencies of signals achieved by measurements. In this paper, we introduce an acoustic excitation method that transfers the energy to the structure in a narrow frequency band and ensures high-quality signals to be processed for frequency evaluation. The results obtained involving the proposed method are compared with those achieved from impulsive excitation.
2. Materials and methods
Our tests have aimed to show the advantage of using an acoustic excitation instead of a classical mechanical excitation. Mechanical contact at impact generates traveling waves with a wide range of frequencies that interfere with their own reflections generated at the contact with the fixed end. All these mechanical waves are summing whole the time, resulting in a non-linear behavior and also in a signal to noise ration of low value. Energy pendulum testers of high performance can avoid many inconveniences, importantly diminishing the non-linearity, but not entirely. Therefore, we tried to develop a non-contact method, which make use of sound waves with specially tuned features in order to achieve clean values for the vibration modes.
To have a reference and comparing values, two excitation methods were implied: a classical one, which presumes hitting the beam by hammer, and our proposal that supposes a short-time sine sound wave excitation.
The classical method can assure a response signal having a broad frequency range, but without controlling the amplitudes of the vibration modes. Thus, certain vibration modes are hardly to excite and also for other ones not enough amplitude can be accomplished. Another disadvantage is the low excitation level that has to be maintained to avoid the non-linearity of the system [15].
The proposed excitation method implies a sine acoustic waves that interfere with the beam surface in an antinode area. The time and the amplitude of excitation are tuned so that to not produce non-linearity or the perturbation of the natural vibration mode [15].
The vibration signal achieved from the beam is analyzed in two ways: a classical discrete Fourier transform DFT, providing low frequency resolution, and a previously developed method by the authors, which assure a high frequency resolution in the spectrum [14]. First analysis shows the effect of low resolution in frequency value reading, and the second one highlights the advantage of short-time acoustic excitation performing.
Test bench was thought as a system, consisting of three subsystems: mechanical hardware, acoustic excitation hardware and acoustic signal generation software, and software vibration signal acquisition and processing.
Mechanical subsystem has been structured to perform tests on a cantilever beam B fixed at the right-side end (F), they are visible in Fig. 1. The beam physical-mechanical properties are presented in Table 1.
Table 1The geometry and the physical-mechanical properties of the analyzed cantilever beam.
Length L [m] | Width B [m] | Thickness H [m] | Young modulus E [N/m2] | Mass density ρ [kg/m3] | Poisson ratio ν [-] |
1 | 0.05 | 0.005 | 2·1011 | 7850 | 0.3 |
The mechanical subsystem is completed by an accelerometer sensor S, type piezoelectric Kistler 8772 that transforms mechanical vibrations in electric voltage variation, also presented in Fig. 1, in the real test configuration.
Fig. 1Mechanical set up of the test bench
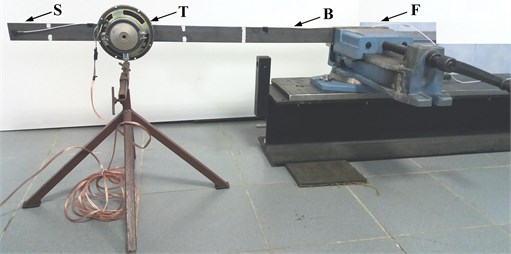
Acoustic excitation subsystem includes an acoustic transducer T driven by an amplifier (Fig. 1), producing the excitation sound waves, a sound amplifier A (Fig. 2), which amplifies the electric sine signal for the acoustic transducer, and the PC1 (Fig. 2) that transmits an analog sine signal from a software sound generator via headset plug to the sound amplifier.
Main features of the acoustic transducer and the sound amplifier are:
• Acoustic transducer: frequency band 2 to 1500 Hz, 50 W power and 4 Ω impedance;
• Sound amplifier: frequency band 1 to 45000 Hz, power amplification 2×200 W and 4 Ω output impedance.
Fig. 2Hardware presentation of the acoustic excitation, acquisition and analysis subsystems
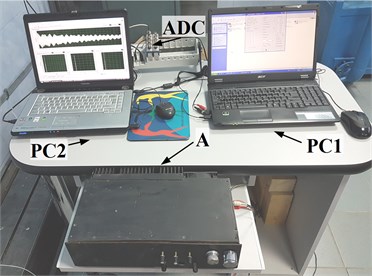
Vibration signal acquisition and processing subsystem from the hardware point of view includes only PC2 (Fig. 2), but it performs two things: vibration signal acquisition and data processing.
Vibration signal acquisition way supposes the vibration signal acquiring from the sensor S and its analog-to-digital conversion of by the analog-to-digital converter ADC (NI cDAQ-9172 of 16 bits resolution and 100 kSps), which transmits the converted signal via data protocol to the second personal computer PC2. LabVIEW software stores data in a desired file by the special features DAQ Assistant and Write to Measurement File.
Vibration data processing has been also performed in LabVIEW, making use of two analysis ways: a regular DFT and the own developed iterative algorithm.
Regular DFT analysis was applied on entire vibration signal acquired, this having a time period of 10 s. Certainly, the frequency resolution is low, in about of 0.1 Hz. Thus, frequency shift under 0.1 Hz are impossible to distinguish.
The iterative algorithm produces an overlapped-spectrum, much denser than the regular one, which makes possible very soft frequency shift reading. The algorithm works by iteratively cropping a number of samples from the acquired vibration signal, or a portion of it, and analyzing it at each iteration. A more detailed description of the way in which algorithm works is presented in two past papers [12, 14].
Besides the past methods, earlier presented [15], implying the acoustic excitation, here another concept is developed and described. It was observed that rather than time position relative to the maximum or minimum of the acquired signal amplitude, from that the signal is prelevated for analysis, the amplitude value from that the analysis starts is more important, in order to achieve more real values for the natural frequencies.
In fact, if instead of using frequency sweeping for the acoustic excitation, a short-time acoustic wave excites the mechanical structure, narrowly around of the previsioned natural frequency value, and the structure is leaved to lose enough from the transmitted energy, the possibility to read real frequency values for the vibration modes increases. Furthermore, if a small number of periods of the previsioned natural frequency is used as reference to establish the analysis period, and also the time moment from that the analysis should start corresponds to the certain amplitude value, goes to increase again the chance to read more real values.
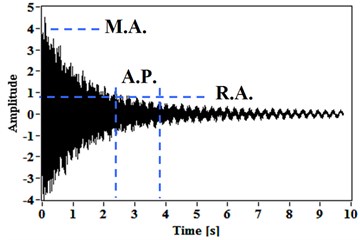
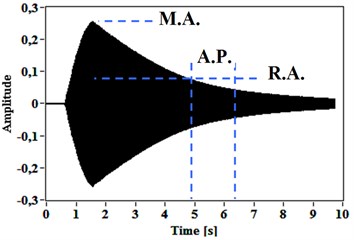
Thus, it was established by tests that relatively to the maximum amplitude value (M.A.), the reference amplitude value (R.A.) from that the analysis period (A.P.) can start is 20 %, and the best value for the analysis period is ten times of the period that corresponds to the analyzed natural frequency. This setup scheme is illustrated in Fig. 3.
Obviously, analysis period, when a very low frequency is aimed, has to not exceed the entire acquisition period. In that case, analysis period can be decreased until the value of the period corresponding to the analyzed frequency is reached.
Fig. 3Free vibration responses for: a) a hammer hit, b) a short-time sine excitation; and the method setup scheme
a)
b)
3. Results and discussions
At the beginning we would like to present the difference between the excitation methods simply by using the regular DFT analysis. Therefore, five tests with mechanical excitation were performed, and also five by acoustic excitation.
Four vibration modes were considered, but skipping the first one. The reason was to have a vibration mode that difficultly can be identified after mechanical excitation. Thus, the second until the fifth vibration modes have been analyzed, having the following previsioned values: 26, 72, 141 and 234 Hz.
Fig. 4Illustration of spectrum for vibration modes achieved by mechanical impact, the zoom shows very low amplitudes around 234 Hz
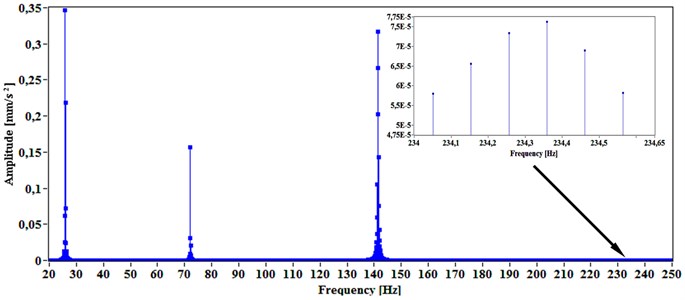
Fig. 4 pictured the corresponding spectrum area, to allow the visualization of the four vibration modes considered. The fifth vibration mode was hardly detected, as expected, showing very low amplitude at about 234 Hz.
Fig. 5 for the same spectrum area shows only one mode, which is easy identified at about 234 Hz, to allow the visualization of the four vibration modes considered. The fifth vibration mode was hardly detected, as expected, showing very low amplitude.
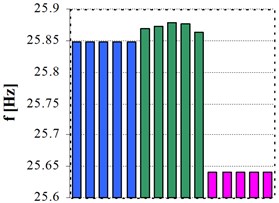
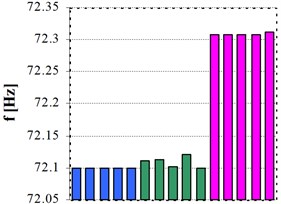
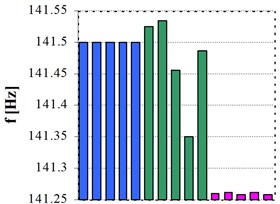
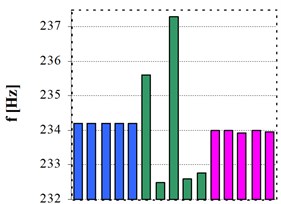
Fig. 6 presents the results for the four vibration modes after five excitation tests. In blue are the values for mechanical excitation and regular DFT, they not change due to the low resolution and implicitly error in reading. Green bars show the right values for mechanical excitation, because the iterative algorithm was used to precisely identify the frequency shift. Performing the acoustic short-time excitation, the proposed method to extract the signal portions for analyzing and the iterative algorithm, the most exactly values have been accomplished.
At the end, it can be appreciate the method is hopeful, it is not complicate and it does not requires more time to be applied, and the results are very promising.
Fig. 5Spectrum showing only one vibration mode accomplished by short-time sine excitation
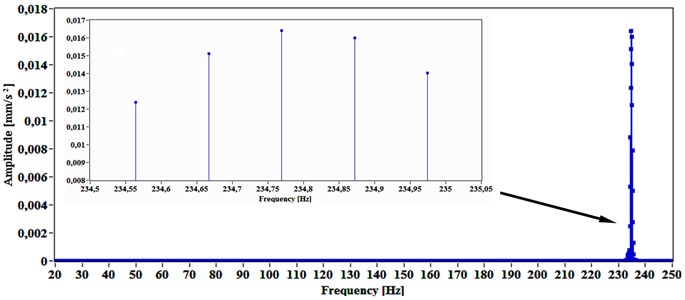
Fig. 6Frequency values of four vibration modes resulted by applying: hammer hit and classical analysis – blue, hammer hit and iterative algorithm – green, short-time sine excitation and iterative algorithm – magenta
a)
b)
c)
d)
4. Conclusions
The proposed method drastically diminishes the possibility to appear non-linearity in the analyzed mechanical systems, due to the non-contact and controlled acoustic excitation. Also, the way of achieving the signal portions for analysis avoids modal perturbation, which can appear because of the induced excitation energy.
The results accomplished by real tests show a very promising way to develop the modal analysis, which is now limited by the precision in acquiring the right values for natural frequencies.
The simplicity of method application allows a good future in its automatically implementation, fact that will can offer better features in modal analysis research.
References
-
Maia N. M. M., Silva J. M. M. Theoretical and Experimental Modal Analysis. Research Studies Press, Baldock, 1997.
-
Brown D. L., Allemang R. J., Phillips A. W. Forty years of use and abuse of impact testing: a practical guide to making good FRF measurements. Experimental Techniques, Rotating Machinery, and Acoustics, Vol. 8, 2015, p. 221-241.
-
Ewins D. J. Modal Testing: Theory, Practice, and Application. Research Studies Press Ltd., Philadelphia, 2000.
-
Heylen W., Lammens S., Sas P. Modal Analysis Theory and Testing. Katholieke Universiteit Leuven, 1998.
-
Van Der Auweraer H., Vanherck P., Sas P., Snoeys R. Accurate modal analysis measurements with programmed sine wave excitation. Mechanical Systems and Signal Processing, Vol. 1, Issue 3, 1987, p. 301-313.
-
Wei Y., Dong Y., Huang X., Zhang Z. A stepped frequency sweeping method for nonlinearity measurement of microresonators. Sensors, Vol. 16, Issue 10, 2016, p. 1700.
-
Friswell M. I., Penny J. E. T. Stepped sine testing using recursive estimation. Mechanical Systems and Signal Processing, Vol. 7, Issue 6, 1993, p. 477-491.
-
Mcconnell K. G., Varoto P. S. Vibration Testing: Theory and Practice. John Wiley and Sons, New York, 2008.
-
Brandt A. Noise and Vibration Analysis: Signal Analysis and Experimental Procedures. John Wiley and Sons, Chichester, England, 2011.
-
Ewins D. J. Basics and state-of-the-art of modal testing. Sadhana, Vol. 25, 2000, p. 207-220.
-
Gillich G. R., Praisach Z. I. Modal identification and damage detection in beam-like structures using the power spectrum and time-frequency analysis. Signal Process, Vol. 96, 2014, p. 29-44.
-
Mituletu I. C., Gillich N., Nitescu C. N., Chioncel C. P. A multi-resolution based method to precise identify the natural frequencies of beams with application in damage detection. Journal of Physics: Conference Series, Vol. 628, Issue 1, 2015, p. 12020.
-
Gillich G. R., Mituletu I. C., Praisach Z. I., Negru I., Tufoi M. Method to enhance the frequency readability for detecting incipient structural damage. Iranian Journal of Science and Technology, Transactions of Mechanical Engineering, Vol. 41, Issue 3, 2017, p. 233-242.
-
Gillich G. R., Mituletu I. C., Negru I., Tufoi M., Iancu V., Muntean F. A Method to enhance frequency readability for early damage detection. Journal of Vibration Engineering and Technologies, Vol. 5, Issue 3, 2015, p. 637-652.
-
Mituletu I. C., Gillich G. R., Maia N. M. M. A method for an accurate estimation of natural frequencies using swept-sine acoustic excitation. Mechanical Systems and Signal Processing, Vol. 116, 2019, p. 693-709.

