Abstract
The concentrated masses attached rigidly to the plate due to different kinds of loading for the installation of the machineries on that plate may play a vital role to shift the bare plate natural frequencies. This paper presents the effect of natural frequencies when the amount of concentrated masses, the position of the concentrated masses and the distribution of a specific amount of concentrated masses into different positions, which is practically possible when installing the machineries, are introduced. The investigations have been done numerically through ANSYS and also carried out to observe the change of mode shapes due to the concentrated masses. A typical single concentrated mass applied at the middle of the plate is validated by the analytical approach found in the literature.
1. Introduction
The machineries of recent times are much more large and better than before for faster and wider performances, which increases the importance of considering vibrations to be analyzed caused by these machineries. A machine on a big floor works as simply as a concentrated point mass on a plate. In addition, the machineries need to install on a plate for various practical purposes. In these circumstances, the machineries can be installed as a concentrated mass on one point or also possible to distribute into different points on a plate. Depending on the boundary conditions, these natural frequencies of a plate can change because of an amount of single concentrated point mass, its position or multiple concentrated point mass and their positions. Now, these frequency change in different modes are very important to know for engineering design to avoid the resonance of the plate.
Several authors discussed and investigated different methods to analyze the linear and non-linear vibration of plates with different geometry and boundary conditions [1-4].
The spring mass system attached in the middle and other positions on a plate have been demonstrated by some literatures, among them recently Ding Zhou [5] analyzed free vibration of rectangular plate with concentrating on the continuously distributed spring mass system. Some papers studied the free vibration of rectangular plates with elastic/rigid single concentrated mass attached on a plate by using different methods such as the exact solution [6-8], the optimal Rayleigh-Ritz method [9] and the mode expansion method [10]. McMillan and Keane investigated the possibility of using attached masses to control the vibration of rectangular plates [11, 12].
In this paper a square plate is considered to analyze because most of the engineering structures like roads, bridges, dams, railways, floor of the ships can be modeled as plate with different boundary conditions. In this investigation, simply supported boundary condition has been undertaken. The main objective of this research work is to observe the change/shift of the plate natural frequencies due to change of the amount of concentrated mass attached on middle (Case-I), change of the position of the concentrated mass considered in case-I (Case-II) and distribute the same amount of concentrated masses, Case-I into different positions of the plate (Case-III) and finally compared the loaded natural frequencies with the unloaded (bare) plate natural frequencies.
2. Modeling of the plate
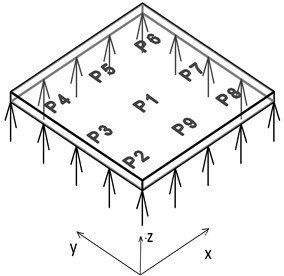
A simply supported square plate made of mild steel is considered having dimensions of 60 cm×60 cm×0.2 cm. The geometry of the bare plate structure under this analysis is shown in Fig. 1.
A small model has been formed for the computational simplicity. The results of this model is shown in the tables where the changes of natural frequencies are given in percentage of deviation from the bare plate.
The mechanical properties of the plate are considered as: Young’s modulus 210 GPa; density 7850 Kg/m3; and Poisson’s ratio 0.3. The concentrated masses are applied for this research work in different positions of the plate shown in Fig. 1. The coordinates P(x,y) of the positions are: P1 (30 cm, 30 cm); P2 (15 cm, 15 cm); P3 (15 cm, 30 cm), P4 (15 cm, 45 cm); P5 (30 cm, 45 cm), P6 (45 cm, 45 cm), P7 (45 cm, 30 cm), P8 (45 cm, 15 cm); and P9 (30 cm, 15 cm).
Fig. 1A simply supported square plate
3. Results and observations
A numerical simulation was performed by ANSYS to observe the effect of natural frequencies due to concentrated masses and its deviations from the bare plate natural frequencies for the above mentioned three cases. The modal shapes are also investigated in this literature.
3.1. Case-I
The amount of the concentrated mass attached on the plate is increased from 0 % to 100 % of total bare plate mass at P1. 0 % indicates basically the bare plate i.e. without any concentrated mass.
Fig. 2Natural frequency VS change in amount of concentrated mass for single concentrated mass in P1
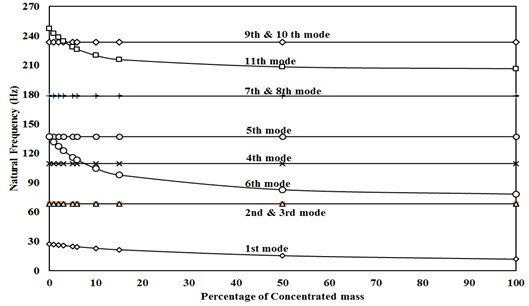
Fig. 2 shows that the natural frequencies are changed with the changing of amount of concentrated mass only in 1st, 6th and 11th modes. The sharp change of natural frequencies occurs up to around 15 %. At 15 % concentrated mas, the deviation of the natural frequencies from the bare plate natural frequencies ranges from 12.83 %-28.668 %.
3.2. Case-II
The 15 % concentrated mass of Case-I is considered and the position of that concentrated mass is changed from P1 to P2 and P3 to investigate the change of natural frequencies from Case-I. The rest of the positions from P4 to P9 can be demonstrated from the investigation of three positions. Table 1 depicts a comparative statement of natural frequencies of P2 and P3 with P1 and the bare plate for the 15 % concentrated mass at P1, P2 and P3. It is observed that concentrated mass at P1, the frequency deviation occurs only at three modes (1st, 6th and 11th) where the maximum deviation is 28.66 % at 6th mode. But, when the concentrated mass is placed on P2 and P3, other modes such as 1st, 3rd, 4th, 6th, 7th and 11th modes (for P2) and 3rd, 5th and 8th modes (for P3) show the deviation from the bare plate. The maximum deviation occurs 23.658 % and 19.394 % at 3rd mode for P2 and P3 respectively.
Table 1Natural frequency of plate with 15 % concentrated mass, due to change in position of the mass
Mode no. | Natural frequency (bare plate) (Hz) | Natural frequency for concentrated mass at P1 (Hz) | % of deviation from bare plate | Natural frequency for concentrated mass at P2 (Hz) | % of deviation from bare plate | Natural frequency for concentrated mass at P3 (Hz) | % of deviation from bare plate |
1st | 27.332 | 21.402 | –21.696 | 25.153 | –7.9723 | 23.571 | –13.760 |
2nd | 68.408 | 68.408 | 0 | 68.408 | 0 | 68.408 | 0 |
3rd | 68.408 | 68.408 | 0 | 52.224 | –23.658 | 55.141 | –19.393 |
4th | 109.583 | 109.583 | 0 | 93.964 | –14.253 | 109.583 | 0 |
5th | 137.05 | 137.05 | 0 | 137.05 | 0 | 114.2 | –16.672 |
6th | 137.05 | 97.7603 | –28.668 | 130.25 | –4.9616 | 137.05 | 0 |
7th | 178.405 | 178.405 | 0 | 163.2 | –8.5227 | 178.405 | 0 |
8th | 178.405 | 178.405 | 0 | 178.405 | 0 | 162.94 | –8.6684 |
9th | 233.531 | 233.531 | 0 | 233.531 | 0 | 233.531 | 0 |
10th | 233.531 | 233.531 | 0 | 233.531 | 0 | 233.531 | 0 |
11th | 247.531 | 215.761 | –12.834 | 240.06 | –3.0182 | 233.136 | –5.8154 |
3.3. Case-III
The same 15 % concentrated mass is considered in this case and then, this amount of mass is equally distributed to two positions with two orientations (P3, P7) and (P4, P8), three positions with three orientations (P1, P2 and P8), (P1, P3 and P7) and (P3, P5 and P7), four positions with two orientations (P2, P4, P6 and P8) and (P3, P5, P7 and P9), and five positions with one orientation (P1, P3, P5, P7 and P9). Table 2 shows the natural frequencies for the different types of distribution with different orientations including the bare plate and the one concentrated mass at middle (P1). The results demonstrate that the distribution of mass in different positions shows the small range deviation of the natural frequencies compared to the single concentrated mass but the unchanged natural frequencies modes can show deviation. The single concentrated mass deviates 12.83 %-28.67 % in only three modes, the 2 position distributed mass with orientation (P4, P8) deviates in 1st, 2nd, 4th, 6th, 7th and 11th modes, 3 position distributed mass with orientation (P1, P3, P8) deviates in 1st, 2nd, 5th, 6th, 7th and 11th modes, 4 position distributed mass with orientation (P2, P4, P7, P9) deviates in all the modes except 5th, 9th and 10th modes and 5 position concentrated masses deviates at all the modes except 4th, 9th and 10th modes for the orientation (P1, P3, P5, P7, P9).
Table 2Natural frequency of the plate with distributed concentrated mass
Mode no. | Natural frequency of bare plate (Hz) | Natural frequency for 1 concentrated mass at P1 (Hz) | % of deviation from bare plate | Natural frequency for 2 concentrated mass (at P3, P7) (Hz) | Natural frequency for 2 concentrated mass (at P4, P8) (Hz) | % of deviation (at P4, P8) from bare plate | Natural frequency for 3 concentrated mass (at P1, P3, P8) (Hz) | % of deviation (at P1, P3, P8) from bare plate | |||||||
1st | 27.33 | 21.40 | –21.7 | 23.88 | 25.39 | –7.1 | 23.04 | –15.69 | |||||||
2nd | 68.41 | 68.41 | 0 | 53 | 52.99 | –22.5 | 57.13 | –16.48 | |||||||
3rd | 68.41 | 68.41 | 0 | 68.41 | 68.40 | 0 | 68.41 | 0 | |||||||
4th | 109.58 | 109.58 | 0 | 109.58 | 84.18 | –23.18 | 109.5 | 0 | |||||||
5th | 137.05 | 137.05 | 0 | 109.47 | 137.1 | 0 | 110.8 | –19.15 | |||||||
6th | 137.05 | 97.761 | –28.7 | 137.05 | 130.4 | –4.85 | 119.7 | –12.67 | |||||||
7th | 178.41 | 178.41 | 0 | 149.64 | 149.7 | –16.1 | 155.3 | –12.94 | |||||||
8th | 178.41 | 178.41 | 0 | 178.41 | 178.4 | 0 | 178.4 | 0 | |||||||
9th | 233.53 | 233.53 | 0 | 233.53 | 233.5 | 0 | 233.5 | 0 | |||||||
10th | 233.53 | 233.53 | 0 | 233.531 | 233.5 | 0 | 233.5 | 0 | |||||||
11th | 247.53 | 215.76 | –12.8 | 223.429 | 235.4 | –4.85 | 211.3 | –14.63 | |||||||
Mode no. | 3 concentrated mass (at P1, P2, P9) (Hz) | 3 concentrated mass (at P1, P4, P8) (Hz) | 4 concentrated mass (at P2, P4, P7, P9) (Hz) | % of deviation (at P2, P4, P7, P9) from bare plate | 4 concentrated mass (at P3, P5, P7, P9) (Hz) | 5 concentrated mass (at P1, P3, P5, P7, P9) (Hz) | % of deviation (at P1, P3, P5, P7, P9) from bare plate | ||||||||
1st | 23.91 | 23.92 | 25.456 | –6.84 | 23.95 | 23.417 | –14.32 | ||||||||
2nd | 60.86 | 57.12 | 59.526 | –13 | 59.52 | 61.091 | –10.69 | ||||||||
3rd | 62.14 | 68.40 | 59.526 | –13 | 59.52 | 61.091 | –10.69 | ||||||||
4th | 95.35 | 88.22 | 85.783 | –21.71 | 109.5 | 109.58 | 0 | ||||||||
5th | 137.0 | 137.0 | 137.05 | 0 | 106.1 | 110.92 | –19.06 | ||||||||
6th | 107.7 | 114.2 | 120.13 | –12.44 | 137.0 | 122.23 | –10.81 | ||||||||
7th | 168.5 | 155.3 | 159.23 | –10.75 | 159.2 | 162.02 | –9.179 | ||||||||
8th | 165.6 | 178.4 | 159.23 | –10.75 | 159.222 | 162.02 | –9.179 | ||||||||
9th | 233.5 | 233.5 | 233.53 | 0 | 233.5 | 233.53 | 0 | ||||||||
10th | 233.5 | 233.5 | 233.53 | 0 | 233.5 | 233.53 | 0 | ||||||||
11th | 220.3 | 219.0 | 232.02 | –6 | 215.6 | 207.4 | –16.21 | ||||||||
4. Mode shapes
Fig. 3 shows the mode shapes obtained at different natural frequencies of a bare plate. The signs + and – are used as a way to understand the deflection of the plate. At the 1st mode the whole plate moves up and down from the middle which is symbolized by the +ve and -ve sign respectively. The 2nd and 3rd modes are at the same natural frequencies but the modal shapes are different. A nodal line is observed which divides the plate into 2 distinct part and let them vibrate individually at the alternate deflection. So it is symbolized + and – to understand the alternate movement. From animation obtained by the simulation, in these nodal lines almost no deflection is visible. 5th and 6th modes are at the same natural frequencies and in these modes the nodal lines divide the plate into 9 distinct square parts and all of them do not vibrate. When portions do not vibrate we symbolized them without any sign (+/-) and we have denoted them as the nodal space, and these spaces do not show vibration.
Fig. 3The mode shapes of the bare plate in the first 11 natural frequencies [14]
![The mode shapes of the bare plate in the first 11 natural frequencies [14]](https://static-01.extrica.com/articles/15812/15812-img3.jpg)
a) 1st mode
![The mode shapes of the bare plate in the first 11 natural frequencies [14]](https://static-01.extrica.com/articles/15812/15812-img4.jpg)
b) 2nd mode
![The mode shapes of the bare plate in the first 11 natural frequencies [14]](https://static-01.extrica.com/articles/15812/15812-img5.jpg)
c) 3rd mode
![The mode shapes of the bare plate in the first 11 natural frequencies [14]](https://static-01.extrica.com/articles/15812/15812-img6.jpg)
d) 4th mode
![The mode shapes of the bare plate in the first 11 natural frequencies [14]](https://static-01.extrica.com/articles/15812/15812-img7.jpg)
e) 5th mode
![The mode shapes of the bare plate in the first 11 natural frequencies [14]](https://static-01.extrica.com/articles/15812/15812-img8.jpg)
f) 6th mode
![The mode shapes of the bare plate in the first 11 natural frequencies [14]](https://static-01.extrica.com/articles/15812/15812-img9.jpg)
g) 7th mode
![The mode shapes of the bare plate in the first 11 natural frequencies [14]](https://static-01.extrica.com/articles/15812/15812-img10.jpg)
h) 8th mode
![The mode shapes of the bare plate in the first 11 natural frequencies [14]](https://static-01.extrica.com/articles/15812/15812-img11.jpg)
i) 9th mode
![The mode shapes of the bare plate in the first 11 natural frequencies [14]](https://static-01.extrica.com/articles/15812/15812-img12.jpg)
j) 10th mode
![The mode shapes of the bare plate in the first 11 natural frequencies [14]](https://static-01.extrica.com/articles/15812/15812-img13.jpg)
k) 11th mode
4.1. Mode shapes of case I
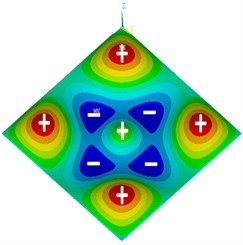
A major change in the natural frequencies at the 1st, 6th and 11th modes for the concentrated mass at P1 are 21 %, 28 % and 12 % respectively (Table 1). Fig. 4 shows the mode shapes of the 1st and 6th modes for a concentrated mass at P1, and Fig. 3(a) and (f) shows the mode shapes of the bare plate. The 1st mode in both Fig. 4(a) and Fig. 3(a) shows a similar type of mode shape but actually the extent of nodal space is more when single concentrated mass is applied at P1. At 6th mode Fig. 4(b) shows significant change of mode shape compared to the Fig. 3(f). In these three modes, P1 does not lie on the nodal line or nodal space in the bare plate mode shapes and the newly formed mode shapes for concentrated mass at P1.
Fig. 4Mode shapes of plate with one concentrated mass
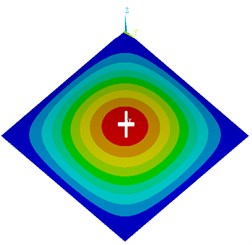
a) 1st mode
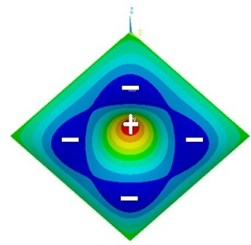
b) 6th mode
c) 11th mode
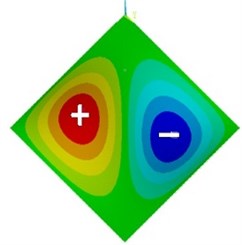
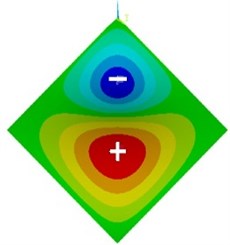
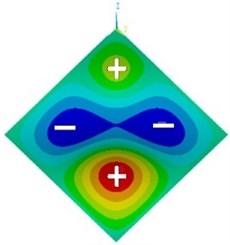
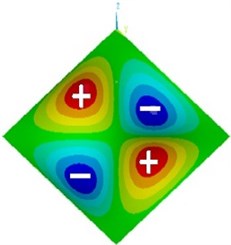
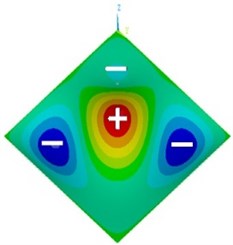
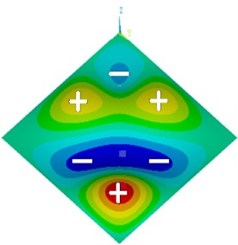
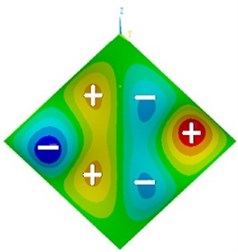
Fig. 5Mode shape of plate with one concentrated mass at P2
a) 2nd mode
b) 3rd mode
c) 4th mode
d) 5th mode
e) 6th mode
f) 7th mode
g) 8th mode
h) 9th mode
4.2. Mode shapes of case II
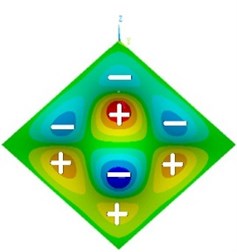
Fig. 5 shows some newly formed mode shapes due to single concentrated mass at P2. At 3rd mode (Fig. 5(b)), the concentrated mass position P2 does not lie on the nodal line or space of bare plate mode shape Fig. 3(c) and newly formed mode shapes (Fig. 5(b)) so deviation of natural frequency is observed. At the 2nd mode the P2 does not lie on nodal line or space of the bare plate but lies on the nodal line of newly formed mode shapes (Fig. 5(a)). Hence no deviation of natural frequency from bare plate is observed at 2nd mode (Table 1). Similar phenomena are observed in other newly formed mode shapes.
4.3. Mode shapes of case III
A major change in the 4th mode of 23.18 % gives us the mode shape in Fig. 6 which is extensively deviated from bare plate mode shape Fig. 3(d).
Only except 4th, 9th and 10th modes, all other modes’ natural frequencies deviates from the bare plate natural frequencies and the mode shapes also changes at these modes. The significant deviation is observed at 5th mode (–19.06 %) in Fig. 7 which is far different than the mode shape observed in Fig. 3(e) and (f).
Fig. 6Mode shape (4th mode) of plate with two concentrated masses at P4 and P8
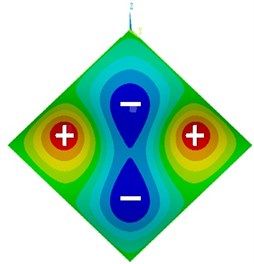
Fig. 7Mode shape of plate with five concentrated masses at P1, P3, P5, P7, P9
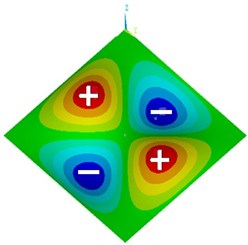
a) 5th mode
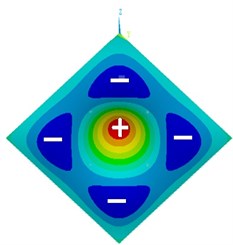
b) 6th mode
5. Validation of simulations
The natural frequency of the plate with one concentrated mass in the middle is obtained from the equation [13] as follow:
where, ωmn – natural frequency of the bare plate in different modes, ωk – natural frequency of the plate with concentrated mass, M – concentrated mass at (x*,y*), Ms – total mass of the plate, m, n= 1, 2, 3, 4,…, mode numbers of the natural frequency.
The results are validated for Case I and it shows that the finite element method and analytical calculations are in good agreement.
Table 3Validation of the results
Mode No | Bare plate (Hz) | 1 % concentrated mass (FEM) (Hz) | 1 % concentrated mass (analytical) (Hz) [15] | 2 % concentrated mass (FEM) (Hz) | 2 % concentrated mass (analytical) (Hz)[15] | 10 % concentrated mass (FEM) (Hz) | 10 % concentrated mass (analytical) (Hz) [15] | 15 % concentrated mass (FEM) (Hz) | 15 % concentrated mass (analytical) (Hz) [15] |
1st | 27.332 | 26.797 | 26.802 | 26.29 | 26.3 | 22.971 | 23.098 | 21.402 | 21.685 |
2nd | 68.408 | 68.408 | 68.408 | 68.408 | 68.408 | 68.408 | 68.405 | 68.408 | 68.408 |
3rd | 68.408 | 68.408 | 68.408 | 68.408 | 68.408 | 68.408 | 68.405 | 68.408 | 68.408 |
4th | 109.58 | 109.58 | 109.58 | 109.58 | 109.58 | 109.58 | 109.58 | 109.58 | 109.58 |
5th | 137.05 | 137.05 | 134.38 | 137.05 | 131.87 | 137.05 | 115.82 | 137.05 | 108.34 |
6th | 137.05 | 131.05 | 134.38 | 127.1 | 131.87 | 104.56 | 115.82 | 97.76 | 108.34 |
7th | 178.40 | 178.40 | 178.40 | 178.40 | 178.40 | 178.40 | 178.40 | 178.40 | 178.40 |
8th | 178.40 | 178.40 | 178.40 | 178.40 | 178.40 | 178.40 | 178.40 | 178.40 | 178.40 |
9th | 233.53 | 233.53 | 233.53 | 233.53 | 233.53 | 233.53 | 233.53 | 233.53 | 233.531 |
10th | 233.53 | 233.53 | 233.53 | 233.53 | 233.53 | 233.53 | 233.53 | 233.53 | 233.531 |
11th | 247.53 | 242.68 | 242.72 | 238.3 | 238.18 | 219.98 | 209.2 | 215.76 | 195.68 |
6. Conclusions
The amount of concentrated mass applied on a plate contributes to the shifting of natural frequencies of a plate. The significant change of the natural frequency is observed up to the amount of 15 % concentrated mass, afterwards the change becomes steady (Case I). Position change of concentrated mass also affects the deviation of natural frequencies and mode shapes. Changing the positions of concentrated mass shift the deviation of the natural frequency from one mode to another (Case II). Equal distribution of the concentrated mass (Case III) into different positions normally reduce the maximum deviation but increases the deviation of more number of modes. The position of the concentrated mass for both on bare plate mode shape and newly formed mode shape can affect the deviation of natural frequency. An interesting observation is that the occurring of the deviation of natural frequencies due to the concentrated mass depends whether the position of the concentrated mass lies on both of the nodal lines/spaces of the bare plate mode shapes and the newly formed mode shapes or not.
The load applied in a plate is taken as the percentage of bare plate weight and the changes in natural frequencies are shown as the percentage deviation. So this model can be generalized for all sizes of the square plate.
References
-
Chiang D. C., Chen S. S. H. Large amplitude vibration of a circular plate with concentrated rigid mass. Journal of Applied Mechanics, Vol. 94, 1972, p. 577-584.
-
RamchandranJ. Large amplitude vibration of a rectangular plate carrying a concentrated mass. Applied Mechanics, Vol. 95, 1973, p. 630-632.
-
VonKarmanTh. Encyclopedia der MathematischenWissenschaften, Vol. 4. Teubner, Leipzig, 1960, p. 349+1910.
-
Karmakar B. M. Amplitude-frequency characteristics of non-linear vibrations of clamped elliptic plates carrying a concentrated mass. International Journal of Non-linear Mechanics, Vol. 13, 1979, p. 351-359.
-
ZhouDing Free vibration of rectangular plates with continuously distributed spring-mass. International Journal of Solids and Structures, 2006.
-
Bergman L. A., Hall J. K., Lueschen G. G. G., McFarland D. M. Dynamic Green’s functions for Levy plates. Journal of Sound and Vibration, Vol. 162, Issue 2, 1993, p. 281-310.
-
Li Q. S. Vibratory characteristics of multistep no uniform orthotropic shear plates with line spring supports and line masses. Journal of the Acoustical Society of America, Vol. 110, 2001, p. 1360-1370.
-
Li Q. S. An exact approach for free vibration analysis of rectangular plates with line-concentrated mass and elastic line-support. International Journal of Mechanical Sciences, Vol. 45, 2003, p. 669-685.
-
Avalos D. R., Larrondo H. A., Laura P. A. A. Transverse vibrations of a circular plate carrying an elastically mounted mass. Journal of Sound and Vibration, Vol. 177, 1994, p. 251-258.
-
McMillan A. J., Keane A. J. Shifting resonances from a frequency band by applying concentrated masses to a thin rectangular plate. Journal of Sound and Vibration, Vol. 192, 1996, p. 549-562.
-
McMillan A. J., Keane A. J. Vibration isolation in a thin rectangular plate using a large number of optimally positioned point masses. Journal of Sound and Vibration, Vol. 202, 1997, p. 219-234.
-
Leissa A. W. Vibration of Plates (NASA SP 160). U.S. Government Printing Office, Washington, D.C., 1969.
-
Soedel Werner Vibration of Shells and Plate. Marcel Dekker, Inc., New York, 1981.
-
Islam Md. Shahriar, Hossain Md. Zahid, Morshed Mir Md. Maruf Dynamic response of a simply supported plate due to excitation at different points. Proceedings of the second International Conference on Advances in Mechanical, Aeronautical and Production Techniques – MAPT, Kuala Lumpur, Malaysia, 2014.
