Abstract
The paper is devoted to forced oscillations in a model with a soft trilinear elastic characteristic, linear damping, under harmonic excitation. The subject of study is chaotic regimes. The study is based on a numerical simulation of the system behavior. The aim is construct two-parameter bifurcation diagrams, select on it boundaries corresponding to the cascade of period doubling bifurcations and determinate condition for birth of chaos.
1. Researched model
The paper describes a model of a system with one degree of freedom. The model consists of soft elastic trilinear characteristic, linear dissipative characteristics and harmonic driving force. The model behavior is described by differential Eq. (1) and trilinear elastic force by Eq. (2):
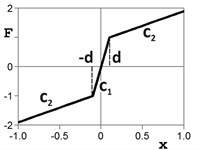
where b=0.2 is viscous friction coefficient, c1=10 and c2=1 are the stiffness of trilinear elastic force, d=0.1 is coordinate of the elastic force break, h and w is excitation force amplitude and frequency. The results in this paper are obtained for various values of h and w.
2. Method of research
To solve the problem we used the method of complete bifurcation groups [6], which is based on the analysis of stable and unstable periodic solutions of differential equations.
First we need to substitute a continuous system described by a differential equation to a discrete system described by the discrete mapping operator [1, 2], known as the Poincaré map:
where X(t) is phase coordinates of the system at time t, T is mapping period, for non-autonomous systems it’s equal to the period of the driving force, D is discrete mapping operator, describing the change of the system state via the mapping period.
For most systems, writing of the discrete mapping operator analytically is impossible. For the considered system the discrete mapping operator is constructed algorithmically based on the numerical integration of the original differential Eq. (1) over the mapping period T. To find the periodic solution with the period T of the original differential Eq. (1) (a solution will be called as the regime P1) is necessary to solve the discrete Eq. (4):
Roots of the Eq. (4) will be fixed points of the discrete mapping or initial coordinates of periodic regimes P1. To find periodic solutions with longer periods (P2, P3, …) enough to apply the discrete mapping operator in Eq. (4) appropriate number of times. For example, for regimes P2:
For the considered system the Eq. (4) and (5) can be solved only numerically, e.g., using Newton’s method.
The obtained solutions are corresponding to both stable and unstable periodic regimes. Evaluation of the periodic regime’s stability is based on the Floquet theory [3], according to which the periodic solution is stable if all roots ρi of the characteristic equation of monodromy matrix Eq. (6), calculated for the discrete mapping operator at a fixed point, will be less than one in absolute value:
The next step is to follow changes of the system state when one of its parameters is changed. The graphs describing such changes are called as one-parameter bifurcation diagrams. In the diagrams may be represented changes of the fixed point’s phase coordinates (x, ˙x=v) or the periodic regime’s amplitude (Ax) when changing the variable parameter. Practically the construction of such diagrams means the solution of Eqs. (4) and (5) for different values of the variable parameter. This method is known as method of parameter continuation. Its application allows representing the points corresponding to either stable or unstable periodic regimes on the bifurcation diagrams. These diagrams will be called as complete bifurcation diagrams [6].
On the complete bifurcation diagram particular importance have points in which a qualitative change of the regime’s stability occurs. These points are called as points of bifurcations. For example, the period-doubling bifurcation at stability loss of regime P1 leads to the birth of stable regime P2. Sequence of period-doubling bifurcations is one of the possible scenarios for birth of chaos [4, 5, 6], known as the Feigenbaum scenario [7]. Cascade of period-doubling bifurcations leads to appearance an infinite number of unstable periodic solutions (e.g. P1, P2, P4, P8, ...). Such structure will be called as unstable periodic infinitium (UPI). Presence of UPI in the system determines the existence of a stationary or transient chaos [6].
On the plane of the two parameters can be constructed a two-parameter bifurcation diagram. This diagram consists of bifurcation boundaries, every point of which corresponds to the bifurcation point on the one-parameter diagram. Bifurcation boundaries corresponding to the bifurcation of period-doubling cascade limit in the two-parameter diagram regions of parameters at which UPI exists. In these regions chaotic behavior of the system is possible. To construct a two-parameter bifurcation diagrams can be used a method of movement on the bifurcation boundary.
All of these methods of bifurcation analysis of dynamical systems are implemented as software SPRING, which for many years developed in the group led by prof. M. Zakrzhevsky. All the results presented in this paper were obtained using this software.
3. Bifurcation diagrams of chaotic solutions
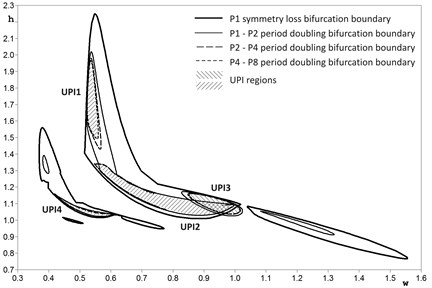
Applying of the described above method, we have constructed a two-parameter bifurcation diagram for the considered Eq. (1) (Fig. 1). The diagram is constructed in the plane of w-h parameters for bifurcation group P1 and shows bifurcation boundaries corresponding to the symmetry loss bifurcation of regime P1 and the cascade of period doubling bifurcations for asymmetrical regimes P1, P2 and P4. Separately shaded UPI areas, where chaotic behavior of the system is possible. Total in the diagram can be identified 4 such areas – UPI1, UPI2, UPI3 and UPI4, two of which overlap (UPI2 and UPI3). Overlap of UPI areas means that several UPI coexists at the same parameters values, which can lead to the coexistence of several chaotic attractors.
Fig. 1Two-parameter bifurcation diagram of soft trilinear Eq. (1)
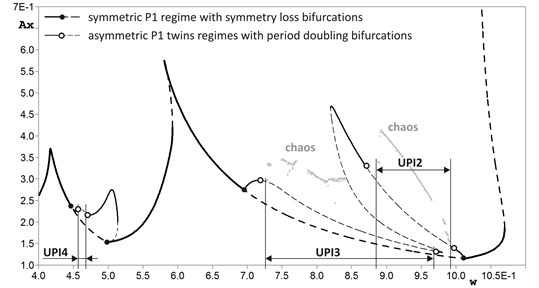
When fixing one of the parameters of the two-parameter diagram, we obtain its cross section, which represents a one-parameter bifurcation diagram. The diagram in Fig. 2 is constructed with a fixed value of the driving force’s amplitude h=1.10, and when the frequency of the driving force w is changed from 0.40 to 1.10. The diagram in Fig. 3 is constructed with a fixed value of the driving force’s frequency w=0.55 and the amplitude of the driving force h is changed from 0.90 to 2.40. Diagrams show the changes of the stationary regimes amplitudes when changing variable parameter. The diagrams are constructed for symmetric and asymmetric regimes P1 and contain branches, corresponding to stable (solid lines) and unstable (dashed lines) solutions. On the diagram UPI regions and regions of chaotic attractors, related with these UPI, are also marked.
Fig. 2Bifurcation diagram (dependence of stationary regime’s amplitude Ax on excitation force frequency w) of P1 bifurcation group at h= 1.10. Solid lines correspond to stable solutions, dashed – to unstable
4. Chaotic attractors
The following are examples of chaotic attractors from different areas of UPI. Fig. 4 shows the Poincaré map and time histories of chaotic attractors from the areas UPI1-UPI4. Fig. 4(a) shows examples of the coexistence of two mutually symmetric chaotic attractors from UPI1 area (w=0.539, h=1.67). Poincaré plane contains the results of 10,000 mappings from point x=0.426, v=0.539 (for the chaos A) and 10,000 mappings from point x=0.65, v=–0.23 (for chaos B). For the first 12 mapping periods the time histories are also shown. Figs. 4(b) and 4(c) show examples of chaotic attractors from UPI2 (w=0.845, h=1.08) and UPI4 (w=0.540, h=1.037) areas respectively. Poincaré plane contains the results of 10,000 mappings for each phase trajectory from points x=0.126, v=0.153 for UPI2 and x=0.1, v=0.05 for UPI4. For the first 20 mapping periods the time histories are also shown.
Fig. 3Bifurcation diagram (dependence of stationary regime’s amplitude Ax on excitation force amplitude h) of P1 bifurcation group at w= 0.55. Solid lines correspond to stable solutions, dashed – to unstable
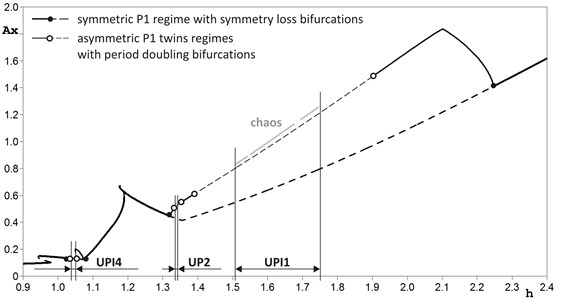
Fig. 4Poincaré maps and time histories of chaotic attractors: a) from region UPI1 at w= 0.539, h= 1.67; b) from region UPI2 at w= 0.845, h= 1.08; c) from region UPI4 at w= 0.540, h= 1.037

a)

b)

c)
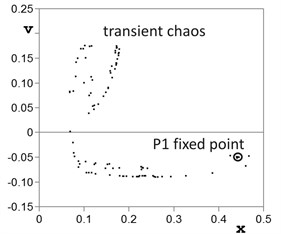
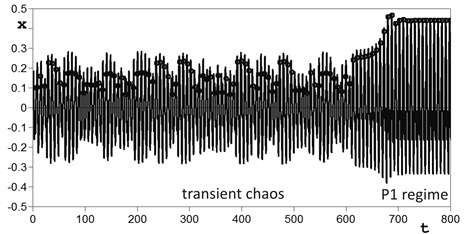
Fig. 5 illustrates another consequence of UPI – transient chaos. Figure contains the Poincaré map and time history of the phase trajectory for the parameters from UPI2 area (w=0.85, h=1.095). Phase trajectory is calculated from the initial point x=0.1, v=0.1 during 2000 mapping periods. The initial part of Poincaré map retains the contours of the chaotic attractor, but then the system goes into a periodic regime P1.
Fig. 5Poincaré maps and time histories of transient chaos from region UPI2 at w= 0.85, h= 1.095
a)
b)
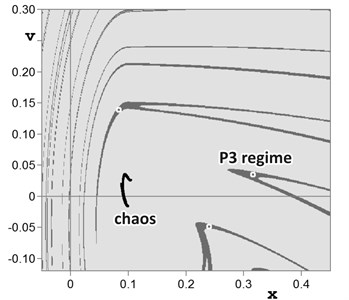
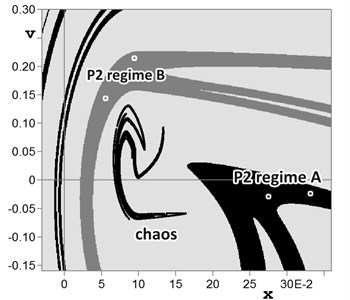
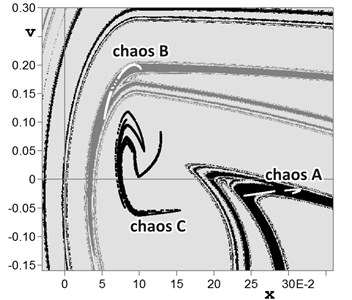
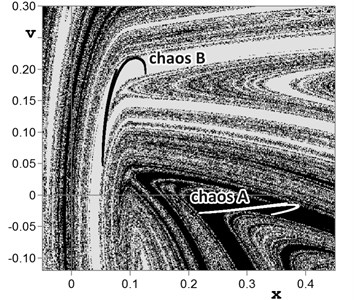
Fig. 6Domains of attraction for cases of chaos coexistence in overlay of regions UPI2 and UPI3: a) chaotic attractor and P3 regime at w= 0.988, h= 1.089; b) chaotic attractor and two P2 regimes at w= 0.94, h= 1.05; c) three chaotic attractors at w= 0.952, h= 1.05; d) two chaotic attractors at w= 0.89, h= 1.10
a)
b)
c)
d)
Availability of UPI can generate chaotic attractor coexisting with periodic or other chaotic regimes. This is illustrated by the domains of attraction in Fig. 6. Domains of attraction are constructed by cell-to-cell mapping method [8] with grid 500×500 cells. All the examples in this figure correspond to the parameters from the overlapped areas UPI2 and UPI3. Fig. 6(a) illustrates the coexistence of a chaotic attractor and periodic regime P3 at w=0.988, h=1.089 (x=–0.05...0.45, v=–0.12...0.30, 500×500 cells). Fig. 6(b) illustrates the coexistence of a chaotic attractor and two mutually symmetric periodic regimes P2 at w=0.94, h=1.05 (x=0.04...0.36, v=–0.10...0.30, 500×500 cells). A further change of the parameters leads to a cascade of period-doubling and P2 regimes are converted into two UPI, each of which generates a chaotic attractor. This is illustrated in Fig. 6(c) containing the domains of attraction of the three chaotic attractors at w=0.952, h=1.05 (x=–0.03...0.36, v=–0.16...0.30, 500×500 cells). Fig. 6(d) contains an example of the fractal structure of the domains of attraction for two mutually symmetric chaotic attractors at w=0.89, h=1.10 (x=–0.05...0.45, v=–0.12...0.30, 500×500 cells).
5. Conclusions
The dynamical system with soft trilinear elastic force is researched on the base of numerical simulation and application of the method of complete bifurcation groups. For this system we constructed the two-parameter bifurcation diagram and determined the parameters values at which system have period doubling cascade, leading to unstable periodic infinitium (UPI). We have shown that UPI is the reason of chaotic behavior which can be manifested as a stationary or transient chaos. Coexistence of UPI with another stable periodic regimes can cause longtime chaotic transients or to coexistence of periodic and chaotic stationary regimes. Coexistence of several UPI can cause coexistence of several chaotic attractors.
References
-
Katok A., HasselblattB. Introduction to the Modern Theory of Dynamical Systems. Cambridge University Press, 1997.
-
Zaslavsky S. M., Sagdeev R. Z. Introduction to Nonlinear Physics: from Pendulum to Turbulence and Chaos. Moscow, Nauka, 1988, (in Russian).
-
Demidovich B. P. Lectures on the Mathematical Theory of Stability. Moscow, Nauka, 1967, (in Russian).
-
Butenin N. V., Nejmark Y. I., Fufajev N. A. Introduction to the Theory of Nonlinear Oscillations. Moscow, Nauka, 1967, (in Russian).
-
Kuznetsov A. P., Kuznetsov S. P., Sataev I. R. A variety of period-doubling universality classes in multi-parameter analysis of transition to chaos. Physyca D, Vol. 109, 1997, p. 91-112.
-
Zakrzhevsky M. New concepts of nonlinear dynamics: complete bifurcation groups, protuberances, unstable periodic infinitiums and rare attractors. Journal of Vibroengineering, Vol. 10, Issue 4, 2008, p. 421-441.
-
Steven H. Strogatz Nonlinear Dynamics and Chaos: with Applications to Physics, Biology, Chemistry, and Engineering. Westview Press, 1994.
-
Schukin I. Cell-to-cell mapping for drawing of basin of attraction. The Scientific Journal of Riga Technical University, Vol. 28, 2008, p. 48-54.
