Abstract
Depending on the transformer type and its applications in power systems, there are various methods for the noise sources identification. Noise radiation of structure can be estimated and characterized knowing its vibrations. The paper will explain basic theory of structure born noise and its correlation to the structure vibration based on vibration velocity results from Laser Doppler Vibrometry measured on transformer. Discussion on qualitative and quantitative evaluation of transformer noise radiation from vibration pattern image and FFT spectrum is performed.
1. Introduction
For the end user, the aim of transformer working in power system is to convert electrical energy in a possible lossless manner. In reality, energy conversion in transformer is accompanied by many side effects that reduce the performance and profitability of the device. Environmental impact is one of the negative results whose limitation is nowadays an important aspect. A well-known effect, almost inherently related to the work of the transformer, is a hum noise. The noise of transformer is almost completely harmonic in its frequency characteristic and stationary in the time domain. Those two parameters enable us to look at the transformer noise through its vibration pattern on the structure. Estimation of the radiated noise characteristic can be performed processing vibration measurement results of the transformer body [1]. Transformer as a source of sound radiate energy through the action of vibrating solid surface upon surrounding fluid. This fluid is air for dry-type transformers where the core and windings – active part is naturally air cooled or placed in metal enclosure with ventilation system. The interaction gets more complicated for oil-immersed transformer that is placed in tank, the first interaction is active part to insulating oil and then the oil to the tank and finally the tank to surrounding air. Designers of transformers must take into account the widespread operation of industrial and community noise limitation regulations and therefore must understand the mechanism of sound generation and transmission in transformers but what is more important how most effectively and economically eliminate or suppress it.
Improper mechanical design of transformer construction, especially transformer tank, can induce local structural resonances and eventually enhance the hum noise radiation. In the R&D approach, the reliable identification of the sources of noise and vibration is required, in particular if the sound attenuation is expected as a consequence of the effective design improvement [2]. The noise pollution potentially caused by the transformer (and its mitigation) is now one of the most important aspects to avoid new environmental threats.
This work presents correlation of transformer vibration pattern to radiation of the noise. From the dense grid of vibration velocity measurement points applied on the transformer tank wall one can estimate acoustic power.
2. Transformer vibroacoustics
The transformer noise is mainly caused by physical phenomenon’s occurring in the core and windings. Two operating conditions can be generally distinguished when power transformer is working in the energy grid, namely: load and no-load conditions. Both are strictly followed by the noise generation: not loaded power transformer emits only the noise caused by magnetostriction of the magnetic core, in the load conditions Lorentz forces dominate. The noise which occurs in the subsequent operating mode differs by its frequency spectrum. Load and no-load noise of the transformer is strictly harmonic with the difference in dominant frequency.
According to IEC Standard [3] in order to decide whether it is significant to perform load current sound measurements, the magnitude of the load current sound power level can be roughly estimated by Eq. (1):
where Sr is the rated power in megavolt amperes (MVA) and Sp is the reference power (1 MVA).
Load current in the windings of transformers generates electromagnetic forces which act in both axial and radial directions in the windings. The magnitude of these forces depends only on the magnitude of the load current and on the local magnetic field, which is also a function of the load current. Thus the magnetic forces in the windings are proportional to the square of the load current. Metals are elastic in a wide range of loadings, therefore little harmonics vibration is normally generated, and the fundamental harmonics dominate the vibration spectrum. The deflections of the windings and their vibration velocities are proportional to the exciting force, that is, proportional to the square of the load current. The sound power radiated from a vibrating body is proportional to the square of the vibration velocity. Consequently, the sound power varies with the fourth power of the load current. In liquid-filled transformers, vibrations from both the core and windings are transmitted to the tank through the structural support of the core and coil assemblies and through the liquid phase.
3. Noise investigation
According to the IEC standard [3] in order to evaluate sound power level, sound pressure and sound intensity measurement methods are used. As a result, they provide the sound power level which is a single-numerical index giving no information about directivity, frequency characteristic or main noise source locations (acoustic hotspots) for the measured object. This single-numerical index is, however, sufficient when it comes to the description of the transformer as a point source and it provides a good information how the transformer will affect the surrounding environment and, what is even more important, whether it will comply with the noise requirements or regulations given by the customer or the local authorities.
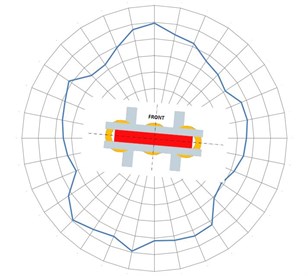
The sound pressure measurements conducted during standard tests are taken by point to point method around the transformer on the prescribed contour in the half height (1/3 and 2/3 height alternatively for heights above 2,5 m) and, the results can be postprocessed to obtain noise radiation directivity, as shown in Fig. 1. Such information can be critical when planning the transformer location in the substation, concrete housing or distribution station.
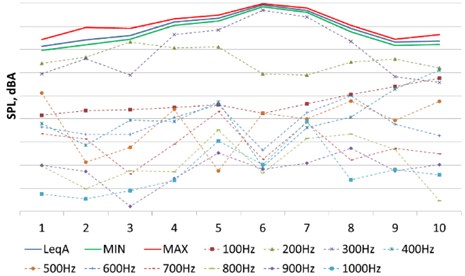
When the measurement hardware setup allows for FFT or at least 1/3 octave band filter, further investigations on noise characteristic can be performed. Mainly frequency spectrum and dominant harmonics is the output, but also basic visualization of particular frequencies radiation can be performed. Fig. 2 shows sound pressure level of the Leq (equivalent level) value, min. and max. values and harmonics of 100 Hz up to 1000 Hz measured in 10 points at the front side of the prescribed contour. For stationary source of noise as transformer is the measured SPL level is not changing in time though max and min levels should be close to Leq value. Point 6 on Fig. 2 is an example where those values are similar meaning that the measurement has been done in good acoustic conditions with no significant background noise. On the other hand in point 2 the max value of SPL is away from the Leq value what should pay our attention, fortunately the Leq value is not so far from the min value, what can indicate that the background noise which occurred during measurement and build the max level did not last long and not influenced Leq value so much. Analyzing the frequency spectrum, it can be clearly seen that 300 Hz is dominating frequency in the noise, it builds up the Leq value mainly in point 5, 6, 7 and 8, second one is 200 Hz being dominant on the transformer borders.
Fig. 1Transformer noise radiation directivity

Fig. 2Sound Pressure Level with harmonic frequencies value at front measurement points

Having the directivity and the frequency spectrum of transformer noise in all direction as a result of standard tests one can say that sufficient knowledge about the noise is available, however when performing R&D investigations on noise sources further work needs to be done.
Fig. 3Sound intensity mapping of the front side of transformer

Sound intensity scan is one of a very efficient sound source localization method. When a sound intensity scan is performed a grid is set up to define a surface. Sound intensity measurements normal to the surface are made from a number of equally spaced points on the surface, the same measurements can be than used to calculate the sound power over the grid. A matrix of intensity levels – one value for each point is achieved and lines of equal intensity can be drawn by interpolating and joining up points of equal intensity. These are sometimes called isointensity lines and they can be drawn either at single frequencies or for an overall level. Fig. 3 shows results of 10×10 points measurement grid of the front side of the transformer with a lot of additional information that has not been available in the prescribed contour measurements.
4. Vibration of the transformer
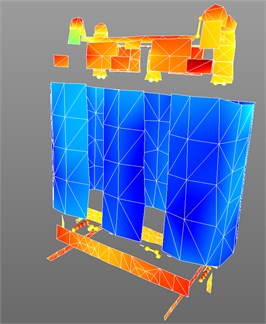
It is commonly assumed that accurate transformers noise prediction is possible when measuring mechanical vibration velocity instead of magnetostriction factor obtained by d.c. magnetization. Laser Doppler Vibrometry (LDV) basis on a velocity measurement technique and it acquires vibrations from changes in the frequency of the light that is scattered back from a vibrating surface (Doppler effect). The LDV measurement is non-contact and that is its biggest advantage, since the tested part stays uninfluenced during the measurement and bringing a much more reliable picture of its own properties. Alternatives to the LDV are accelerometers but as a contact method they influence the measurement object and what is more, measurements with such precision and number of points occupies a large amount of time. Another big advantage of using LDV in transformer is that it can be applied in the operation mode, when transformer is supplied with high voltage, due to the non-contact method it is possible and meet the safety regulations. The easiest way to excite transformer construction to vibrate is by applying voltage to it and measure the vibration as they are in the operation mode. One of the disadvantages of this method is that we cannot easily define resonant modes of the transformer construction because it is only excited in harmonics, starting from the 100 Hz as the fundamental. Vibration pattern of the structure is then combined of several basic modes which are hard to separate. On the other had one can observe the true vibration of the structure called operation deflection shape (ODS). Fig. 4 shows operation deflection shape (ODS) of transformer which was measured using LDV and by analyzing this image one can say that the excitation forces dominate the final vibration pattern and not the resonant modes. It is seen that the upper and lower part of the transformer is vibrating mainly where the supporting construction for the transformer core is placed, having in mind the magnetostriction effect in the core we can point out the source.
Fig. 4Operation deflection shape, vibration velocity of transformer

5. Vibration to sound correlation
When analyzing acoustic images and vibration patterns of the transformer the correlations and conclusions need to be carefully drawn with a good knowledge of what is the conversion of the vibration to noise energy.
Fig. 5 shows diagram describing main steps of conversion of the structure vibration to noise level. The acoustic power which is radiated by the structure can be calculated knowing its surface dimensions, radiation efficiency and vibration velocity. The decibel scale transfer is done according to the acoustic power level formula and as the transformer noise is measured in units of A-weighted sound pressure level, the vibration velocity is also in A-weighting.
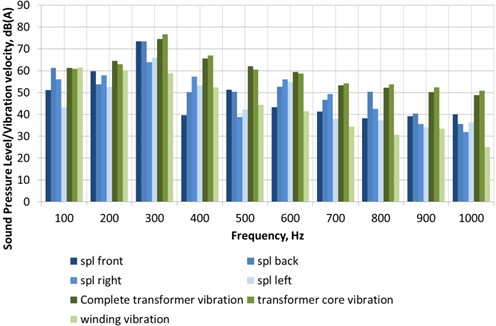
The above calculations help to estimate the expected noise radiation of the transformer what is summarized in the Fig. 6, where sound pressure levels at four sides are listed together with vibration velocity of transformer core, windings and complete. It can be clearly seen that for the dominant frequency in the noise spectrum 300 Hz the levels of SPL in the front and back side of the transformer match with the vibration velocity of the complete transformer. At 300 Hz for the left and right side of the transformer the SPL levels are close to the winding vibration level, the reason might be that the surface of the core acting in this direction is reduced and the winding is mainly radiating.
Fig. 5Structure vibration to sound pressure conversion diagram

Fig. 6Summary of the sound pressure levels and the corresponding vibration velocities in dB scale

Estimating sound spectrum of the transformer by its vibration velocity levels works sufficiently for the determination of the dominant frequency, also first two harmonics 100 Hz and 200 Hz are in close by the levels of SPL and vibrations. Sound pressure levels and vibration levels for the frequencies which are above the dominant 300 Hz start to mismatch, the reason for this can be that the measurement point for the vibration measurements have been picked in areas where the velocities are in particular higher than the overall vibration pattern of the structure.
6. Conclusions
The paper explains basic theory of transformer noise radiation and its correlation to the structure vibration based on vibration velocity results from Laser Doppler Vibrometry. Discussion on qualitative and quantitative evaluation of transformer noise radiation from vibration pattern image and FFT spectrum is performed. Results show that converting the vibration velocity pattern of operating transformer can bring sufficient information about its noise radiation and propagation.
References
-
Fahy F. Sound and Structural |Vibrations. Second Edition, Academic Press, Oxford, 2007.
-
Kmita G., Kozupa M., Platek R., Krol J., Juszkiewicz G. The approach to the noise and vibration management in the power products design. Advanced Materials Research, Vol. 1016, 2014, p. 234-238.
-
IEC 60076-10 Standard, Power Transformers Part 10: Determination of Sound Levels.
