Abstract
This study investigated the human body sway measuring instruments. An accelerometer and a gyroscope were used to examine patients with postural control related diseases in many studies. Some studies used either an accelerometer or a gyroscope attached to the head, chest, or waist to obtain the balance assessment parameters of body sway such as area, direction, etc. The purpose of this study is to identify the reliability between both sensors in human body sway analysis by assuming the human body sway as a simple pendulum model, and suggest an optimal measurement method using the acceleration and the gyroscope. The characteristic differences between the accelerometer and the gyroscope were illustrated, focusing mainly on the differences with respect to the position of the sensors. We confirmed that the magnitude, instead of three axis vector information, may be more useful in the body sway analysis.
1. Introduction
The human body sway, so-called the postural control of body, is an insightful criteria when investigating several neurological diseases associated with a normal aging process such as vestibular loss as well as the celebellar pontine angle tumorous disease [1, 2]. A posturography can assess and provide some evidences to observe and analyze normal and abnormal patients [3]. Several studies in the clinical diagnosis use instruments, such as force plate analysis [4, 5], high speed camera [6, 7], accelerometer [8, 9] and gyroscope [10, 11], for abnormal patient assessments.
One of the simplest method is to use the accelerometer and the gyroscope because they have low power consumptions and are able to measure with both non-intrusive static and dynamic events, such as quiet standing [12, 13]. The acceleration and the angular velocity of body sway are valuable variables to assess the body sway, and they are measured by attaching the accelerometer or the gyroscope sensor to the a part of the body [8, 10, 14, 15].
Many studies used a pendulum model or an inverted pendulum as COM above its pivot point [16, 17]. In general, some motion analysis studies used the inverted pendulum model to represent the movement of the whole-body center of mass [18-20].
The accelerometer is used to measure specific force of the body frame with the inertial frame in the body frame coordinates because of its need to subtract the acceleration due to gravity to obtain the motion induced quantity. A 3-axis accelerometer tells us the orientation of a stationary platform relative to the earth's surface. Once this platform starts moving, however, it gets more complicated. When it is accelerating in a particular direction, this acceleration is simply added to any force it is being provided by gravity, becoming indistinguishable [9, 21-23].
The gyroscope measures the angular velocity, the rate of rotation around a particular axis. Essentially, the rate of change of the orientation and the same angular velocity are observed at all parts of the body [24, 25].
In this paper, we proposed to compare of the characteristics of the accelerometer and the gyroscope which give different reliabilities depending on the location of the sensor attached to different parts of the body. The pendulum model was used in this study, assuming that the pivot of the pendulum is the center of mass (COM) of the human body. Subsequently, the sensors along with an accelerometer and a gyroscope, were attached to the end of pendulum with three levels for observing the characteristics of the accelerometer and the gyroscope.
2. Methods
We have simulated the simple pendulum of acceleration and angular velocity to compare with real experiments. Next, we have analyzed the characteristics between the accelerometer and the gyroscope, which depend on the position of the attached sensor, and compared their values for the 3-axis vector and its magnitude in sway analysis.
2.1. System configuration
The sensor is composed of a 3-axis gyroscope (ITG-3200, InvenSense, Colorado, USA) and a 3-axis accelerometer (ADXL345, Analog Device, Colorado, USA) [23]. The sensors were calibrated before use. The gyroscope data and acceleration data were collected in real time using the LabVIEW program (ver. 2012, National Instruments Coporation, USA) and were analyzed using Matlab (ver. 2011b, Mathworks, Massachusetts, USA) [26] and all data were transferred to PC through via wireless Bluetooth.
The first experiment is the simple pendulum one for the comparison of the accelerometer and the gyroscope and the second experiment is to compare the data of acceleration and the gyroscope according to sensor position.
2.2. The simulation of the pendulum
A pendulum is a weight suspended from a pivot that swings freely. They either swing continuously (idealized pendulums) or stop after a short period (real pendulums) [27-29].
Figure 1 illustrates a simple gravity pendulum, a weight with the mass (m), hanging on a theoretical massless rope, suspended from a pivot.
Fig. 1A simple pendulum and the axis information of sensor
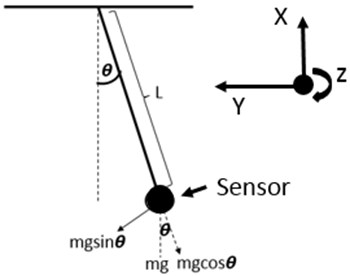
The oscillatory motion of the simple gravity pendulum is called the simple harmonic motion. Normally, the oscillation of the pendulum at an angle (θ) is shown in the equation below:
The symbol θ is the angle between the rope and the normal line that is perpendicular to the pivot surface, g is gravity force, m is the mass of weight, and L is the length of the light wire.
In case of small angles (small displacements), the pendulum oscillation motion can be derived using Eq. (2).
Small angle (θ)≈θ:
where S is the amplitude of the pendulum oscillation, L is the length of the light wire, and θ is the angle between the rope and the normal line.
2.2.1. Acceleration
From Eq. (2), the small angle at t=0 is defined. For example, if the initial angle is 5 degrees as illustrated as Figure 1, then the harmonic motion can be defined by:
where θmax is the angular amplitude of the motion (the maximum value of the angular position θ), and ω is the angular frequency or angular velocity.
Base on Figure 1 and Eq. (3), the period of swing cycle (T) is found using Eq. (4):
where T is the period of a swing cycle, L is the length of the rope, and g is the gravity force.
From Figure 1 and Eq. (3), the acceleration of the pendulum is derived using Eq. (5):
where S0 is the amplitude of the initial condition and ω0 is the angular velocity of the initial condition at t0.
Consequently the velocity (v) and the acceleration (a) can be defined by:
where v is the velocity, a is the acceleration, S0 is the amplitude of the initial angle, and ω0 is the angular velocity at initial condition.
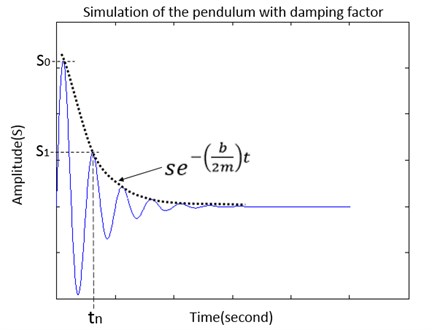
In case of the simple pendulum oscillation under damped situation (see Figure 2), Eq. (1) and Eq. (7) can be rewritten as:
From Eq. (5) and Eq. (8), the amplitude of the pendulum under damped situation is calculated [35, 36] by:
where s is the amplitude, b is a damping coefficient, m is mass, ω is the angular velocity, t is time, and ϕ is the phase.
Fig. 2The simulation oscillation of the pendulum under the damping fact. S0 is the first amplitude at the initial position, S1 is 2nd amplitude at tn
2.2.2. Angular velocity
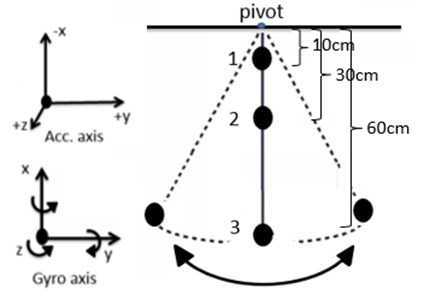
An object rotating around an axis, such as a spinning wheel, has an angular velocity which can be measured in revolutions per second (RPS) or degrees per second (°/s). From our sensor, the simple pendulum is rotation around z-axis of the gyroscope.
As shown in Figure 3 the angular velocities of the x- and y-axis can be measured but z-axis will have a constant value because of the unchanging angle of the axis. If the pendulum starts its swing from initial angle at any degree we can define the angular velocity with Eq. (7) and Eq. (9).
Fig. 3The experiments of the three gyroscope sensors attached to in experiments and axis information
2.3. The characteristics of the sensor according to sensor position
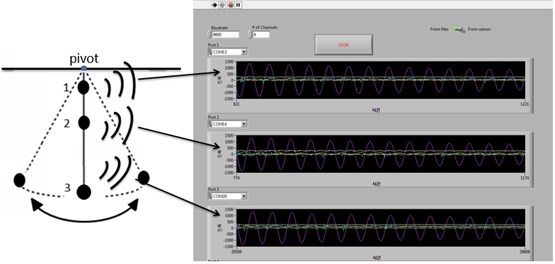
The pendulum model with 3-levels of sensors was in free fall from the initial angle at 45 degrees against the pivot surface. It underwent a free swing down by inertial gravity until it stopped. The accelerometer and gyroscope data at three different positions were measured from the initial fall of the pendulum. The LabVIEW program was used to collect data from 3-sensors with three separate channels, including the 3-axis acceleration and 3-axis angular velocity data as shown in Figure 4 and Figure 5. The baud rate of Bluetooth was 57,600 bits per seconds. The accelerometer and gyroscope data were saved in text files. They were analyzed using Matlab (ver. 2011b, Mathworks, Massachusetts, USA).
Fig. 4The position of sensors attached on pendulum and the axis information in real experiments
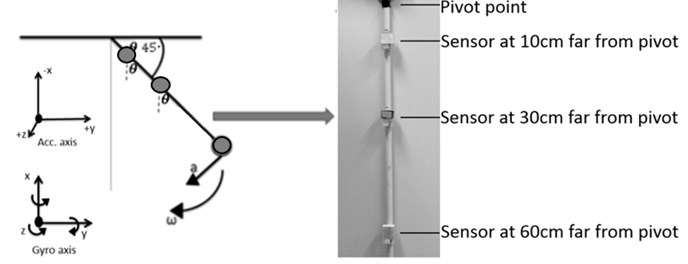
Fig. 5LabVIEW program collecting the transferred data via Bluetooth in real time
2.4. The magnitude of 3-axis vector
The 3-axis vector values were combined with the magnitude or scalar values. We expected that the signal of the magnitude could give the proportional information as 3-axis vector value [30, 31].
In physics, the motion of objects can be described by terms such as distance, displacement, acceleration, etc. These terms are associated with particular mathematical quantities with fixed definitions. The mathematical quantities can be divided into two categories: a vector and a scalar. Scalar are the quantities that are described by a magnitude or a numerical value, while vectors are the ones described by not only a magnitude but also a direction.
From the pendulum model simulation of acceleration and angular velocity, all 3-axis acceleration and angular velocity values are in vector scales. However, the data for each axis could give different information. Thus the magnitude, which is in a scalar scale, of 3-axis acceleration and angular velocity was calculated by using Eq. 10 [32]:
where A is the magnitude of 3-axis vectors. Thus x, y and z are the data of either acceleration or angular velocity in the 3-axis.
3. Results
3.1. The simulation of the pendulum
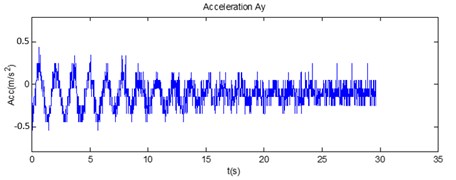
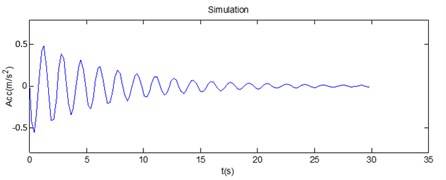
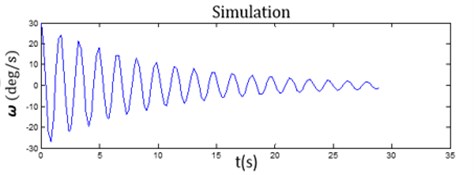
The accelerations between the accelerometer in y-axis and the simulation with the weight of 0.024 kg, the length of 0.6 m, and the initial angle of 5 degrees were compared, which is illustrated in Figure 6 and 7.
Fig. 6The comparison of a) the measurement data from the accelerometer and b) the simulation data
a)
b)
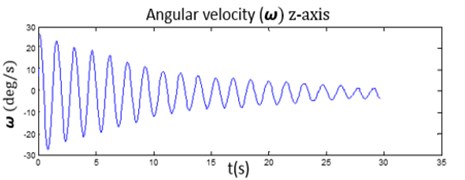
Fig. 7The comparison of a) the measurement data from the gyroscope and b) the simulation data
a)
b)
As a result, we found that our sensor, a combination of the accelerometer and the gyroscope could give an exact value closer to the ideal simulation by the comparing of the peaks of amplitude and phase as showed in Figure 6 and 7.
3.2. The characteristics of the sensor according to sensor position
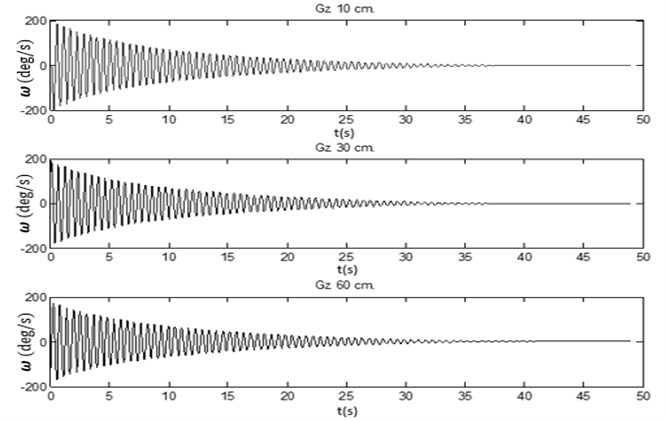
Figure 8-10 illustrate the difference between the characteristics of the accelerometers and the gyroscopes as the experimental results.
We found that both of the accelerometer and the gyroscope gave different information depending on 3-axis. However, in comparison of the position of the sensor attached, the acceleration gave a different information that is dependent on the distance of the sensor attached far from the pivot. In contrast, the gyroscope gave the same information but did not involve the distance of sensor attached and pivot (see Figure 8 and 9). As shown in Figure 10, the comparison of angular velocity of the z-axis of the gyroscope at three different positions are giving the same information.
Fig. 8The comparison of the 3-axis acceleration at three different positions
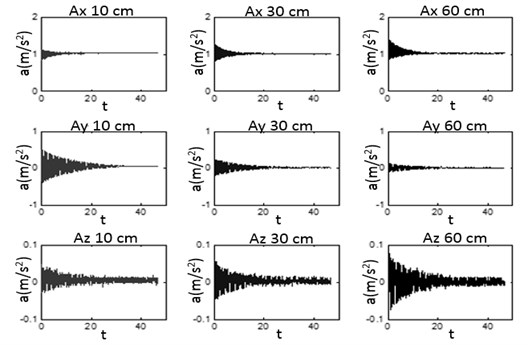
Fig. 9The comparison of the 3-axis gyroscope at three different positions
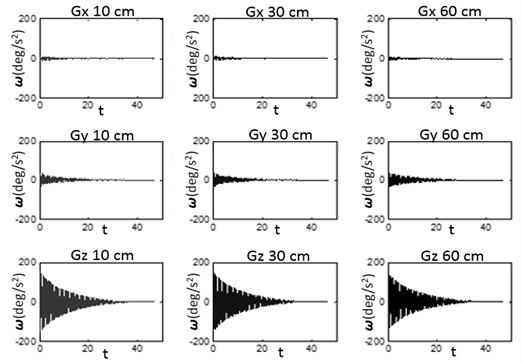
Fig. 10The comparison of the angular velocity on the z-axis of gyroscope sensor at three different positions
3.3. The magnitude of 3-axis vector
We represented 3-dimensional vectors of the accelerometer and the gyroscope in forms such as the magnitude or length. The magnitude can be described as the length of a vector as showed in Eq. (10).
The 3-axis vector of the accelerometer and the gyroscope express different information for each perpendicular axis, but the the magnitude from Eq. (10) should be proportional to the 3-axis vector as shown in Figure 11 and 12. As such, the magnitude (scalar value) of 3-axis of the accelerometer and the gyroscope are proportional to the 3-axis vector. The magnitude of acceleration and angular velocity could be used to analyze the human body sway.
Fig. 11The comparison of 3-axis accelerations data and its magnitudes: a) the acceleration of x-axis, b) the acceleration of y-axis, c) the acceleration of z-axis, d) the magnitude of 3-axis acceleration

a)

b)

c)

d)
4. Discussion
The aim of this study is to illuminate the realibility of signals between the accelerometer and the gyroscope which associate with the body sway measurement by using the pendulum model. Normally in a standing human, there are small sways of the body because a normal person try to maintain the equilibrium of the body.
Several authors have provided that the body sway of human in quiet standing is like the motion of an inverted pendulum, and the ankle is the pivot point [16, 17]. Furthermore, several commercial systems have used either the accelerometer or the gyroscope attached to different parts of body to analyze body sway of the patient [12, 13]. From this, the questions we are pursuing are as follows:
First, the signal correction of our sensors to use in analyzing the patient’s body sway by comparing to the simple pendulum simulation. Even though the sway of human is comparable to the movement of the inverted pendulum, we tried to illuminate the real signals from the simple pendulum experiments to show the realistic outputs of both sensors. From the experiments, it was similar to the signals from the theory of the pendulum simulation. The results showed that our sensors are reliable enough and could be used in the body sway analysis by comparing the amplitude and phase of acceleration and the gyroscope signals. Therefore, the signals from accelerometer and the gyroscope were showed the decay signals because it’s normally of oscillation from the pendulum movement.
Fig. 12The comparison of 3-axis of angular velocities and the magnitude by: a) the angular velocity of x-axis, b) the angular velocity of y-axis, c) the angular velocity of z-axis and d) is magnitude from 3-axis angular velocity

a)

b)

c)

d)
Second, the sensors of body sway analysis can be placed on the different parts of a human body whose movements are being studied. For example, sensor placement need to be placed close to the center of mass in order to measure body sway. Therefore, either of the accelerometer and the gyroscope sensors is commonly placed on the sternum, lower back or waist [33]. Next, we tried to find reliable measurements from either the accelerometer or the gyroscope sensor which depends on the location to the part of body. We discovered that the gyroscope does not actually depend on the location of the sensor attached, but the accelerometer does (Figure 8-10). However the sensor selection for body sway analysis depends on the hypothesis of the researcher.
Third, some studies stated that the results of using the accelerometer (which responds to gravity) can be distinguished with knowing the magnitude of the acceleration signals along the sensitive axes. This value is acquired by just wearing only one accelerometer at the waist or torso [33]. Consequently, it is challenging us to provide the results of magnitude of 3-axis vector of the acceleration signals and the gyroscope signals which might be proportional to the 3-axis vector. The results revealed that both the accelerometer and the gyroscope could give values proportional to the 3-axis vector. It means that the magnitude of 3-axis vector of the accelerometer and the gyroscope can be used to analyze the body sway. Figure 11 shows the comparison of 3-axis acceleration signals and the magnitude (A), and Figure 12 shows comparison of the 3-axis of gyroscope signals and the magnitude. Both sensors could give the magnitude proportional to the 3-axis vector with the absolute value that are used for Eq. (10).
5. Conclusion
This study aimed to compare the characteristic of the body sway analysis sensors and to find the optimal sensor that is reliable for the human body sway analysis. The pendulum model was chosen to simulate the human body sway as its pivot and was presumed to be equal to the COM of the human body.
Experiments were performed on the accelerometer and the gyroscope attached to the pendulum on three different positions. The results showed different characteristics between the accelerometer and the gyroscope. The former was dependent on where the sensor was attached to the pendulum, while the latter was independent. It can be implied that the gyroscope is more stable than the accelerometer in case of varying the sensor position.
Finally, the magnitude (scalar) of the 3-axis vector as well as the information of three individual axis vectors could be useful in the body sway analysis because its magnitudes also reflect body sway.
References
-
Rudge P., Bronstein A. Investigations of disorders of balance. Journal of Neurology Neurosurgery and Psychiatry, Vol. 59, Issue 6, 1995, p. 568.
-
Troost B. T. Dizziness and vertigo in vertebrobasilar disease. Part II: Central causes and vertebrobasilar disease. Stroke, Vol. 11, Issue 4, 1980, p. 413-415.
-
Brandt T., Strupp M. General vestibular testing. Clinical Neurophysiology, Vol. 116, Issue 2, 2005, p. 406-426.
-
Kelleher K., Spence W., Solomonidis S., Apatsidis D. The effect of textured insoles on gait patterns of people with multiple sclerosis. Gait & Posture, Vol. 32, Issue 1, 2010, p. 67-71.
-
Kimura Y. J. H. Balance-keeping control of upright standing in biped human beings and its application for stability assessment. Humanoid Robots, New Developments, 2007, p. 582.
-
Stone E., Skubic M. Evaluation of an inexpensive depth camera for in-home gait assessment. Journal of Ambient Intelligence and Smart Environments, Vol. 3, Issue 4, 2011, p. 349-361.
-
Wang F., Skubic M., Abbott C., Keller J. M. Body sway measurement for fall risk assessment using inexpensive webcams. IEEE Engineering in Medicine & Biology Society, 2010, p. 2225-2229.
-
Chang M. Review of clinical applications with human accelerometry. Technical Report No. 06/12, 2006.
-
Mayagoitia R. E., Lötters J. C., Veltink P. H., Hermens H. Standing balance evaluation using a triaxial accelerometer. Gait & Posture, Vol. 16, Issue 1, 2002, p. 55-59.
-
Luinge H. J. Inertial sensing of human movement. Twente University Press, Netherlands.
-
Wall Iii C., Kentala E. Control of sway using vibrotactile feedback of body tilt in patients with moderate and severe postural control deficits. Journal of Vestibular Research, Vol. 15, Issue 5, 2005, p. 313-325.
-
Amiridis I. G., Hatzitaki V., Arabatzi F. Age-induced modifications of static postural control in humans. Neuroscience Letters, Vol. 350, Issue 3, 2003, p. 137-140.
-
Geldhof E., Cardon G., De Bourdeaudhuij I., Danneels L., Coorevits P., Vanderstraeten G., De Clercq D. Static and dynamic standing balance: test-retest reliability and reference values in 9 to 10 year old children. European Journal of Pediatrics, Vol. 165, Issue 11, 2006, p. 779-786.
-
Luinge H., Veltink P. H. Measuring orientation of human body segments using miniature gyroscopes and accelerometers. Medical and Biological Engineering and Computing, Vol. 43, Issue 2, 2005, p. 273-282.
-
Mancini M., Horak F. B. The relevance of clinical balance assessment tools to differentiate balance deficits. European Journal of Physical and Rehabilitation Medicine, Vol. 46, Issue 2, 2010, p. 239.
-
Loram I. D., Lakie M. Human balancing of an inverted pendulum: position control by small, ballistic-like throw and catch movements. The Journal of Physiology, Vol. 540, Issue 3, 2002, p. 1111-1124.
-
Gage W. H., Winter D. A., Frank J. S., Adkin A. L. Kinematic and kinetic validity of the inverted pendulum model in quiet standing. Gait & Posture, Vol. 19, Issue 2, 2004, p. 124-132.
-
Garcia M., Chatterjee A., Ruina A., Coleman M. The simplest walking model: stability complexity and scaling. Journal of Biomechanical Engineering, Vol. 120, Issue 2, 1998, p. 281-288.
-
Winter D. A., Patla A. E., Prince F., Ishac M., Gielo-Perczak K. Stiffness control of balance in quiet standing. Journal of Neurophysiology, Vol. 80, Issue 3, 1998, p. 1211-1221.
-
Karlsson A., Frykberg G. Correlations between force plate measures for assessment of balance. Clinical Biomechanics, Vol. 15, Issue 5, 2000, p. 365-369.
-
Scientific P. Accelerometers: theory and operation. http://shascience.com/physics/accel_manual.pdf.
-
O. E. inc. OMEGA. http://www.omega.com/prodinfo/accelerometers.html.
-
Electronics S. Sparkfun. https://www.sparkfun.com/products/10736.
-
https://www.sparkfun.com/products/10736.
-
Griffin B., Huber B., Wallner A., Fink T. A sense of balance-AHRS with low-cost-vibrating-gyroscopes for medical diagnostics. Symposium Gyro Technology, 1997.
-
The MathWorks, Mathwork. http://www.mathworks.com/products/?s_tid=gn_ps
-
Picken D. The simple pendulum. The Mathematical Gazette, Vol. 7, Issue 107, 1913, p. 173-175.
-
Greenhill G. The simple pendulum. The Mathematical Gazette, Vol. 7, Issue 108, 1913, p. 189-192.
-
Pinot P., Genevès G. Numerical simulation for designing tuned liquid dampers to damp out double pendulum oscillations. Measurement Science and Technology, Vol. 22, Issue 6, 2011.
-
Karantonis D. M., Narayanan M. R., Mathie M., Lovell N. H., Celler B. G. Implementation of a real-time human movement classifier using a triaxial accelerometer for ambulatory monitoring. Information Technology in Biomedicine IEEE Transactions on, Vol. 10, Issue 1, 2006, p. 156-167.
-
Lee M. H., Kim J., Jee S. H., Yoo S. K. Integrated solution for physical activity monitoring based on mobile phone and PC. Healthcare Informatics Research, Vol. 17, Issue 1, 2011, p. 76-86.
-
Zijlstra W., Bisseling R. Estimation of hip abduction moment based on body fixed sensors. Clinical Biomechanics, Vol. 19, Issue 8, 2004, p. 819-827.
-
Yang C. C., Hsu Y. L. A review of accelerometry-based wearable motion detectors for physical activity monitoring. Sensors, Vol. 10, Issue 8, 2010, p. 7772-7788.
About this article
This research was supported by the Pioneer Research Center Program through the National Research Foundation of Korea funded by the Ministry of Education, Science and Technology (2009-0082947).
