Abstract
This paper presents a new technique to diagnose differentially two localized gear tooth faults: a pitting and a crack. These faults could have very different prognoses, but existing diagnostic techniques only indicate the presence of local tooth faults without being able to differentiate between a pitting and a crack. In the aim to diagnose differentially these tow faults, a dynamic model of one stage spur gear is proposed witch make it possible to simulate the effect of pitting and crack faults on the vibration signal. Then, simulated vibration signal is analyzed by using a Fast-Kurtogram technique. This method is suitable for differentiate between a pitting and a crack faults.
1. Introduction
Development of gear-failure diagnostic techniques based on vibration signal analysis has been an active area of research for more than two decades. An ability to detect emerging damage in the gears has contributed significantly to prevent catastrophic failures in industrial machines and aerial vehicles. The vibration signal-based fault diagnostic technique is one of the most effective non-intrusive techniques available. Using the existing techniques it is possible to monitor the health of an operating machine and detect and locate a fault in a gear tooth [1-8]. The objective of this paper is to present a new technique to differentiate tooth pitting from gear tooth cracks. These two faults could have very different prognoses; however existing diagnostic techniques do not differentiate between a crack and a pitting. Without a reliable knowledge of the fault type present in the gears, prognosis cannot be performed. In this aim a dynamic model of one stage spur gear is proposed witch make it possible to simulate the effect of pitting and crack faults on the vibration signal. Then, simulated vibration signal is analyzed by using a Fast-Kurtogram technique. This method is suitable for differentiate between a pitting and a crack faults.
2. Modeling of a one stage spur gear transmission
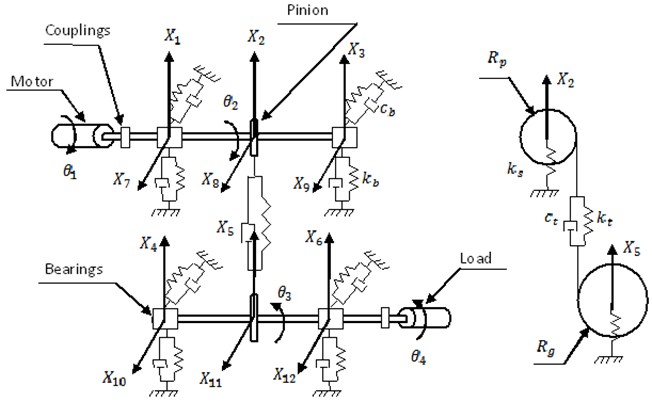
The model developed here is based on a single stage reduction gearbox. The main parameters that are considered in the model are given in Table 1. There are a total of 16 degrees of freedom in the model and a schematic diagram of the model which is shown in Fig. 1.
The major assumptions which the dynamic model is based upon are the following:
1) Gear case resonances are neglected.
2) Shaft mass and inertia are lumped at the bearings or the gears.
3) Shaft transverse resonances are neglected.
4) Shaft torsional stiffness is ignored (flexible coupling torsional stiffness is very low).
5) Gear teeth profiles are perfect involute curves, with no geometrical, pitch or run out errors.
6) Inter-tooth friction is ignored.
Table 1Major parameters of the spur gears used in this model
Moments of inertia for electric motor (Im) | 0.023976 kg∙m2 |
Moments of inertia for pinion (Ip) | 4.3659e-4 kg∙m2 |
Moments of inertia for output gear (Ig) | 8.3602e-3 kg∙m2 |
Moments of inertia for driven machine (IL) | 0.01015 kg∙m2 |
Mass of the bearing and part of the shaft (m) | 0.5134 kg |
Mass of the input pinion (mp) | 0.96 kg |
Mass of the gear (mg) | 2.88 kg |
Output torque from load (Tr) | 25 Nm |
Torsional stiffness of the flexible coupling (kc) | 4.4e4 Nm/rad |
Viscous damping coefficient of flexible coupling (cc) | 5e5 Nm∙s/rad |
Base circle radius of pinion (Rp) | 0.0301 m |
Base circle radius of output gear (Rg) | 0.0761 m |
Radial stiffness of the bearing (kb) | 6.56e7 N/m |
Viscous damping coefficient of the bearing (cb) | 1.8e5 N∙s/m |
Shaft transverse stiffness ks | 7.42e7 N/m |
Number of teeth on pinion and gear | Zp= 19; Zg= 48 |
Fig. 1Diagram of the 16-degree-of-freedom gear dynamic model. Note that the vertical direction is aligned with the pressure line of the gear mesh
The obtained equations of motion describing the model are given as follows:
+Rpct(Rp˙θ2-Rg˙θ2-˙X2+˙X5)=0,
+Rgct(Rp˙θ3-Rg˙θ2-˙X5+˙X2)=0,
+ct(˙X2-˙X5-Rp˙θ2+Rg˙θ3)=0,
+ct(˙X5-˙X2-Rg˙θ3+Rp˙θ2)=0,
3. Gear mesh stiffness evolution
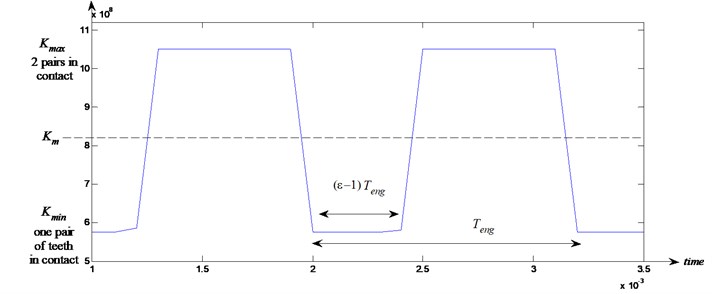
The teeth in a healthy gear in good running condition will deflect under load. The meshing process is always varying from one and two pairs of teeth in contact [8]. The duration of contact depends on the contact ratios ε. As a consequence, the gear mesh stiffness will fluctuate around a mean value km as shown in Fig. 2.
Fig. 2Time variation of stiffness gear mesh k(t) of the pair of gears
As a consequence, gear mesh stiffness can be approximated by [8]:
where ε represents the contact ratio and n is an integer representing the nth gear mesh period.
Fourier development of k(t) yields to:
with: and .
By introducing the gear stiffness ratio and using some geometrical and material properties, the maximum and the minimum value of the gear stiffness can be calculated [9]:
where 2.068 1011 N/m2 is the mean value of Young’s modulus of the gear bodies, 0.16 m is the effective width of meshing gears, 0.47 is the shape factor and 0.5476 is the stiffness ratio.
This meshing process is considered as the main excitation source of the system. The vibratory response will be dominated by the gear mesh frequency, , and its harmonics, which are defined by:
where and are the rotational frequency of pinion and gear respectively, and and are the tooth numbers of the pinion and gear respectively.
4. Effect of pitting and gear tooth cracks on the gear mesh stiffness evolution
It has been established [10] that gear tooth failure will induce amplitude and phase changes in vibration, which in turn can be represented by magnitude and phase changes in gear mesh stiffness. The tooth failure-induced variations in gear mesh stiffness used for the simulations are given in Fig. 3.
Fig. 3Stiffness changes in gear mesh stiffness model
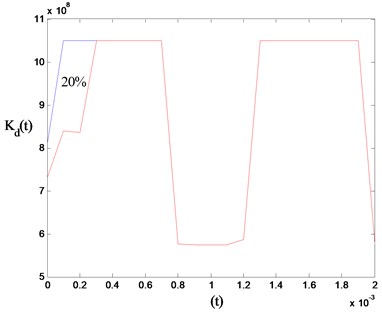
a) Tooth flank pitting
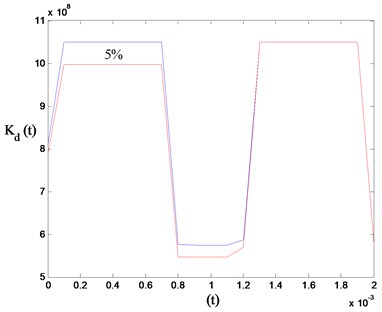
b) Tooth cracking
The undamaged configuration of the mesh stiffness is given by 0 % phase change and 0 % amplitude reduction. Amplitude and phase changes are applied on gear mesh stiffness from these reference values to simulate surface pitting and tooth cracking.
An amplitude modulation of the gear mesh signal is expected from these defect-induced changes. In fact, the new gear mesh signal, , resulting from the defect modeling can be expressed by [8]:
where is the modulating function.
As a result of this amplitude modulation, an exciting force appears, and the frequency content of the response is also affected.
5. Numerical simulations of the dynamic response
The dynamic response of the transmission is computed to look for the different vibratory signatures obtained from each fault introduced. A focus is made on the pinion-bearing responses.
Several diagrams of the integration of Eq. (1)-(16) are found in the literature. The best known is the implicit algorithm of new mark [12]. The response is then obtained in the time domain, and the spectrum is obtained by Fast Fourier transform.
5.1. Dynamic response for healthy planetary gear
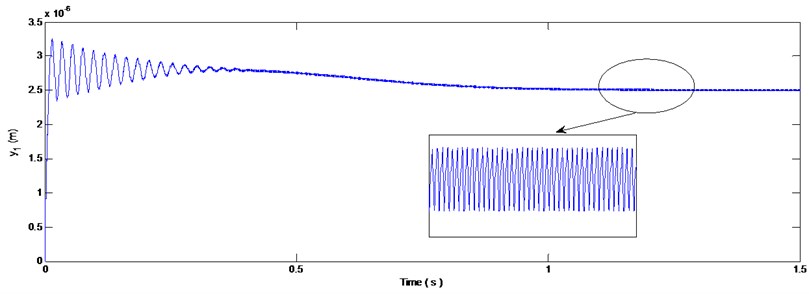
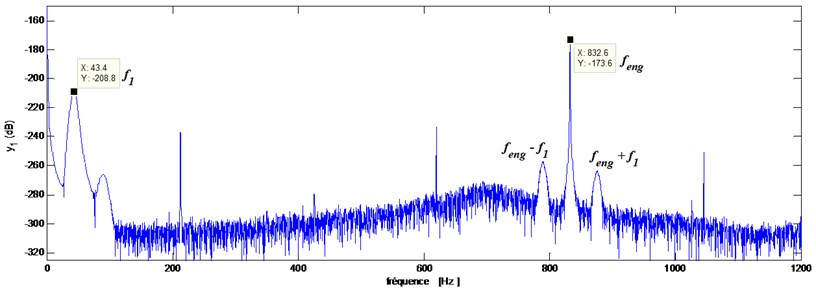
A healthy gear is modeled as being geometrically perfect. The spectrum of pinion-bearing responses is presented in Fig. 4(b), where rotational component at frequency , meshing component at frequency and two sidebands components, at frequencies () and (), are highlighted. This state will serve as a reference for the following simulations where defects are introduced.
Fig. 4Simulated results
a) Pinion-bearing responses in the time domain
b) Pinion-bearing responses in the frequency domain
5.2. Effect of pitting and tooth cracking
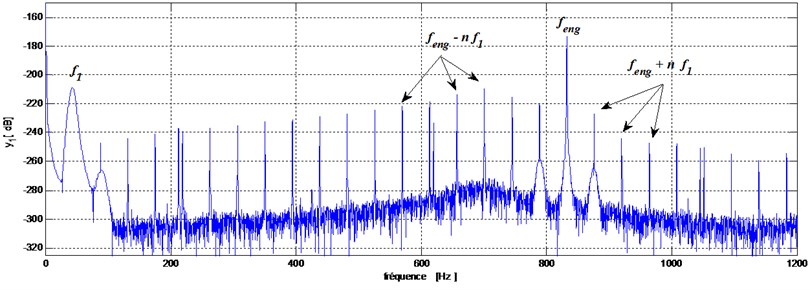
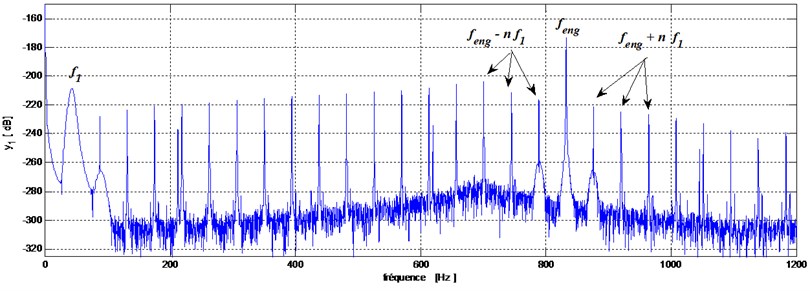
A pitting fault is modeled on the pinion by a phase change and anamplitude reduction of gear mesh stiffness of 20 % when these teeth are in mesh with the gear. The second simulation is made with the tooth of the gear having a crack modeled by an amplitude loss of 5 %. Obtained spectrums for these two cases are shown in Fig. 5(a) and Fig. 5(b).
From these spectrums we can observe that the presence of these two defects (pitting or crack) cause the apparition of new frequency components at frequencies that are the results of the meshing frequency modulation due to the rotational frequency of the defected tooth.
From this result we can conclude that the FFT analysis allows detecting pitting and cracking faults however this method failed to differentiate these two defects. Because the transient signal created by these two defects have a same frequency () and therefore cause the apparition of the same frequency components in the spectrum. To overcome this problem and to diagnosis deferentially these two defects we propose to use the Kurtogram method.
Kurtogram is a fourth-order spectral analysis tool recently introduced for detecting and characterizing transients in a signal. The paradigm relies on the assertion that each type of transient is associated with an optimal (frequency/frequency resolution) dyad in the Kurtogram. In fact, transients created in vibration signal by a pitting fault differ from transients created by a tooth crack fault in nature because the effect in the meshing gear is different, and therefore different associated dyad in the Kurtogram.
Fig. 5Pinion-bearing responses in the frequency domain
a) Tooth pitting fault
b) Tooth cracking fault
6. Fast Kurtogram method for differentiating pitting and tooth cracking faults
The Kurtogram method was first introduced by Antoni and Randall [11], which comes from spectral kurtosis (SK) [12]. The SK method selects kurtosis as a measure of distance between an arbitrary random process and a Gaussian one with the aim of detecting the existence of transients in a signal. The SK value of the signal is obtained by calculating kurtosis of each frequency component contained in the signal. SK finally represents the transient characteristics of the signal as a function of frequency. SK can indicate not only transient components in the signal but also their locations in the frequency domain, and therefore overcome the disadvantages of the power spectral density in detecting and characterizing signal transients.
The SK of a signal is defined as the normalized fourth order spectral moment [13] as follows:
where stands for the time averaging operator, and represents the time / frequency envelope of signal . can be estimated by the short-time Fourier transform (STFT):
where is the analysis window with length . The SK is expected to be very sensitive to non stationary transients in a signal and to indicate exactly at which frequencies those transients occur. This technique was investigated in detail by Antoni, and led to the concept of the “Kurtogram”, which is a diagram indicating the optimum centre frequency and bandwidth combination of a band pass filter to maximize the kurtosis of the filter output. A more detailed explanation of Kurtogram can be found in Refs [11, 14]. The fast Kurtogram algorithm used in this paper can be directly found at Antoni’s homepage [15].
The obtained results of the Kurtogram of vibration response registered on the pinion bearings for the healthy gear are shown in Fig. 6. We note that the maximum value of the spectral kurtosis is (0.1) at dyad (819.1875 Hz4505.5313 Hz).
Fig. 6Fast Kurtogram of the pinion-bearing responses for the healthy mode. The maximum is reached at dyad (819.1875 Hz / 4505.5313 Hz)
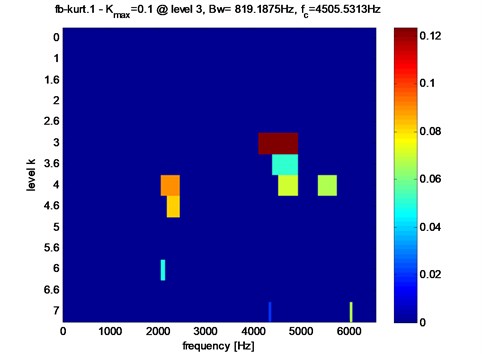
Fig. 7Pinion-bearing responses Kurtogram of the gear tooth in presence of faults
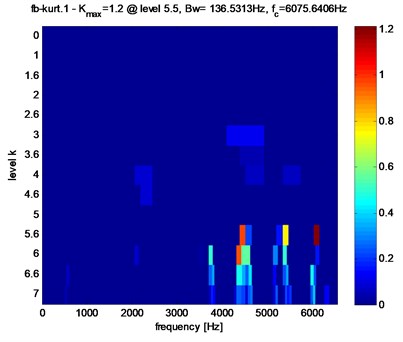
a) Pitting fault
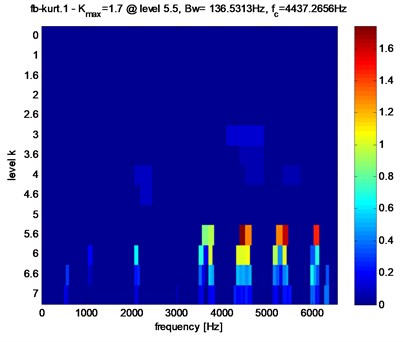
b) Crack fault
Kurtogram for the same registration location in the presence of pitting and crack faults are shown in Fig. 7. The obtained Kurtogram’s results of Fig. 7, show clearly the abnormal high value of the spectral Kurtosis: (1.2) at dyad (138.5313 Hz6075.6408 Hz) for pitting fault and (1.7) at dyad (138.5313 Hz4437.2666 Hz) for tooth crack fault. It clearly reveals the presence of sharp abnormal shocks in the signal. Note also that in the case of pitting fault the maximum value of spectral kurtosis is located at dyad (138.5313 Hz6075.6408 Hz), but on the other hand in the crack fault case, the maximum value of spectral kurtosis is located at dyad (138.5313 Hz4437.2656 Hz).
7. Conclusion
In this paper, a dynamic model of a spur gear was developed to examine the gear dynamic behavior in the presence of defects such as tooth pitting and cracking. These two defects were discussed and modeled by an amplitude and phase changes on gear mesh stiffness.
Frequency response was computed in a healthy gear and showed the dominance of the gear mesh frequency. The simulations including the two types of tooth defects showed the appearance of sidebands around gear mesh frequency.
We showed that the Fast-Kurtogram method is able to differentiate gear tooth cracks from tooth pitting faults. The obtained results showed that the etch defects have specific dyad which maximize the spectral kurtosis value. Such result is very useful in a condition-monitoring system particularly when the defect is in its early stage of failure in the spur gear set. The proposed Fast-Kurtogram analysis based on vibration measurements is a powerful tool which can detect and differentiate the tooth cracks from tooth pitting compared to the actual spur gear analysis.
References
-
Wong A. K. Vibration-based helicopter health monitoring – an overview of the research program in DSTO. DSTO HUMS2001, 2001.
-
Decker H. J. Gear crack detection using tooth analysis. NASA-TM2002-211491, 2002.
-
Decker H. J. Crack detection of aerospace quality gears. NASA-TM2002-211492, 2002.
-
Larder B. D. Helicopter HUM/FDR: benefits and developments. American Helicopter Society 55th Annual Forum, Montreal, Quebec, Canada, 1999.
-
McColl J. Overview of transmissions HUM performance in UK, North Sea helicopter operations. Institution of Mechanical Engineers, Seminar S553, 1997.
-
Chaari F., Fakhfakh T., Haddar M. Numerical simulation of the dynamic behavior of a gear transmission in the presence of defects in teeth. Mechanical & Industries, Vol. 6, 2006, p. 625-633, (in French).
-
Mahgoun H., Bekka R. E., Felkaoui A. Gearbox fault diagnosis using ensemble empirical mode decomposition (EEMD) and residual signal. Mechanics and Industry, Vol. 13, Issue 1, 2012, p. 33-34.
-
Rahmoune C., Benazzouz D. Early detection of pitting failure in gears using a spectral kurtosis analysis. Mechanics and Industry, Vol. 13, Issue 4, 2012, p. 245-254.
-
Ebrahimi S., Eberhard P. Rigid-elastic modeling of meshing gear wheels in multibody systems. Multibody System Dynamics, Vol. 16, 2006, p. 55-71.
-
Choy F. K., Polyshchuk V., Zakrajsek J. J., Handschuh R. F., Townsend D. P. Analysis of the effects of surface pitting and wear on the vibrations of a gear transmission system. Tribology International, Vol. 29, 1996, p. 77-83.
-
Antoni J., Randall R. B. The spectral kurtosis: application to the vibratory surveillance and diagnostics of rotating machines. Mechanical Systems and Signal Processing, Vol. 20, 2006, p. 308-331.
-
Dwyer D. F. Detection of non-Gaussian signals by frequency domain kurtosis estimation. Proceedings of the International Conference on Acoustic, Speech, and Signal Processing, Boston, 1984, p. 607-610.
-
Antoni J. The spectral kurtosis: a useful tool for characterizing non-stationary signals. Mechanical Systems and Signal Processing, Vol. 20, 2006, p. 282-307.
-
Antoni J. Fast computation of the kurtogram for the detection of transient faults. Mechanical Systems and Signal Processing, Vol. 21, 2007, p. 108-124.
-
Antoni J. Web page, http://www.utc.fr/_antoni/S.
