Abstract
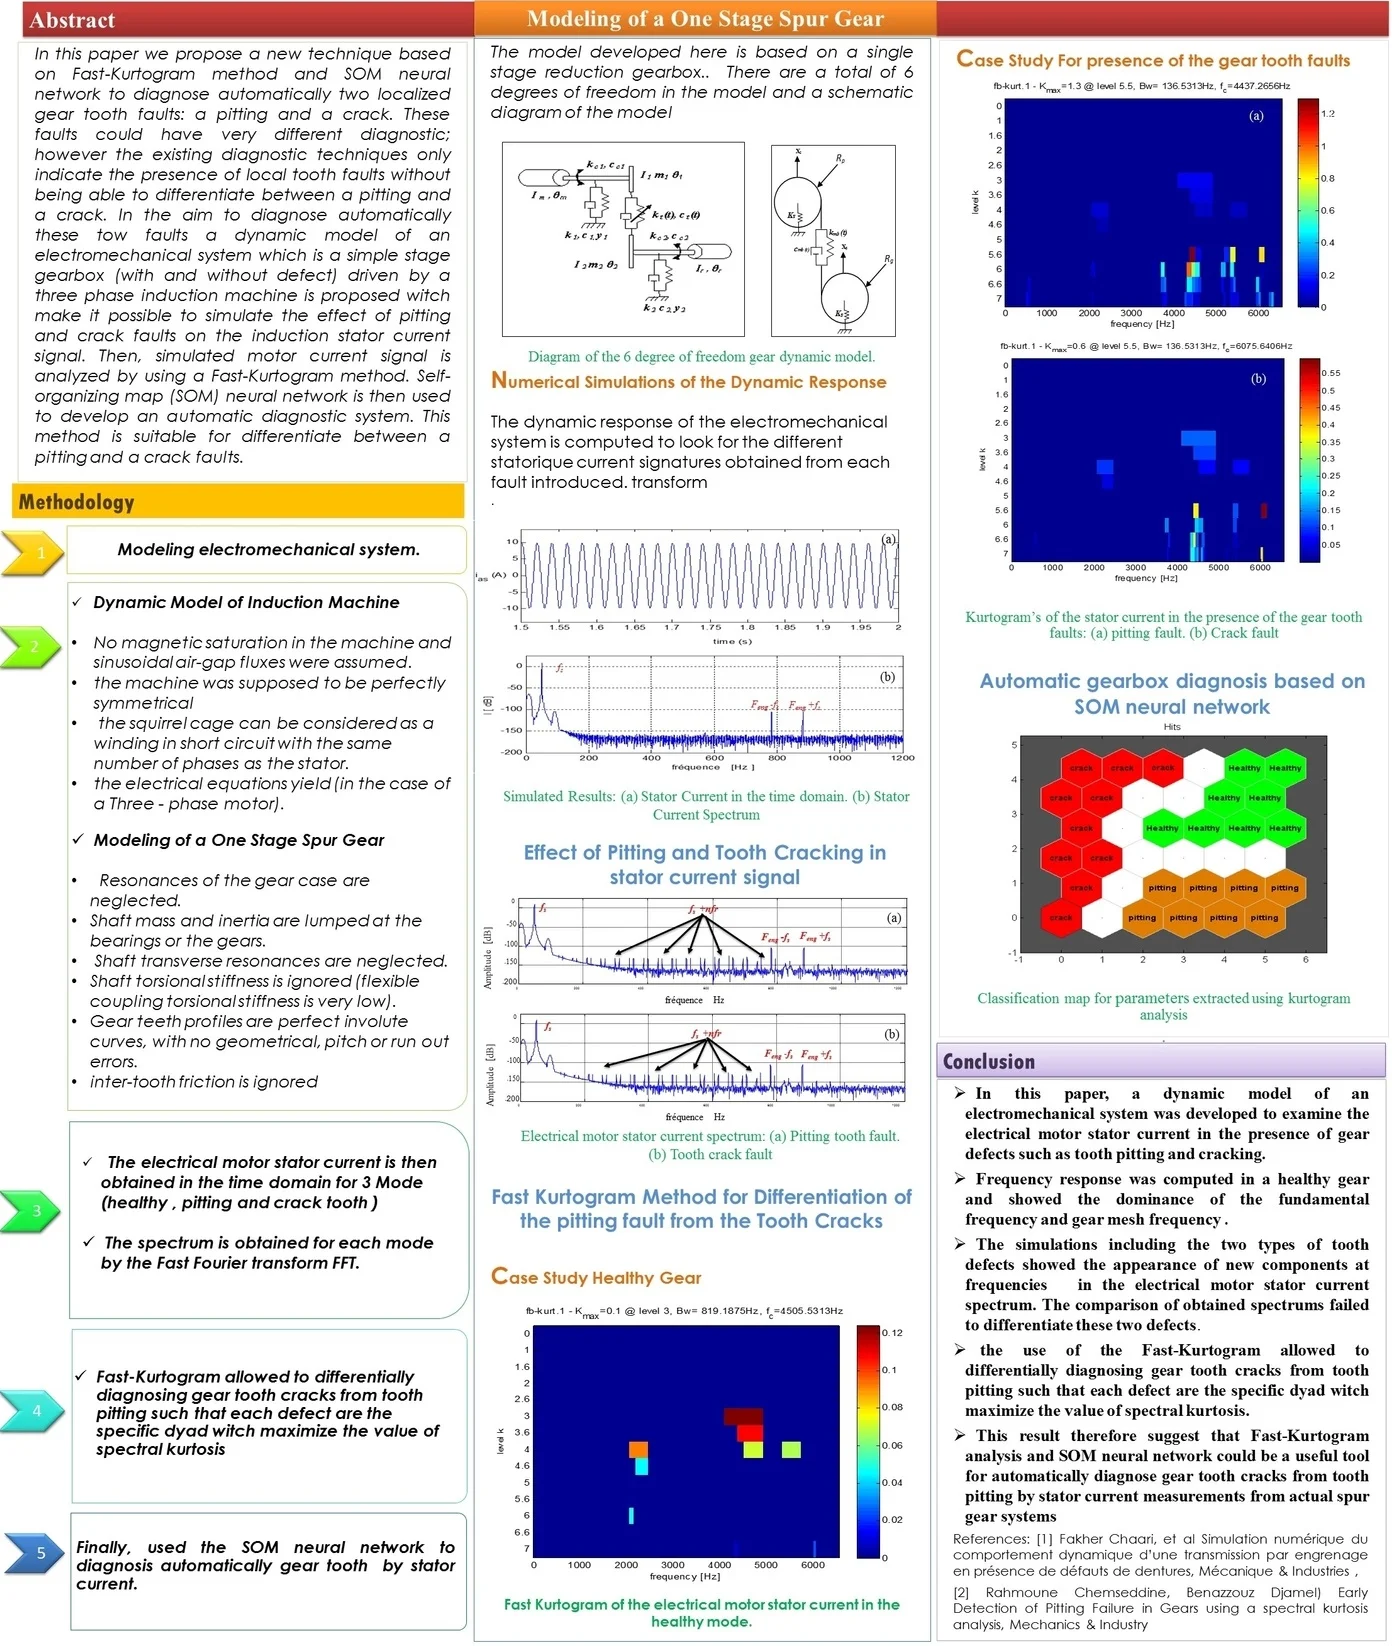
Condition monitoring and fault diagnosis play the most important role in industrial applications. The gearbox system is an essential component of mechanical system in fault identification and classification domains. In this paper, we propose a new technique which is based on the Fast-Kurtogram method and Self Organizing Map (SOM) neural network to automatically diagnose two localized gear tooth faults: a pitting and a crack. These faults could have very different diagnostics; however, the existing diagnostic techniques only indicate the presence of local tooth faults without being able to differentiate between a pitting and a crack. With the aim to automatically diagnose these two faults, a dynamic model of an electromechanical system which is a simple stage gearbox with and without defect driven by a three phase induction machine is proposed, which makes it possible to simulate the effect of pitting and crack faults on the induction stator current signal. The simulated motor current signal is then analyzed by using a Fast-Kurtogram method. Self-organizing map (SOM) neural network is subsequently used to develop an automatic diagnostic system. This method is suitable for differentiating between a pitting and a crack fault.
Highlights
- A new technique is proposed which is based on the Fast-Kurtogram method and Self Organizing Map (SOM) neural network to automatically diagnose two localized gear tooth faults: a pitting and a crack.
- The aim to automatically diagnose these two faults, a dynamic model of an electromechanical system which is a simple stage gearbox with and without defect driven by a three phase induction machine.
- The induction stator current signal is simulated of three working modes, the healthy mode, the gear crack tooth and the gear pitting tooth.
- Self-organizing map (SOM) neural network is used to develop an automatic diagnostic system. This method is suitable for differentiate automatically between a pitting tooth and a crack tooth fault.
1. Introduction
Gearbox based induction motors are one of the most popular mechanisms in industrial machinery. Their safety, reliability, efficiency and performance are highly considered by engineers. Although induction motors and their transmission mechanisms are reliable, they are subject to failures. Recent studies show that more than 40 % of gearbox-induction machine failures are related to bearings and gear tooth [1]. In this type of failure, they must be detected as soon as possible to avoid fatal machine breakdowns which may cause an increase in maintenance costs and leads to production loss. The gear crack tooth and gear pitting tooth are the most common gear faults.
Nowadays, many methods have been developed for detection gear tooth pitting and gear tooth crack. The early detection and diagnosis of gear tooth pitting, spalls, and gear tooth cracks is becoming an important issue in modern machines operating with high speed and high-power environment. Many different methods to detect and diagnose localized gear faults have been proposed including: vibration analysis [2], acoustic emission analysis [3, 4] and motor current signal analysis (MCSA) [5-8]. The induction stator current signal-based fault diagnostic method is one of the most used ones for monitoring failure and the most effective non-intrusive method available.
The approach of MSCA was developed in the 80s at the Oak Ridge National labs [9]. The MSCA method has been mostly applied for motor detection fault such as the bearings faults and broken bar [10]. However, we take the most challenging task to detect fault in gear system related to the driven system.
By using this technique based on the MCSA method (i.e. time, frequency and time-frequency), it is possible to monitor the health of an operating machine and to detect faults. Many researchers have developed methods to detect and locate faults in a gear tooth but, do not differentiate between a tooth crack and a tooth pitting, because tooth damage causes a reduction in gear tooth stiffness and the severity of tooth damage can be assessed by determining this reduction in stiffness. All these reduction in gear tooth stiffness have been studied by many authors [11-14] and these studies show the correlation between the severity of the damage and the reduction in stiffness, but unfortunately which give as the same characteristics of signature for each fault. For this reason, we have proposed our approach based on MCSA, spectral kurtosis and the SOM neural network for diagnosis, which provides valuable information on the presence and differentiate of gear tooth defects.
However, a proposed signals processing method, namely Fast-Kurtogram method developed by Antoni and Randall [15], was demonstrated to be superior to wavelet analysis in many applications [16]. The Kurtogram is a fourth order spectral analysis tool recently introduced for detecting and characterizing transients in a signal. The paradigm relies on the assertion that each type of transient is associated with an optimal frequency/frequency resolution (dyad {f, Bw}) which maximizes its kurtosis, and hence its detection.
The self-organizing map (SOM) neural network was developed by Kohonen [17]. The SOM neural network learning without instructors, which has self-adaptive and self-learning characteristics [18].The SOM neural network has the unique ability to efficiently create spatially organized internal representations of several input data characteristics, providing a topology that preserves the high-dimensional spatial map in only two-dimensional spaces [19].The SOM feature can be used to separate neurons with small similarities, because the neurons with large similarities on the map are very close [20]. Therefore, the SOM neural network is applied for automatic gear defects identification and classification.
With the aim of developing an automatic system which makes it possible to diagnose differentially these two faults, a dynamic model of an electromechanical system, which is a simple stage gearbox (with and without defect) driven by a three-phase induction machine, is proposed. After that, we are simulated the induction stator current signal of three working mode, the healthy mode, the gear crack tooth and the gear pitting tooth. Finally, Self-organizing map (SOM) neural network is used to develop an automatic diagnostic system. This method is suitable for differentiate automatically between a pitting tooth and a crack tooth fault.
2. Electromechanical system modeling
In this study, an electromechanical system was proposed, composed of an induction motor physically coupled with a new single stage gearbox. Furthermore, the induction motor was supposed to be perfectly symmetrical, and the squirrel cage can be considered as a winding in short circuit with the same number of phases as the stator. Hence, the electrical equations yield in the case of a Three-phase motor. In the other side, in the mechanical part, the major assumptions of the dynamic model are based upon are [21]:
1) Neglect the resonances of the gear case and the shaft transverse resonances;
2) Inertia and shaft mass are lumped at the bearings;
3) Ignore the shaft torsional stiffness (because the flexible coupling torsional stiffness is very low) and inter-tooth friction;
4) Gear teeth profiles are perfect involutes curves, with no geometrical, pitch or run out errors.
The system is presented in order to simulate the effects of the tooth cracking, and tooth pitting on the dynamical behavior. The corresponding mathematical model has been developed:
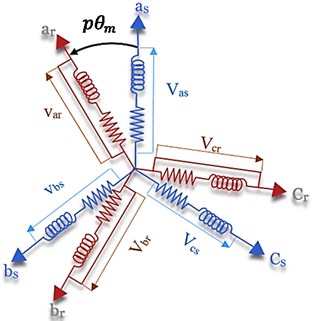
where [vsi]; [vri] are the stator and rotor voltages, Rs and [ϕsi](Rr;[ϕri]) are, respectively, the stator (rotor) resistance and fluxes (see Fig. 1)
Fig. 1Asynchronous machine modeling (three-phase case)
Using the inductance matrix [L(pθm)], p which represents the number of poles pairs and θm the mechanical angular position of the rotor, Eqs. (3), (4) can be rewritten as functions of the currents.
The Concordia matrix combined with a rotation matrix under balanced conditions; this allows the reference frame to change from (abc) to (dq) and inversely:
The voltages [vsa,vsb,vsc]T and the stator currents [isa,isb,isc]T are consistent with the physical values. Can be expressed the Park model of the induction driver in the rotor reference frame (d,q) as follows:
where Rs is the stator resistance, Ls is the stator inductance, σ is the leakage factor, Tr is the rotor time constant, p which represent the number of poles pairs, and ω which represent the angular speed (i.e. mechanical speed).
For developing the electromagnetic torque equation, we need the electric power supplied to the rotor in the dq frame. In relation to the different electrical and magnetic parameters, the electromagnetic torque of the multi-polar induction motor is obtained, independently of the angle defining the dq frame as:
where kmb(t) and cmb(t) denote the gear mesh stiffness and damping functions, respectively. The inertias for the motor are Im, for the driven machine is Ir, Igfor the gear, and Ip for the pinion. The transverse stiffness of input and output of shafts is ks. The stiffness and damping elements of input and output Bearings are kb and cb, respectively. The stiffness and damping of the flexible couplings between the motor-pinion and the gear-load of the machine are kc and cc, respectively.
Fig. 2Diagram of the 16 degree of freedom DOF’s gear dynamic model
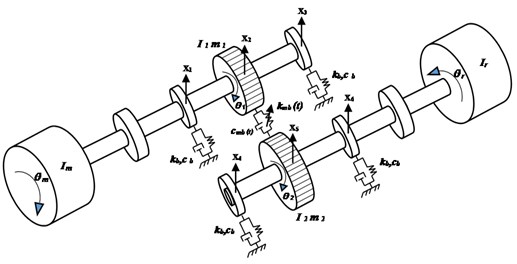
a)
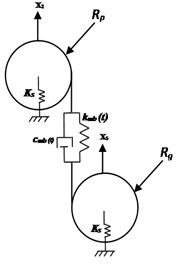
b)
3. Gearmesh stiffness modeling
The gears are designed so that a pair of teeth starts contact before the previous pair of gears is completed. In general, a square waveform is adopted to express this variation; the maximum value represents the gear mesh stiffness of two pairs in contact; the minimum value represents single pair gear mesh stiffness (Fig. 3).
Fig. 3Stiffness of healthy tooth gear mesh
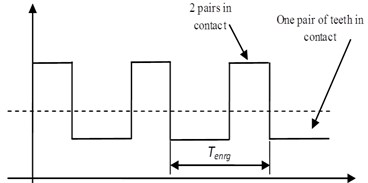
k(t) which represent the Pair of Gears in the case of healthy gear tooth (no crack). As a consequence, gear mesh stiffness can be approximated by Eq. (7):
where ε represents the contact ratio and n is an integer representing the nth gear mesh period.
Fourier development of k(t) Eq. (14) yields:
with: km=kmax(ε-1)+(2-ε)kmin, and Δk=kmax-kmin.
By introducing the gear stiffness ratio and using some geometrical and material properties, the maximum and minimum value of the gear stiffness can be calculated:
E= 2.068×10¹¹ N/m² which represent the mean value of Young’s modulus, b= 0.16 m which represent the effective width of meshing gears, s= 0.47 is the shape factor and r= 0.5476 which represent the stiffness ratio.
3.1. Gear tooth pitting and gear tooth crack modeling
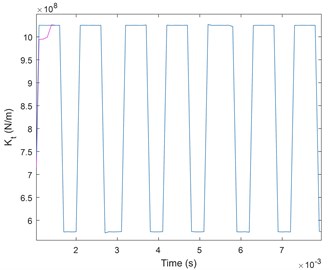
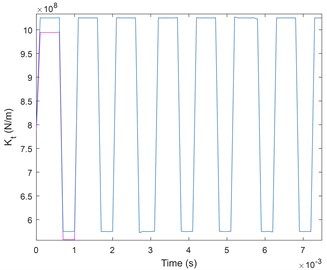
It has been proved, that the failure of a gear tooth will lead to changes in amplitude and phase in the stiffness of the gear mesh [22, 23]. The variations induced by tooth failure in the stiffness of the gears used for the simulations are given in Fig. 4.
Fig. 4Stiffness gear mesh in the case of: a) tooth pitting, b) tooth cracking
a)
b)
The normal functioning of the stiffness gear mesh is configured by 0 % phase change and 0 % amplitude reduction. The variation of amplitude and phase of gear mesh stiffness applied as a reference when the faults are introduced. After that, two faults have been simulated: tooth pitting and tooth crack.
The change of the amplitude modulation of the gear meshes signal lead to the defect. Furthermore, in case of tooth surface pitting, both magnitude and phase change from their reference values, as shown in Fig. 4(a). By contrast, in case of tooth cracking only magnitude of the mesh stiffness is changed as shown in Fig. 4(b).
In this approach, the effects of change in magnitude and phase of the mesh stiffness at one particular tooth in the pinion were evaluated in order to simulate the effects of tooth cracking and tooth surface pitting. Obviously, the change in the meshing stiffness will have consequences on the system dynamic behavior. In other words, as a result of such changes, modulation of the gearmesh stiffness is expected which will begin an exciting force. Hence the system frequency response will be changed. The new stiffness gear mesh kd(t) resulting from the defect modeling:
where d(t) which represent the modulating function.
4. Numerical simulations of the electromechanical system
For simulation in Matlab, it is necessary to write the model of the electromechanical system in state space representation. In this order, each second-order differential equation is written in the form of two first order differential equations. Thus, 14 nonlinear first order differential equations with time varying coefficients are obtained. These equations are written such that each equation contains the time derivative of only one variable.
Fig. 5Flowchart of the proposed method
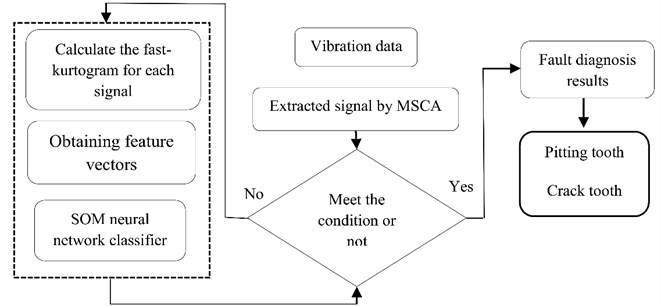
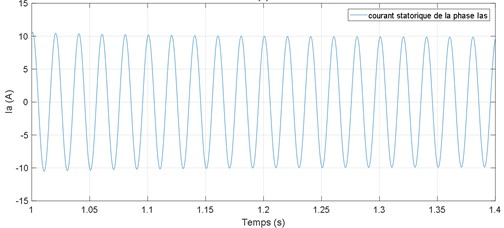
The dynamic response of the electromechanical system is computed to look for the different statoric current signatures obtained from each introduced fault. We obtained the electrical motor stator current in time domain, and the spectrum is obtained by the Fast Fourier transform.
A healthy gear is modeled by 0 % phase change and 0 % amplitude reduction in the gear mesh stiffness. This report will be used as a reference for subsequent simulations where faults are introduced.
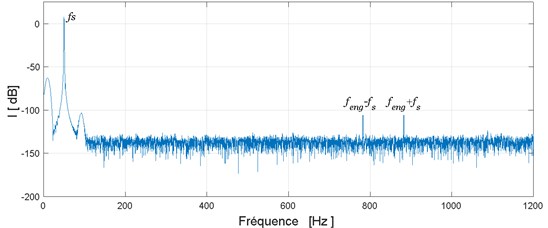
From Fig. 6(b), we show that the spectrum of the stator current only presents a fundamental component at frequency fs= 50 Hz and tow frequency component at frequency feng-fs and feng+fs (where feng is the mesh frequency) which are the result of modulation of the fundamental frequency by mesh frequency.
Table 1Parameters of the electromechanical system
Moments of inertia for electric motor (Im) | 0.023976 kg·m2 |
Moments of inertia for pinion (Ip) | 4.3659e-4 kg·m2 |
Moments of inertia for output gear (Ig) | 8.3602e-3 kg·m2 |
Moments of inertia for driven machine (Ir) | 0.01015 kg·m2 |
Mass of the bearing and part of the shaft (m) | 0.5134 kg |
Mass of the input pinion (mp) | 0.96 kg |
Mass of the gear (mg) | 2.88 kg |
Output torque from load (Tem) | 25 Nm |
Torsional stiffness of the flexible coupling (kc) | 4.4e4 Nm/rad |
Viscous damping coefficient of flexible coupling (cc) | 5e5 Nm·s/rad |
Base circle radius of pinion (Rp) | 0.0301 m |
Base circle radius of output gear (Rg) | 0.0761 m |
Radial stiffness of the bearing (Kb) | 6.56e7 N/m |
Viscous damping coefficient of the bearing (Cb) | 1.8e5 N·s/m |
Shaft transverse stiffness (Ks) | 7.42e7 N/m |
Number of teeth on pinion and gear | 19/48 |
Stator resistance (Rs) | 2.68 Ω |
Stator inductance (Ls) | 0.605 H |
Leakage factor (σ) | 0.049 |
Rotor time constant (Tr) | 0.219 |
Number of poles pair (p) | 1 |
AC supply | 310V, 50 Hz |
Fig. 6Simulated results: a) stator current in the time domain, b) stator current spectrum
a)
b)
4.1. Effect of pitting tooth and crack tooth in stator current signal
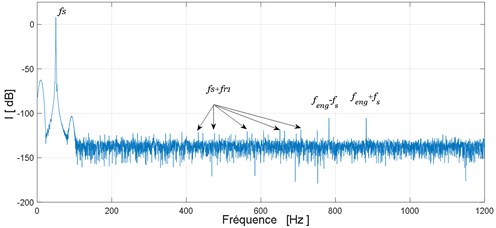
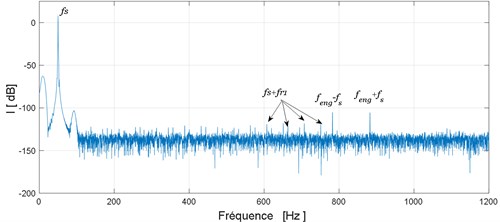
A pitting fault is simulated on the pinion by an amplitude reduction and a phase change of gear mesh stiffness of 2.5 %. The second simulation is done with the pinion tooth having a crack modeled by a 2.5 % amplitude loss. Obtained spectrums for these two cases are shown in Fig. 7.
From these spectrums we can observe that in the case of these two defects (pitting or crack) new frequencies components at frequencies fs+nfr1 are highlighted. These are the results of the modulation of the fundamental component fs by the rotational frequency of the defective tooth fr1.
On the other hand the comparison of these two spectrums: the spectrum obtained in the presence of pitting fault Fig. 7(a) and that obtained in the presence of cracked tooth Fig. 7(b) failed to differentiate these two defects. To overcome this problem we propose in the next section to use the Fast-Kurtogram method.
Fig. 7Electrical motor stator current spectrum: a) pitting tooth fault, b) tooth crack fault
a)
b)
4.2. Fast kurtogram method for differentiation of the pitting fault from the tooth cracks
Although conventional method gives as good indication for the presence of the fault frequencies, existing diagnostic techniques do not differentiate between a crack and a pitting fault. The Kurtogram is a fourth-order spectral analysis tool recently introduced for detecting and characterizing transients in a signal. The paradigm depends on the assertion that each type of transient is correlated with an optimal dyad {f, Bw} in the Kurtogram. In our case, transients created in stator current signal by a pitting fault differ from transients created by a tooth crack fault in nature because the effect in the meshing gear is different, and therefore different associated dyad in the Kurtogram.
The spectral kurtosis method uses kurtosis as a measure of the distance between an arbitrary random process and a Gaussian process in order to detect the existence of transients in a signal. The SK value of the signal is determined by measuring the kurtosis of each frequency component contained in the signal.
SK represents the frequency-dependent transient characteristics of the signal. SK can identify not only the transient components in the signal, but also their locations in the frequency domain, and thus overcome the drawbacks of power spectral density for the detection and characterization of signal transients. The SK of a signal x(t) is defined as the normalized fourth order spectral moment as follows:
where <.> stands for the time averaging operator, and H(t,f) represent the time/frequency envelope of signal x(t). H(t,f) can be estimated by the short-time Fourier transform (STFT):
where W(t) is the analysis window with length Nw. SK is expected to be very sensitive to non-stationary transients in a signal and to indicate exactly at which frequencies those transients occur. This technique was investigated in detail by Antoni and led to the concept of the “Kurtogram”, which is a diagram indicating the optimum center frequency and bandwidth combination of a band pass filter to maximize the kurtosis of the filter output. A more detail explanation of Kurtogram.
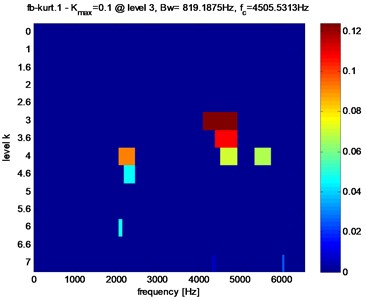
Fig. 8 show the Kurtogram of the induction stator current for the healthy gear. We show a maximum value of the spectral kurtosis (Kmax= 0.1) at dyad (819.1875 Hz / 4505.5313 Hz).
Fig. 8Fast Kurtogram of the electrical motor stator current in the healthy mode
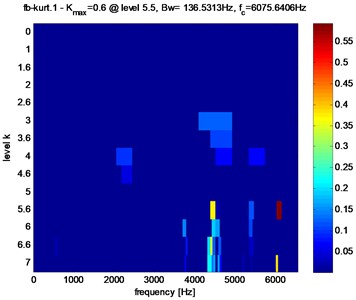
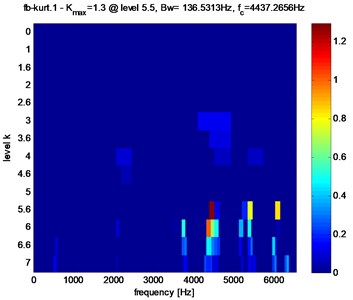
Kurtogram’s of the stator current in the presence of crack and faults pitting are shown in Fig. 9 and table 2, Kurtogram’s have an abnormally high value of the Spectral Kurtosis: (Kmax= 1.3) at dyad (Bw= 136.5313 Hz / fc= 4437.2656 Hz) for tooth crack fault and (Kmax= 0.6) at dyad (Bw= 136.5313Hz / fc= 6075.6406 Hz) for tooth pitting fault. It clearly reveals the occurrence of abnormal shocks in the signal. Note also that in the case of pitting fault the maximum value of spectral kurtosis is located at dyad (Bw= 136.5313 Hz / fc= 6075.6406 Hz), by against in the case of a crack fault the maximum value of spectral kurtosis is located at dyad (Bw= 136.5313 Hz / fc= 4437.2656 Hz).
Fig. 9Fast Kurtogram of the stator current of the gear tooth faults: a) pitting fault, b) crack fault
a)
b)
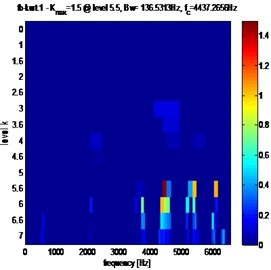
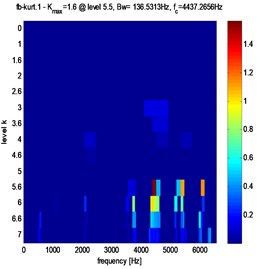
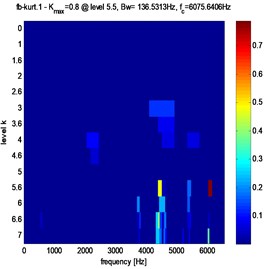
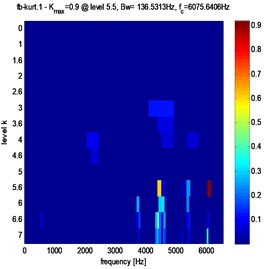
To study the relation between tooth gear degradation and the maximum value of Spectral Kurtosis and its location in the kurtogram. Simulate the amplitude reduction from 0 % to 10 %.
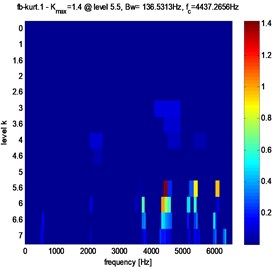
Fig. 10Fast Kurtogram of stator current for different crack fault evolution: a) 3 %, b) 3.5 %, c) 4 %
a)
b)
c)
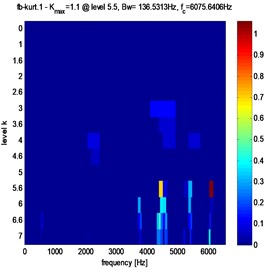
Fig. 11Fast kurtogram of stator current for different pitting fault evolution: a) 3 %, b) 3.5 %, c) 4 %
a)
b)
c)
Clearly, from Figs. 10, 11 and table 2, that in the case of pitting fault, the maximum value of spectral kurtosis is located at dyad (Bw= 136.5313 Hz / fc= 6075.6406 Hz), in the other hand, in the case of a crack fault the maximum value of spectral kurtosis is located at dyad (Bw= 136.5313 Hz / fc= 4437.2656 Hz) and this whatever the level of the defect is. It can also be observed that the maximum value of spectral Kurtosis (Kmax) increases with increasing fault severity.
Table 2Comparison results for pitting tooth and crack tooth evaluation
Fig. 9. Gear tooth faults | Fig. 10. Crack fault evolution | Fig. 11. Pitting fault evolution | |||
a) Pitting fault | b) Crack fault | 3 % | Kmax=1.4 | 3 % | Kmax= 0.8 |
Bw= 136.5313 Hz | Bw= 136.5313 Hz | ||||
fc= 4437.2656 Hz | fc= 6075.6406 Hz | ||||
Kmax= 0.6 | Kmax= 1.3 | 3.5 % | Kmax= 1.5 | 3.5 % | Kmax= 0.9 |
Bw= 136.5313 Hz | Bw= 136.5313 Hz | ||||
Bw= 136.5313 Hz | Bw= 136.5313 Hz | fc= 4437.2656 Hz | fc= 6075.6406 Hz | ||
4 % | Kmax= 1.6 | 4 % | Kmax= 1.1 | ||
fc= 6075.6406 Hz | fc= 4437.2656 Hz | Bw= 136.5313 Hz | Bw= 136.5313 Hz | ||
fc= 4437.2656 Hz | fc= 6075.6406 Hz | ||||
We observed that the amplitude of Kmax increases with the increase of the defect. This observation can be used to determine a threshold that can decide when to stop the process before the severity of failure causes serious or dramatic problems, which are very different from those created by a crack fault in nature because the effects in the mesh gears are different. That’s why we have noticed that these faults are associated with different dyad in the Kurtogram and therefore they are characterized by Kmax and fc. In our study, these parameters are used as a feature vectors to the classifier in order to identify the gear status. Table 3 gives the Kmax and fc values for normal condition, tooth crack and tooth pitting faults.
Fig. 12Evolution of Kmax as function of the defect
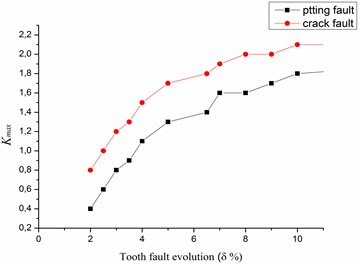
Table 3Fault feature vectors
Kmax | fc | Operating stat |
[0.1-0.4] | 4505.5313 Hz | Healthy gear |
[0.8-2.1] | 6075.6406 Hz | Faulty gear: tooth crack |
[0.6-1.8] | 4437.2656Hz | Faulty gear: tooth pitting |
5. Automatic gearbox diagnosis based on SOM neural network
The use of a spectral kurtosis (SK) is very popular for gearbox condition monitoring. The popularity is due to the advantageous properties of this method and availability of computer software. However, we identified and classified the faults after extracting the feature information using the Kurtogram. Thus, the intelligent classification methods based on artificial intelligence such as genetic algorithms, fuzzy logic, Self-organizing map neural networks (SOM), were widely used.
The SOM neural network was introduced by Teuvo Kohonen. This neural network learning with no instructors which had self-adaptive and self-learning features, has special property of effectively creating spatially organized internal representation of various input data features and providing a topology preserving mapping from high dimensional space into usually two-dimensional space. Neurons with large similarity on the map are so close that neurons with small similarity can be separated. Consequently, SOM network is used in this research. Two layers exist in the SOM Network, input layer and output layer. (As shown in Fig. 13).
Fig. 13SOM neural network structural
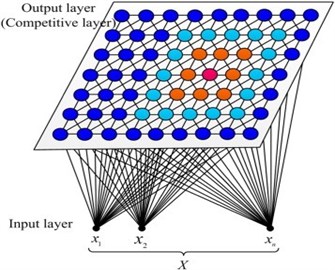
In the SOM network, the input layer has two neurons. 6×6 matrix is the output of the competitive layer. The network training parameters were set as follows: The initial learning rate was 0.3. A Gaussian function was selected as the neighborhood function and the initial neighborhood width was 2. The total number of learning iterations is set to 200. The topology structure of SOM neural network is shown in Fig. 14.
Fig. 14Classification map for parameters extracted using Kurtogram analysis
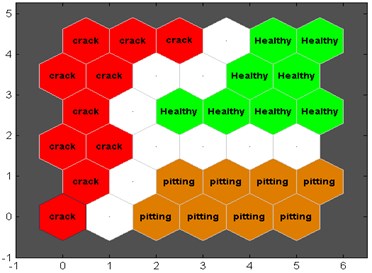
From the Fig. 14; we can see that tooth crack samples are segmented into the crack class, while the pitting fault are segmented into the pitting class.
In order to demonstrate the effectiveness of the accuracy of the classification effect, so we need to take the challenge with other classification techniques such as Back Propagation Neural Network, Elman Neural Network, Principal Componant Analysis, Singular Value Decomposition, Lineaire Discriminant Analysis, Local Preserving Projection and Local Normalization are applied in classification [24, 25]. Comparison results are shown in the Table below, which represent seven cases of classification accuracy.
As shown in the Table 4, the LDA, LPP, LN and ENN have classification accuracies higher than 0.99 over than BP neural network, PCA and SVD. In general, the obtained feature vectors have good separability, but the SOM neural network has an advantage over other techniques in classification accuracy; because the SOM facilitates the visual comprehension of the fault. The graph can be designed in different colors and the existence of a clear boundary between each fault. This gives confirmatory evidence about the effectiveness of the proposed feature extraction method.
Table 4Comparison of classification accuracy
Methods | Test samples | Classification accuracy % |
Kurt-BP | 160 | 0.9892 |
Kurt-ENN | 160 | 0.9907 |
kurt-PCA | 160 | 0.9753 |
Kurt-SVD | 160 | 0.9824 |
kurt-LDA | 160 | 0.9989 |
Kurt-LPP | 160 | 0.9967 |
Kurt-LN | 160 | 0.9921 |
6. Conclusions
In this study, a dynamic model of an electromechanical system was developed to examine the stator current of the electric motor in the presence of gear faults as pitting tooth and tooth cracks. We modeled these two faults by an amplitude reduction and phase change in gear stiffness. Frequency response was calculated in case of healthy gear and displayed the dominance of the fundamental frequency and frequency of gear mesh. The simulations including the two types of tooth defects showed the appearance of new components at different frequencies in the electrical motor stator current spectrum.
The comparison of the obtained spectrums failed to differentiate these two defects. However, the use of the Fast-Kurtogram method and SOM neural network allowed differential diagnosis of gear tooth cracks from tooth pitting such that each defect is the specific dyad, which maximizes the value of spectral kurtosis. Such information is very useful in automatic condition-monitoring system and can differentiate defects during an early stage of failure in the spur gear set.
This result suggests that Fast-Kurtogram analysis and SOM neural network could be a useful tool for automatically diagnosing gear tooth cracks from tooth pitting by stator current measurements from the actual spur gear systems.
References
-
Ratni Azzeddine, Rahmoune Chemesddine, Djamel Benazzouz A new method for Enhancement of fault detection and diagnosis in gearbox systems. Journal of Vibroengineering, Vol. 19, Issue 1, 2017, p. 176-188.
-
Fakher Chaari, Tahar Fakhfakh, Mohamed Haddar Numerical simulation of the dynamical behavior of a gear transmission set with tooth faults. Mécanique and Industries, Vol. 6, 2006, p. 625-633.
-
Babak Eftekharnejad, Mba D. Seeded fault detection on helical gears with acoustic emission. Applied Acoustics, Vol. 70, Issue 4, 2009, p. 547-555.
-
Loutas T. H., Sotiriades G., Kalaitzoglou I., Kostopoulos V. Condition monitoring of a single-stage gearbox with artificially induced gear cracks utilizing on-line vibration and acoustic emission measurements. Applied Acoustics, Vol. 70, Issue 9, 2009, p. 1148-1159.
-
Combastel C., Lesecq S., Petropol S., Gentil S. Model-based and wavelet approaches to induction motor on- line fault detection. Control Engineering Practice, Vol. 10, Issue 5, 2002, p. 493-509.
-
Rahmoune Chemseddine, Benazzouz Djamel Monitoring gear fault by using motor current signature analysis and fast kurtogram method. International Review of Electrical Engineering (I.R.E.E.), Vol. 8, 2013, p. 616-662.
-
Feki N., Clerc G., Ph Velex An integrated electro-mechanical model of motor-gear units. Applications to tooth fault detection by electric measurements. Mechanical Systems and Signal Processing, Vol. 29, 2012, p. 377-390.
-
Zair Mohamed, Rahmoune Chemsedine, Benazzouz Djamel Multi-fault diagnosis of rolling bearing using fuzzy entropy of empirical mode decomposition, principal component analysis, and SOM neural network. Proceedings of the Institution of Mechanical Engineers, Part C: Journal of Mechanical Engineering Science, 2018, https://doi.org/10.1177/0954406218805510.
-
Kryter R. C., Haynes H. D. Condition monitoring of machinery using MCSA. Journal of Sound and Vibration, Vol. 23, 1989, p. 14-21.
-
Zair Mohamed, Rahmoune Chemsedine, et al. Gear multi-fault feature extraction and classification based on fuzzy entropy of local mean decomposition, singular value decomposition and MLP neural network. International Conference on Advanced Mechanics and Renewable Energies, 2018.
-
Choy F. K., Polyshchuk V., Zakrajsek J. J., Handschuh R. F., Townsend D. P. Analysis of the effects of surface pitting and wear on the vibrations of a gear transmission system. Tribology International, Vol. 29, 1996, p. 77-83.
-
Chaari F., Fakhfakh T., Haddar M. Simulation numérique du comportement dynamique d’une transmission par engrenages en présence de défauts de denture. Mécanique and Industries, Vol. 6, 2006, p. 625-633.
-
Hidaka T., Terauchi Y., Dohi K. On the relation between the run-out errors and the motion of the centre of sun gear in a stoeckicht planetary gear. Bulletin of the JSME, Vol. 22, 1979, p. 748-754.
-
Kasuba R., August R. Gear Mesh Stiffness and Load Sharing in Planetary Gearing. ASME Paper 84-DET-229, 1984.
-
Antoni J., Randall R. B. The spectral kurtosis: application to the vibratory surveillance and diagnostics of rotating machines. Mechanical Systems and Signal Processing, Vol. 20, 2006, p. 308-331.
-
Dwyer D. F. Detection of non-Gaussian signals by frequency domain kurtosis estimation. Proceedings of the International Conference on Acoustic, Speech, and Signal Processing, Boston, 1984, p. 607-610.
-
Xihui Chen, Gang Cheng Diagnosing planetary gear faults using the fuzzy entropy of LMD and ANFIS. Journal of Mechanical Science and Technology, Vol. 30, Issue 6, 2016, p. 2453-2462.
-
Shao R., Hu W., Wang Y., Qi X. Fault feature extraction and classification of gear using principal component analysis and kernel principal component analysis based on the wavelet packet transform. Measurement, Vol. 54, 2016, p. 118-132.
-
Cheng G., Chen X., Shan X., Liu H., Zhou C. A new method of gear fault diagnosis in strong noise based on multi-sensor information fusion. Journal of Vibration and Control, Vol. 22, Issue 6, 2016, p. 1504-1515.
-
Kangas J., Kohonen T. Developments and applications of the self-organizing map and related algorithm. Mathematics and Computers in Simulation, Vol. 41, 1996, p. 3-12.
-
Howard I., Jia S., Wang J. The dynamic modelling of a spur gear in mesh including friction and a crack. Mechanical Systems and Signal Processing, Vol. 15, Issue 5, 2001, p. 831-853.
-
Choy F. K., Polyshchuk V., Zakrajsek J. J., et al. Analysis of the effects of surface pitting and wear on the vibration of a gear transmission system. Tribology International, Vol. 29, 1996, p. 77-83.
-
Del Rincon A. F., Viadero F., Iglesias M., et al. Effect of cracks and pitting defects on gear meshing. Proceedings of the Institution of Mechanical Engineers, Part C: Journal of Mechanical Engineering Science, Vol. 226, Issue 11, 2012, p. 2805-2815.
-
Zhao M., Chow T. W. S., Wu Z., et al. Learning from normalized local and global discriminative information for semi-supervised regression and dimensionality reduction. Information Sciences, Vol. 324, 2015, p. 286-309.
-
Jin X., Zhao M., Chow T. W. S., et al. Motor bearing fault diagnosis using trace ratio linear discriminant analysis. IEEE Transactions on Industrial Electronics, Vol. 61, Issue 5, 2014, p. 2441-2451.

