Abstract
Currently, automotive manufacturers highly prioritize the perceived quality of vehicles, with dimensional engineering being a key influencing factor. Automotive interior and exterior trim components undergo slight deformation due to temperature changes, affecting fit dimensions and imposing stricter consistency requirements. This paper examines the deformation mechanisms of typical parts under varying temperatures using dimensional engineering techniques to study the impact on component gaps. Testing quantifies changes in gap width and surface flatness during temperature variations, providing a theoretical basis for design. The research offers practical guidance for identifying potential issues early in product development and ensuring effective collaboration in production, helping companies achieve higher standards and superior quality.
1. Introduction
To achieve optimal vehicle quality, precise product design and manufacturing control are vital. Dimensional chain analysis early in design saves costs by assessing feasibility, predicting assembly issues, identifying precision bottlenecks, and allocating tolerances. Widely used in auto design, this method efficiently tracks and addresses tolerance issues during assembly, optimizing processes [1, 2].
This paper emphasizes the importance of dimensional analysis for setting design requirements and explores temperature's impact on component sizes during vehicle quality certification.
2. Materials and methods
2.1. Dimensional engineering technology
Dimensional Technical Specification (DTS) defines design standards for fit gaps, surface differences, and tolerances between car exterior parts. It’s crucial for assessing vehicle quality, showcasing manufacturing prowess, and shaping user perceptions. With automotive advancements, DTS is gaining importance, encompassing gap control, surface alignment, and dimensional tolerances, influenced by component geometry, parallelism, and symmetry [3-6].
2.2. Gap definition
When the vehicle is fully assembled, the gap formed between two parts with an assembly relationship that can be seen visually is called a gap. The measurement method is as follows: when two adjacent parts have hemming characteristics, regardless of the hemming radius and the relationship between the two surfaces, the gap between the two parts is determined by the shortest distance in space. In gap measurement, attention should be paid to identifying gap characteristics and types to prevent errors in measurement that may lead to inaccurate measurements. The gap is shown in Fig. 1.
Fig. 1Schematic diagram of gap effects with different characteristics
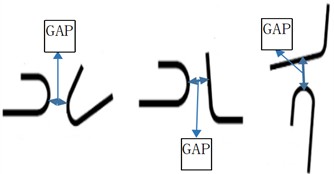
Fig. 2Definition of fillets around headlights
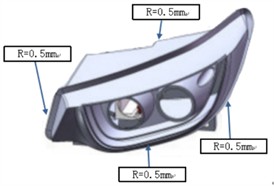
The design gap is the nominal value of the gap defined by the design; while the visual gap is not only the nominal value of the gap defined by the design, but also related to the fillets of the components on both sides of the gap. If the size of the fillet radius R is not designed reasonably, the visual gap will be enlarged. Special attention should be paid to the size engineering design to effectively improve the perceived quality of the product without increasing the cost. As to the headlight, Fig. 2 shows the commonly designed fillet radius.
2.3. Definition of flush
When the vehicle is fully assembled, the height difference between the surfaces of two parts with an assembly relationship that can be seen visually is called the flush, which is shown in Fig. 3.The measurement method is as follows: when the main surface of the datum component (indicated by ▲) is with the main surface of the target component, the flush between the datum component and the target component is zero; when the main plane of the datum component is lower than the main surface of the target component, and when the main planes of two components are parallel or nearly parallel, the shortest distance in space between the extension line of the main plane of the reference component and the tangent point of the main plane radius of the target component is defined as the flush.
Dimensional engineering technology also includes requirements such as tolerance design, parallelism, and symmetry. The value of these values also has an important impact on the perceived quality of the entire vehicle and components, and is an important aspect in the design of the dimensional chain [7-9].
Fig. 3Schematic diagram of flush definition with parallel relationship

3. Vehicle DTS design
DTS design is crucial in dimensional engineering for vehicles, defining the gaps and alignments of interior and outer parts, which is key to the car’s appearance quality. It's typically defined by the nominal gap values and their tolerances. Each car maker sets its own clearance and flush standards based on their design and production capabilities.
Achieving vehicle DTS relies heavily on the supplier network, especially for large exterior parts like lights and trim systems that significantly affect the DTS. Here's an overview of the quality control and precision manufacturing levels for lighting and trim systems.
3.1. Front and rear lighting
Car makers regulate headlight and taillight precision with these tolerances: primary and secondary reference hole apertures are ±0.1 mm off-center; mounting hole apertures are ±0.2 mm off, with a position offset of 1.0 mm; critical fit surface profiles allow 1.4 mm deviation; non-critical fits allow 2.4 mm; and non-matching surfaces can vary by 3.0 mm.
3.2. Interior and exterior decoration
Car companies manage part precision with these standards: primary and secondary reference holes allow ±0.1 mm deviation, with zero positioning error; mounting holes allow ±0.2 mm deviation, with a 1.0 mm position shift; key fit surfaces have a 1.0 mm profile limit; non-key fits have a 2.0 mm limit; and non-matching surfaces have a 3.0 mm limit.
Overall, using their manufacturing capabilities, R&D, and room for improvement, these companies can design a DTS that fits their specific needs and enhances vehicle body and assembly quality.
3.3. Precision design in dimensional engineering
In dimensional quality control, two methods are often used: the extreme value method and the probability method. This article focuses on the probability method, using headlight gap tolerance as an example. Also known as the root mean square method, the probability method calculates tolerances by taking the square root of the sum of the squares of the tolerances of each component in a closed loop to find the target size tolerance. The formula for this calculation is:
In mass production, the probability of parts having opposite extreme sizes is very low. According to the principle of probability statistics and the actual situation of machining error distribution, the size of parts shows a normal distribution trend, so the probability method is more reasonable to solve the size chain more accurately.
4. Experimental validation
4.1. Experiment setup
The vehicle was placed in a high and low temperature environment cabin, and the temperature of the environment cabin was adjusted to make the vehicle soak for more than 4 hours at different temperatures. After the temperature soak, the sample gap was measured to ensure that the overall temperature of the sample was uniform when the gap was measured.
Table 1The calculation results for the front and rear lights of the car
Point | 1 | 2 | 3 | 4 | 5 |
Front headlight | 0.08 | 0.04 | 0.02 | 0.08 | 0.06 |
Rear tail light | 0.06 | 0.06 | 0.08 | 0.04 | 0.08 |
The data for this verification test mainly comes from measurements taken by the test personnel, with the source of uncertainty being human measurement error, while also considering the measurement accuracy of the equipment. To ensure the credibility of the measurement results, each data point in this verification test was independently measured by three different test personnel, and each set of values for the measured position was statistically analyzed to calculate its measurement uncertainty. The calculation formula of uncertainty is as follows, represents the measurement value of each individual, and represents the mean value of the measurements taken by the three individuals:
Considering the smallest division of the measuring tool is 0.01 mm. With a 95 % confidence level, the coverage factor is 2, the calculation results for the front and rear lights of the car are as shown in Table 1.
From the above uncertainty results, it can be inferred that the credibility of the measurement results from this experiment is relatively high. The following data for analysis is obtained by calculating the mean of the measurements from three testers.
4.2. Result and analysis
4.3. Front headlights
Measurements of the gaps and surface differences between the front headlights and the surrounding fenders were taken at temperatures of 23 °C, 50 °C, 60 °C, 70 °C, and 80 °C, as shown in Fig. 4. For this model, the main reference hole of the front headlight has a maximum deviation of ±0.1 mm in diameter and a position tolerance of 0 mm. The secondary reference hole has a maximum deviation of ±0.1 mm in diameter and a position tolerance of 0 mm. The installation hole has a maximum deviation of ±0.2 mm in diameter and a position tolerance of 0.5 mm. The tolerance between the positioning holes of the front headlight and the fender is ±0.5 mm, and the maximum deviation of the fender positioning hole is ±0.5 mm.
According to the calculation formula of probability method, the gap tolerance here is:
This article selects the standard of a certain enterprise as the standard value for this research and verification. Standard values are shown in Table 2.
Table 2Example of standard value of vehicle clearance
Project | Datum part | Counterpart | C-class car standard |
1 | Fender | headlamp | 1±0.75 |
2 | Front bumper | headlamp | 2.5±1.2 |
3 | headlamp | front grille | 3.5±0.75 |
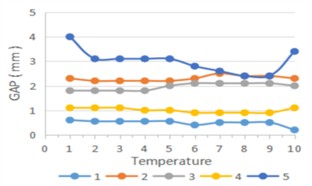
Fig. 5 shows the measurement results of the gap between the headlight and the fender at different temperatures. The corresponding relationship between the abscissa numbers in the figure and the ambient temperature is introduced in Table 3.
Table 3Correspondence between abscissa numbers and ambient temperature
Serial number | 1 | 2 | 3 | 4 | 5 | 6 | 7 | 8 | 9 | 10 |
Temperature / ℃ | 23 | 50 | 60 | 70 | 80 | 50 | 60 | 70 | 80 | 23 |
From the chart, two points can be observed: 1) In the alternating temperature environment, the gap changes between the front headlights and the mating parts are mostly within the design values, with small amplitudes of change. Only the position 2 where the headlight meets the bumper does not meet the design requirements. 2) In the alternating temperature environment, there is a certain degree of variation in the gaps between the front headlights and the mating parts, especially as the temperature increases. The gaps near the mounting points with the front bumper and fender decrease to varying degrees, while the gaps farther from the mounting points increase.
Fig. 4Schematic diagram of gap and flush measurement points
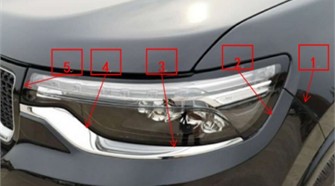
Fig. 5Gap changes under alternating temperature environment
4.3.1. Rear tail lights
Measurements of the gaps and surface differences between the rear tail lights and the surrounding fenders were taken at temperatures of 23 °C, 50 °C, 60 °C, 70 °C, and 80 °C, as shown in Fig. 6. For this model, the main reference hole of the rear tail light has a maximum deviation of ±0.1 mm in diameter and a position tolerance of 0 mm. The secondary reference hole has a maximum deviation of ±0.1 mm in diameter and a position tolerance of 0 mm. The installation hole has a maximum deviation of ±0.2 mm in diameter and a position tolerance of 0.5 mm. The tolerance between the positioning holes of the rear tail light and the fender is ±0.5 mm, and the maximum deviation of the fender positioning hole is ±0.5 mm.
According to the calculation formula of probability method, the gap tolerance here is:
This article selects the standard of a certain enterprise as the standard value for this research and verification. Standard values are shown in Table 4.
As shown in Fig. 7, the results of the gap and surface difference measurements between the rear tail light and the fender at different temperatures are presented. The correspondence between the numbers on the -axis and the environmental temperatures is described in Table 4.
Table 4Example of standard value of rear tail lights
Project | Datum part | Counterpart | C-class car standard |
1 | Rear reinforcement plate | Rear tail lights | 3±0.75 |
2 | Rear reinforcement plate | Rear tailgate | 3.5±2.2 |
Fig. 6Schematic diagram of gap and flush measurement points
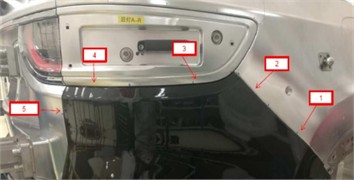
Fig. 7Changes in gap between rear taillights under alternating temperature environment
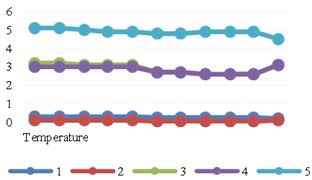
From the chart, it can be observed that in the alternating temperature environment, the vertical gaps between the rear reinforcement panel and the rear tailgate are relatively large, but they remain largely within the design values with minimal amplitude changes as the temperature varies. However, the gaps at the rear tail light area tend to decrease with prolonged exposure to high temperatures and gradually return to their initial values as the temperature decreases. This is due to the rear tail light being made of plastic, which expands and contracts with temperature changes. In summary, temperature variations can have a certain impact on the installation dimensional chain of the entire vehicle, significantly affecting the consistency inspection during the vehicle quality certification process.
5. Conclusions
1) The temperature alternating environment will indeed have a certain impact on the installation size of the vehicle. Therefore, the impact of temperature alternating should be considered when selecting parts materials and dimensional engineering design.
2) For quality monitoring during the vehicle quality certification process, factors such as temperature that affect the gap consistency of the vehicle need to be considered, so as to make the vehicle perceived quality inspection process more scientific and avoid errors caused by environmental factors.
3) Changes in the gap will lead to a decrease in perceived quality and will also seriously affect the service life. Therefore, product gap changes should be quantified and constrained in product design to ensure product consistency. At the same time, product gap changes should be constrained at the same time, which can effectively extend product service life, improve product value retention, and thereby enhance product market competitiveness.
4) Based on the consideration of “raising the line” for voluntary product certification, corresponding inspection items can be added to the type test plan or factory inspection product consistency inspection link, and key inspections of typical assembly positions can be carried out to help improve product quality.
5) As we can see, it is a pretty new and novel aspect of study in product improving. Actually, the study refer to the comfort and aesthetics of the car, which is the most important consideration of the car consumer.
References
-
K. Long, Q. Xie, D. Lu, Q. Wu, Y. Liu, and J. Wang, “Aircraft skin gap and flush measurement based on seam region extraction from 3D point cloud,” Measurement, Vol. 176, p. 109169, May 2021, https://doi.org/10.1016/j.measurement.2021.109169
-
L. H. Pham, D. N.-N. Tran, J. Y. Byun, C. H. Rhie, and J. W. Jeon, “A smartphone-based laser measuring system for gap and flush assessment in car body,” IEEE Transactions on Industrial Electronics, Vol. 68, No. 7, pp. 6297–6307, Jul. 2021, https://doi.org/10.1109/tie.2020.2992971
-
Y. Xue, “Research on optimization of vehicle interior and exterior decoration matching scheme of FAW Jilin Automobile Company,” (in Chinese), Jilin University, 2016.
-
X. N. Liang, Z. B. Huang, Q. G. Pan, H. L. Zeng, and B. W. Tang, “Research on visual gap evaluation method of automobile static perception quality,” (in Chinese), Sci-Tech and Development of Enterprise, No. 12, pp. 42–44, 2020.
-
Q. Z. Huang, “Research on new car quality evaluation system and methods,” (in Chinese), Hunan University, 2014.
-
D. C. Wang and B. H. Li, “Overview of automobile dimensional engineering system,” Automobile Parts, No. 6, pp. 84–87, 2023.
-
E. Minnetti et al., “A smartphone integrated hand-held gap and flush measurement system for in line quality control of car body assembly,” Sensors, Vol. 20, No. 11, p. 3300, Jun. 2020, https://doi.org/10.3390/s20113300
-
T.-T. Tran and C. Ha, “Non-contact gap and flush measurement using monocular structured multi-line light vision for vehicle assembly,” International Journal of Control, Automation and Systems, Vol. 16, No. 5, pp. 2432–2445, Sep. 2018, https://doi.org/10.1007/s12555-017-0535-y
-
K. Du, “Research on dimensional engineering technology based on vehicle development,” (in Chinese), Automobil Industrie, No. 8, pp. 13–15, 2021.
-
C. Granger, “New system for automotive end-of-line gap and flush measurement,” Machinery Market, 2022.
-
G. D. ’Emilia, A. Gaspari, C. Iavicoli, and E. Natale, “Measurement uncertainty estimation of gap and profile in the automotive sector,” in Journal of Physics: Conference Series, Vol. 1589, No. 1, p. 012017, Jul. 2020, https://doi.org/10.1088/1742-6596/1589/1/012017
-
S. B. Hu, Y. Y. Ma, and H. J. Wei, “Product quality control based on dimensional engineering,” Auto Time, No. 10, pp. 122–124, 2021.
About this article
The authors have not disclosed any funding.
The datasets generated during and/or analyzed during the current study are available from the corresponding author on reasonable request.
The authors declare that they have no conflict of interest.
