Abstract
With the advancement of urbanization, two-lay trusses bridges are widely used because of their good traffic capacity and structural performance. However, the aerodynamic behavior of this beam type is still in the exploratory stage. The local microclimate characteristics at the bridge site in mountainous cities are obvious, and it is easy to form a large wind angle of attack, which has a significant impact on the vortex-induced vibration (VIV) performance of the bridge. Therefore, this study takes a long-span two-lay steel trusses bridge in a mountainous city as the engineering background, and uses wind tunnel test and numerical calculation methods to study the changes of the static three-component force coefficient and VIV response of the main beam in the construction and completion state under the action of high wind angle of attack. The results show that the three-component force coefficient curves under different wind speeds are close to each other, and the Reynolds number effect is not obvious. The vibration test shows that the vertical bending VIV first occurs at +3° and +5°, and then two torsional VIV with different amplitudes occur. Both vertical bending and torsional VIV are simple harmonic vibrations with a single frequency, and the vertical bending VIV frequency is locked at 2.227 Hz, and the torsional VIV frequency is locked at 4.289 Hz, which are close to the natural frequency of the test model. Compared with +3°, the maximum amplitude of vertical bending VIV under +5° increases by 30.0 %, while the maximum amplitude of torsional VIV under high and low wind speed increases by 16.6 % and 12.7 % respectively, and the locking range is longer. It can be seen that the wind angle of attack has a significant effect on the VIV response of the main beam in the completion state. Especially, the trusses beam at a large angle is more sensitive to VIV, and it is more prone to large-scale and large-amplitude VIV. The research results can provide a theoretical basis for the aerodynamic shape optimization and provide a reference for the design of related bridges.
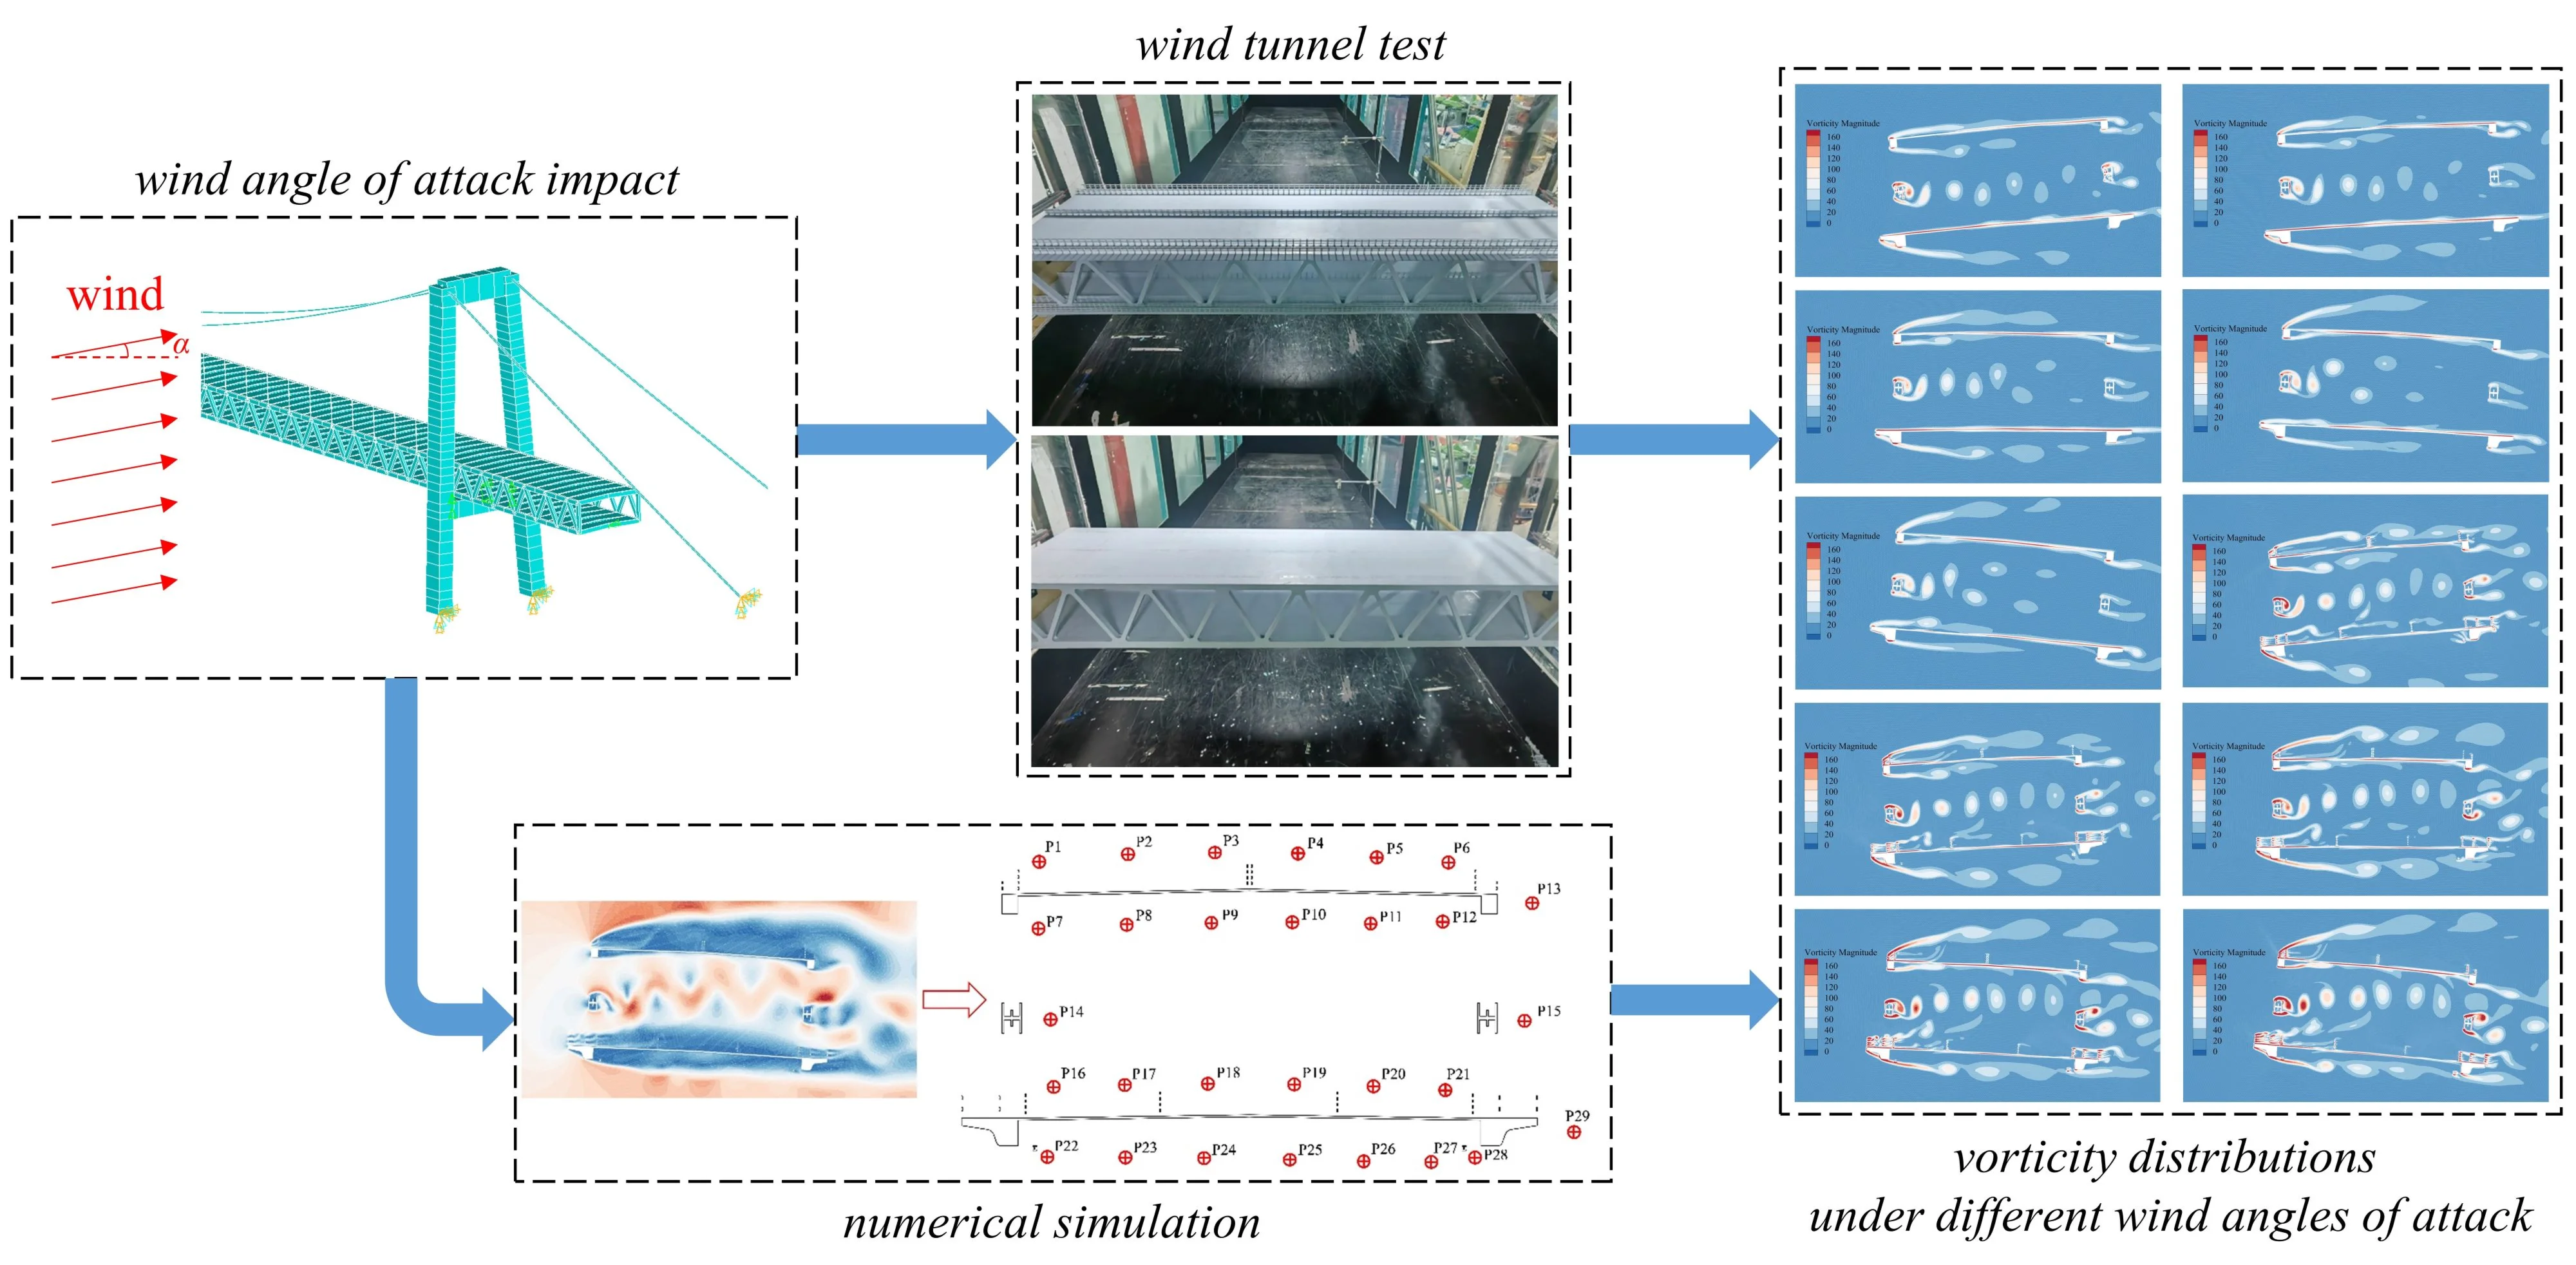
Highlights
- A detailed finite element model of a two-lay steel trusses bridge is used to simulate the structural dynamic characteristics of the bridge in both construction and completion states.
- Static three-force coefficients and VIV responses of main beam in construction and completion states under different wind angles of attack are obtained by wind tunnel tests.
- Vorticity variation of main beam in construction and completion states under different wind angles of attack are obtained by reliable numerical simulation.
1. Introduction
When the fluid flows through a solid object (such as a cylinder, a bridge truss), it can lead to various dynamic instabilities, such as self-excited oscillations of structure due to flutter instability [1], and the formation of alternating shedding vortices behind the structure [2], etc. These shedding vortices will exert irregular periodic forces on the object. When the frequency of these periodic forces is close to a certain natural frequency of the object, resonance will be triggered, resulting in a significant increase in vibration amplitude. This coupling phenomenon between fluid and structure is called vortex-induced vibration (VIV). VIV has the dual characteristics of forced vibration and self-excited vibration. Although it is generally limited vibration and will not cause destructive damage to the structure, it has low wind speed, long duration and high probability of occurrence. It may cause fatigue damage to the structure and reduce the stability of the bridge. Excessive amplitude will also affect the safety and comfort of pedestrians and driving on the bridge deck [3]. Therefore, VIV performance is a key factor to be considered in engineering structures, especially in bridge design.
As a complex fluid-solid coupling phenomenon, VIV is affected by many factors. For bridges, the main influencing factors include aerodynamic shape, Reynolds number, etc.
Different aerodynamic shapes will significantly change the position of the fluid separation point on the bridge surface, the shape of the wake vortex street and the frequency of vortex shedding, thus affecting the vibration amplitude and frequency of the bridge. The streamlined section usually has a small aerodynamic drag, which can effectively delay the fluid separation, weaken the strength of vortex shedding, and reduce the VIV risk. The bluff body section is easy to cause the vortex to separate earlier, resulting in strong vortex shedding and obvious vibration response. The symmetrical aerodynamic shape can effectively weaken the regularity and strength of the vortex street by destroying the symmetry of the fluid wake, thereby reducing the VIV amplitude. The symmetrical aerodynamic shape is easy to induce strong vortex shedding and significant VIV response due to the formation of wake vortex street. In particular, changing the wind angle of attack of the incoming flow is equivalent to changing the aerodynamic shape of the bridge in the direction of the incoming flow. Therefore, the characteristics of the flow field around the same section at different wind angles of attack are obviously different. This difference leads to a significant change in the aerodynamic force and surface pressure of the structure at different wind angles of attack, resulting in different VIV responses.
By observing the flow of fluid in a circular tube, Reynolds reveals that the shape of fluid flow is not only related to the flow velocity, but also related to the density, viscosity and diameter of the fluid. Reynolds number () is proposed to distinguish the flow characteristics of viscous fluid. The size of has a significant effect on the flow pattern and vortex shedding mode of the fluid. It is defined as the ratio of the inertial force to the viscous force of the fluid, which is a dimensionless value. The parameter size is computed through Eq. (1):
where, is the fluid density, is the dynamic viscosity of the fluid, and is the kinematic viscosity coefficient. If the of the fluid is small, it indicates that the viscous force has a great influence on the whole flow field. If the of the fluid is large, the viscous force only has a great influence on the fluid boundary layer and the wake behind the object.
The change of Reynolds number directly determines the state of fluid flow (such as laminar flow, turbulent flow) and the regularity of vortex shedding. In the low Reynolds number region, the flow is usually in a laminar flow state, and the vortex shedding is more regular, forming a clear Karman vortex street, resulting in stable VIV; with the increase of Reynolds number, the flow enters the turbulent transition region, the symmetry and regularity of vortex shedding are gradually destroyed, and the VIV amplitude may change significantly. In the high Reynolds number region, the fluid is completely turbulent, the stability of the vortex street is further weakened, and the VIV amplitude is usually reduced.
The static three-component force is the aerodynamic force of the object in the steady-state airflow. It comes from the normal pressure difference caused by the fluid action on the bridge surface and the tangential shear force caused by the fluid viscosity on the bridge surface, which is specifically expressed as resistance, lift and moment [4]. Usually, the static three-component force of a section with a similar shape is proportional to its characteristic size. In order to describe the common characteristics of the static wind load of this kind of section with similar shape more conveniently, the static three-component force can be dimensionlessly processed to obtain the static three-component force coefficient. The relevant parameter size is computed through Eq. (2-4):
where, is the wind angle of attack, 0.5 is the dynamic pressure of the far flow, and are the characteristic width and height, is the segment length, , and are the resistance, lift and moment of the structure when the wind angle of attack is . The static three-component force coefficient of the bridge is usually affected by the aerodynamic shape of the bridge, the wind angle of attack and the Reynolds number.
The governing equations of fluid mechanics are the basic physical equations describing the motion of fluid. Based on the principles of mass, momentum and energy conservation, the governing equations describe the motion behavior of fluid in mathematical form.
The mass conservation equation, also known as the continuity equation, describes the conservation of the fluid mass in space and time. It expresses the equilibrium relationship between fluid mass inflow and outflow, that is, the change rate of mass is equal to the difference between the mass flux of inflow and outflow. For compressible fluids, the continuity equation involves the change of fluid density with time and position. In the Eulerian description, the mass conservation equation can be written as:
where, , and are the velocity components in the three directions of , and , respectively, and is time.
Based on Newton's second law, the momentum conservation equation describes the mechanical behavior of viscous incompressible fluid motion, also known as Navier-Stokes equation (N-S equation). It expresses the relationship between the acceleration of the fluid at any time and the force applied to the fluid. The momentum conservation equation can be written as:
where, is the external force per unit volume of fluid, is the pressure. The left side of the equation represents the mass acceleration of the fluid, the first term on the right side represents the mass force, the second term represents the pressure difference force, and the third term represents the viscous force. The momentum conservation equation shows the general flow law of viscous incompressible fluid, which plays an important role in the research, calculation and simulation of fluid mechanics.
Based on the first law of thermodynamics, the energy conservation equation describes the conservation of fluid energy in space and time. It takes into account the conversion relationship between the energy of the fluid and its internal energy, kinetic energy and potential energy. Its general form is computed through Eq. (7):
where, is the total energy per unit mass, is the heat flux, and is the acceleration of gravity. The first term on the right side represents the contribution of pressure difference force to energy, the second term represents the contribution of viscous force to energy, the third term represents the contribution of heat flux to energy, and the fourth term represents the contribution of mass force to energy. This equation can be understood as the rate of energy change is equal to the difference between the energy flux of inflow and outflow, and the contribution of various forces to energy.
The state equation establishes the relationship between various properties of the fluid (such as pressure, temperature, density, etc.), and different fluids have different state equations. The ideal gas equation of state, also known as the ideal gas law, is used to connect the relationship between the ideal gas pressure and the density. The relevant parameter size is computed through Eq. (8):
where, is the volume of the gas, is the substance amount of the gas, is the gas constant, is the absolute temperature of the gas.
The aerodynamic stability of bridge sections without aerodynamic shape optimization is often poor, and wind-induced vibration is more likely to occur [5]. Different from -beam and box-beam, the two-lay trusses beam is composed of many discrete components with complex cross-section forms. Different components show different turbulent aerodynamic characteristics, resulting in vortices of different sizes and stripping frequencies, which complicate the aerodynamic performance of the two-lay trusses beam. In addition, the distance between some components of the two-lay trusses beam varies continuously along the scale direction, resulting in complex aerodynamic interference. Therefore, the vortex-induced vibration performance on the two-lay trusses beam needs to be further explored.
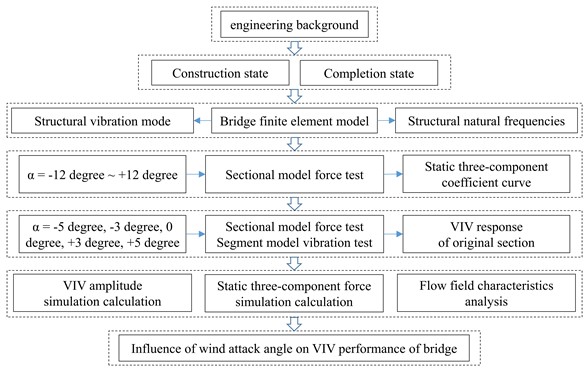
As shown in Fig. 1, In this study, the large-scale two-lay steel trusses bridge in mountainous cities is taken as the project target. These basic dynamic properties of objective bridge are determined by finite element analysis. According to this, the wind tunnel test is designed. The completion-state as well as construction-state main beam VIV performance can be tested and explored, and trusses beam VIV response below dissimilar angles is obtained. The mechanism of VIV is explored by Computational Fluid Dynamics (CFD) numerical simulation. As a new type of main beam, the two-lay steel trusses beam has excellent structural performance, which can bring a historic breakthrough to the bridge span. However, the VIV problem of this beam type is prominent, and the aerodynamic behavior is still in the exploratory stage. The VIV mechanism and vibration control scheme are not yet clear, and its application in long-span bridges has been hindered. The research results can provide a theoretical basis for the aerodynamic shape optimization of the main beam section and provide a reference for the design of related bridges.
Fig. 1Flow chart of the present study
2. Target bridge finite element model
In the cause of ensuring that the segment model in test is capable of precisely simulating the oscillation of the actual bridge under air force, it will be advisable to achieve the precise properties like inherent periodicity, tantamount quality [6]. It will be advisable to set up a tridimensional target mock-up which is able to roundly show structural function. The structural arrangement of the target bridge is shown in Fig. 2. Except for the web member, the cross section of the main beam hardly changes along the bridge axis, and the aerodynamic shape is relatively uniform. To finish this study, ANSYS analysis software is used to establish the finite element model of the whole bridge through the APDL command stream, and the modal analysis is carried out to settle target properties. The overall as well as local finite element models can be illustrated in Fig. 3. The material parameters used in the model are shown in Table 1.
Fig. 2Structural arrangement of the target bridge

a) Schematic layout (unit: mm)
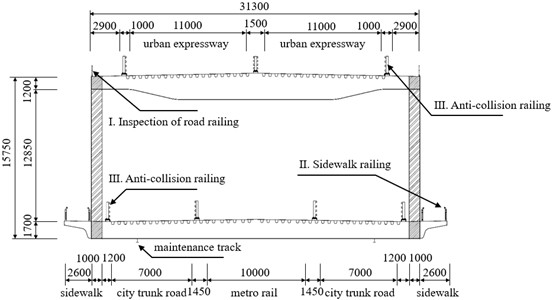
b) Standard cross-section (unit: mm)
Fig. 3Overall and local target model
a) Overall finite element model
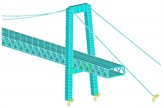
b) Local finite element model
These calculation results about the structural dynamic properties about those major modalities in the completion state can be illustrated in Table 2. It can be seen that the natural frequency of the target bridge is small, indicating that its stiffness is small and the structure is relatively soft, so it is necessary to pay more attention to the study of wind resistance. In the completion state, the first-order symmetrical vertical bending as well as torsion appear in the third mode and the eleventh mode respectively. The natural frequencies are 0.211 Hz and 0.478 Hz respectively, and the torsion-bending frequency ratio is 2.27; The first-order anti-symmetric vertical bending as well as torsion appear in the fourth mode and the twenty-fifth mode, respectively. The natural frequencies are 0.237 Hz and 0.706 Hz, respectively, and the anti-symmetric torsion-bending frequency ratio is 2.98. These parameters will be used as an important basis for the design of the completion state.
Table 1Finite element model material parameters
Member | Elastic modulus (MPa) | Poisson ratio | Density (kg/m3) | Material varieties | Unit type |
Trusses beam | 2.06×10⁵ | 0.3 | 10838 | Q345 | BEAM4 |
Main tower | 3.55×10⁴ | 0.2 | 2550 | C55 reinforced concrete | BEAM4 |
Cross beam | 3.55×10⁴ | 0.2 | 2550 | C55 reinforced concrete | BEAM4 |
Bridge deck slab | 2.00×10⁵ | 0.3 | 7850 | Q345 | SHELL63 |
Main span main cable | 2.00×10⁵ | 0.3 | 9560 | Parallel wire cable | LINK8 |
Side span main cable | 2.00×10⁵ | 0.3 | 8400 | Parallel wire cable | LINK8 |
Boom | 2.00×10⁵ | 0.3 | 7850 | strand | LINK8 |
Bridge deck pavement | – | – | – | – | MASS21 |
Table 2Properties of the bridge in completion state
Modal number | Mass m (kg/m) | Frequency (Hz) | Mass moment of inertia (kg·m2/m) | Mode of vibration |
3 | 6.845×10⁴ | 0.211 | – | First-order positive symmetric vertical bending |
4 | 7.008×10⁴ | 0.237 | – | First order antisymmetric vertical bending |
11 | – | 0.478 | 1.309×10⁷ | First-order positive symmetric torsion |
25 | – | 0.706 | 1.228×10⁷ | First-order antisymmetric torsion |
In addition, a target model under construction state is established when hoisting completion rate is 100 %. The structural properties of the major modalities can be illustrated in Table 3. These parameters will provide reference for the design of the construction state.
Table 3Properties of the bridge in construction state
Modal number | Mass m (kg/m) | Frequency (Hz) | Mass moment of inertia (kg·m2/m) | Mode of vibration |
3 | 4.213×10⁴ | 0.249 | – | First-order positive symmetric vertical bending |
4 | 4.618×10⁴ | 0.272 | – | First-order antisymmetric vertical bending |
11 | – | 0.402 | 1.024×10⁷ | First-order positive symmetric torsion |
25 | – | 0.635 | 0.965×10⁷ | First-order antisymmetric torsion |
3. Wind tunnel test of target bridge under attack flow
3.1. Results of static three-component force test on original section
In order to obtain the variation of the static three-component force coefficient with the wind angle of attack, the static three-component force test was carried out on the segment model of the completion state and the construction state. The specific test conditions are shown in Fig. 4. The rigid suspension system is used in the test [7]. The section model of the two-lay trusses beam with a scale ratio of 1:55 and a length of 2.2 m was selected. The main body of the model is made of wood to ensure that the model has sufficient stiffness. Sidewalk guardrail, bridge deck anti-collision guardrail, bridge deck maintenance road guardrail, maintenance vehicle track and other ancillary components are made of ABS plastic. In order to ensure that the test conditions are similar to the actual situation and reduce the influence of wind tunnel wall friction on the airflow, the test is carried out at the middle height of the wind tunnel, and the test wind speed ratio is 1:4.48. The wind angle of attack ranges from –12° to +12°, the step length is 1°, and the test wind speed is 10 m/s, 15 m/s, 20 m/s. The specific test content is shown in Table 4. The variation curves of the three-component coefficient with the wind angle of attack are shown in Fig. 5.
Fig. 4Sectional model force test
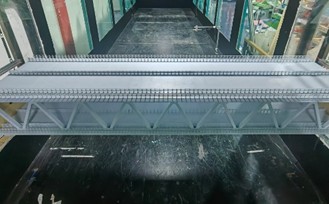
a) Completion state
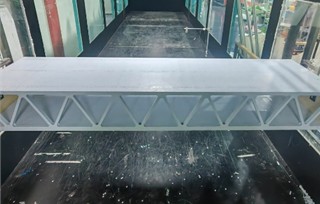
b) Construction state
Table 4Force test working condition setting
Model category | Test contents | Real wind speed | Wind angle of attack |
Completion state | three-component force coefficient test | 10, 15, 20 m/s | –12°-+12° |
Construction state | three-component force coefficient test | 10, 15, 20 m/s | –12°-+12° |
Fig. 5Aerodynamic coefficient curves of the trusses beam at different wind speeds
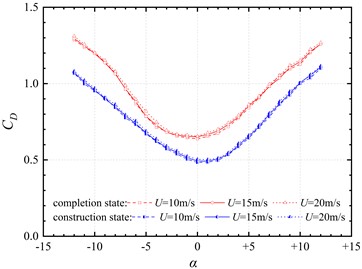
a) Drag coefficient
b) Lift coefficient
c) Moment coefficient
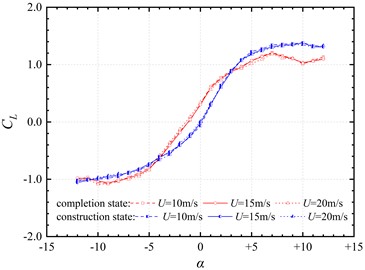
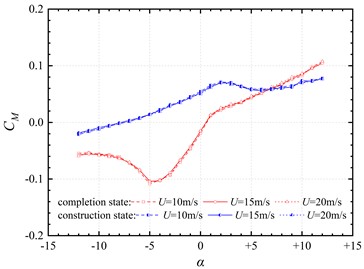
It can be seen from Fig. 5 that the drag coefficient , lift coefficient and moment coefficient of the completion and construction state segment model at each wind angle of attack don’t change significantly with the wind speed. This shows that the wind speed change will not have a significant impact on the static three-component force test results, and the Reynolds number effect is not obvious.
In Fig. 5(a), as the wind angle of attack increases from –12° to +12°, the drag coefficient of the completion state segment model decreases first and then increases, that is, the drag coefficient is larger at positive and negative large angles, and the drag coefficient is smaller at small angles, which is mainly caused by the larger area of wind load at large angles. In addition, the resistance coefficient curve is not symmetrical about the 0° wind angle of attack. This is mainly because the aerodynamic shape and the arrangement of the auxiliary members on the upper and lower sections of the trusses beam are inconsistent, and different wind-shield areas are generated under the same degree of positive and negative wind angles of attack. The resistance coefficient of the construction state section model has a similar change trend with the completion state, but it is significantly smaller than the resistance coefficient of the completion state. This is mainly because the auxiliary components such as railings and maintenance car tracks provide additional windshield area. The addition of auxiliary components increases the resistance coefficient by 20 % ~ 30 %.
The lift force is a force perpendicular to the direction of air flow due to the inconsistent flow velocity of air on the upper and lower sides of the trusses beam, resulting in a pressure difference between the upper and lower sides of the beam. In Fig. 5(b), the lift coefficient of the completion state segment model is negative at the negative angle, which decreases slightly at first and reaches the minimum at –9° wind angle of attack. After that, the drag coefficient gradually increases from negative to positive with the wind angle of attack. Due to the asymmetry of the cross section, the drag coefficient becomes positive at –1° wind angle of attack, rather than 0°. In the range of small attack angle, the velocity difference between the upper and lower surfaces of the main beam increases gradually with the increase of angle, and the lift coefficient increases almost linearly. In the range of large angle, the lift coefficient tends to be stable and the absolute value is large, which is caused by the large velocity difference between the upper and lower surfaces of the main beam at large angle. At the same time, it will also cause the flow separation of air and the generation of vortex current, which makes the growth of lift gradually saturated. The lift coefficient of the construction state segment model is the same as that of the completion state, and the values are similar, indicating that the auxiliary components such as the railing and the maintenance vehicle track will not have a significant impact on the wind speed difference between the upper and lower surfaces of the trusses beam.
The moment is generated by the pressure difference between the upper side of the windward side and the lower side of the leeward side. In Fig. 5(c), the moment coefficient of the completion state segment model is negative in the range of negative angle and positive in the range of positive angle. In the range of –5°-+12°, the moment coefficient increases with the increase of angle, which is related to the increase of the pressure difference caused by the expanding negative pressure area on the windward side. In the range of –12°- –5°, the moment coefficient decreases, which may be related to the sharp angle of the sidewalk arm on the windward side of the lower bridge deck. In addition, the moment coefficient of the trusses beam in the completion state is small, indicating that the main beam has good torsion resistance. The moment coefficient of the segment model in the construction state gradually increases with the increase of the wind angle of attack, and tends to be stable when the wind angle of attack exceeds +3°.
In the range of –5°-+5° wind angle of attack, the lift coefficient curve and moment coefficient curve of the completion state segment model maintain a positive slope, which indicates that the main beam can generate sufficient lift and moment in the range of common wind angle of attack to maintain the aerodynamic stability of the structure.
3.2. Results of static vortex-induced vibration test on original section
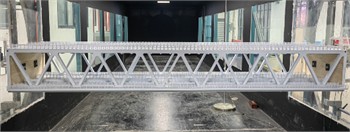
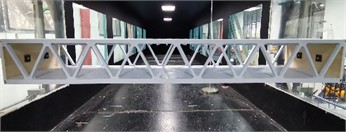
In order to obtain trusses beam VIV response under various wind angles of attack, vibration test of completion as well as construction state segment model is carried out. The specific conditions of the test can be illustrated in Fig. 6. The test wind speed is 0-10 m/s (accord with actual air pace of 0-44.8 m/s), meantime the air pace adjustment range of step-change is controlled to 0.08 m/s (accord with actual air pace of 0.36 m/s). For air pace range where VIV perhaps appear, the air pace adjustment range of step-change is reduced to 0.04 m/s (accord with actual air pace of 0.18 m/s), so as to more accurately grasp the lock-in range and amplitude of VIV. During each sampling, model’s shifting can be logged after oscillation restore to stable state. Data acquisition duration sets to 30 s. Chongqing is affected by both monsoon and mountain climates. The wind speed in the bridge site area is usually high, and the wind field characteristics are more complex due to the influence of complex terrain, which is significantly different from the wind field characteristics in flat and open areas. Considering those large angles that may occur in the valley landform of Chongqing mountainous domain, the vibration test of the completion state and the construction state segment model is carried out under 0°, ±3° and ±5°. Those specific test contents can be illustrated in Table 5.
Fig. 6Sectional model vibration test
a) Completion state
b) Construction state
Table 5Vibration test working condition setting
Model category | Test contents | Real wind speed | Wind angle of attack |
Completion state | VIV response test | 0-44.8 m/s | –5°, –3°, 0°, +3°, +5° |
Construction state | VIV response test | 0-44.8 m/s | –5°, –3°, 0°, +3°, +5° |
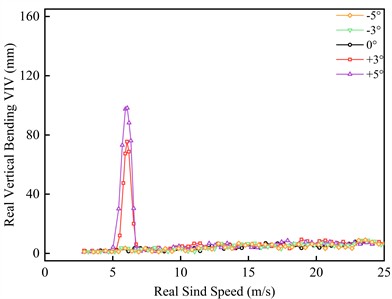
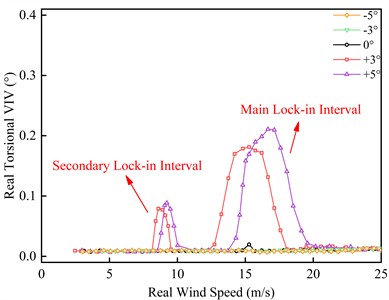
Through the vibration test of the completion segment model, this oscillation curve of VIV amplitude under completion state accompanying with different flow speed is obtained, as shown in Fig. 7.
Fig. 7VIV responses of the completion state trusses beam
a) Vertical bending VIV response
b) Torsional VIV response
From Fig. 7, it can be seen that there is no VIV of the trusses beam in completion state at –5°, –3° and 0°, but here is obvious VIV under +3° as well as +5°. As the expansion of air pace, the vertical bending VIV appears first, and soon afterwards a couple of torsional VIV with diverse fluctuation appear. Among them, torsional VIV lock-in region growths longer as well as VIV amplitude growths bigger under high flow velocity. The torsional VIV intervals under high flow velocity and low flow velocity are named as the main lock-in region and the secondary lock-in region respectively.
At the wind angle of attack of +3°, the vertical bending VIV lock-in region of the trusses beam is located at the wind speed of 4.93-6.72 m/s, the greatest fluctuation appears at the wind speed of 6.05 m/s, and the greatest fluctuation is 75.54 mm. The secondary and main lock-in regions of torsional VIV are located in the real bridge wind speed of 8.13-9.52 m/s and 12.73-18.06 m/s, respectively. The greatest fluctuations of the two intervals appear at the real bridge wind speed of 8.60 m/s and 15.28 m/s, respectively, and the greatest fluctuations are 0.079° and 0.181°. At the wind angle of attack of +5°, the vertical bending VIV lock-in region is located in the real bridge wind speed of 4.75-6.69 m/s, the greatest fluctuation appears at the real bridge wind speed of 6.06 m/s, and the greatest fluctuation is 98.23 mm. The secondary and main lock-in regions of torsional VIV are located in the wind speed of 8.53-10.02 m/s and 13.72-19.57 m/s respectively. The greatest fluctuations of the two intervals appear at the wind speed of 9.22 m/s and 16.67 m/s respectively, and the greatest fluctuations are 0.089° and 0.211°.
Compared with the +3° wind angle of attack, the greatest fluctuations of vertical bending VIV and torsional VIV are remarkably increased at +5° wind angle of attack. Among them, the greatest fluctuation of vertical bending VIV goes up by 30.0 %, meanwhile the greatest fluctuation of torsional VIV at strong wind speed and low-grade wind speed go up by 16.6 % and 12.7 %, separately. Besides that, the initiation wind speed of the vertical bending VIV shows trivial improvement, and the length of the lock-in region is obviously enlarged. The initiation wind speed of torsional VIV is obviously lagged, and the length of its lock-in region is also slightly increased. This shows that the wind angle of attack exists a noticeable impact on VIV response of trusses beam in completion state. In particular, bridge trusses beam at a large attack angle is more sensitive to VIV, and it is more prone to large-scale and large-amplitude VIV.
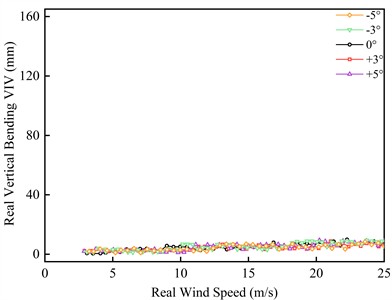
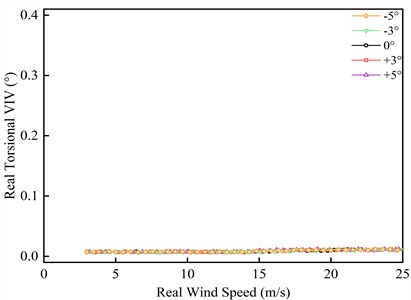
Through the vibration test of the segment model in the construction state, the oscillation curve of VIV amplitude under construction state accompanying with different flow speed is obtained, as shown in Fig. 8.
Fig. 8VIV responses of the construction state trusses beam
a) Vertical bending VIV response
b) Torsional VIV response
It can be seen from Fig. 8 that there is no VIV in the main beam of the construction trusses beam under the five wind angles of attack tested. This shows that the auxiliary member is an important reason for the VIV of the trusses beam.
3.3. Crest response dot time history and spectrum
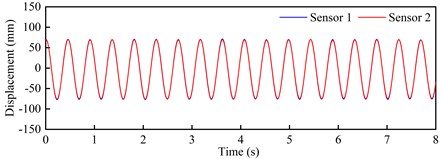
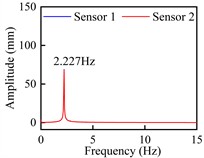
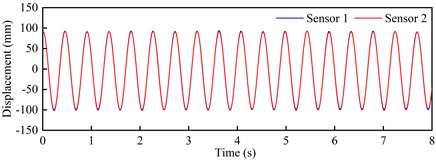
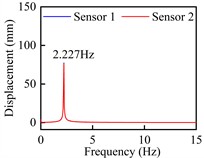
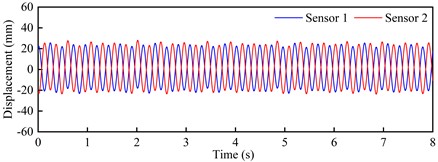
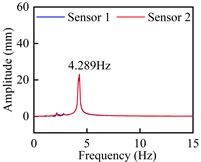
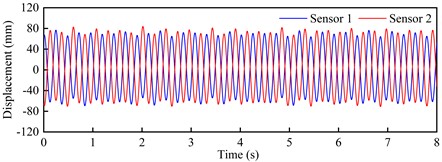
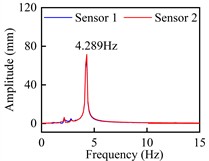
Under the wind angle of attack of +3° and +5°, the model’s shifting curve of the main beam recorded by two laser displacers at the crest response dot of each VIV lock-in region can be illustrated in Fig. 9 and Fig. 10, the corresponding spectrum can be obtained by Fourier transform [8-9] (the displacement value has been converted to the real bridge value).
Fig. 9Vertical bending VIV crest response dot time-history curve and spectra
a) Time-history curve: +3°, 6.05 m/s
b) Spectra: +3°, 6.05 m/s
c) Time-history curve +5°, 6.06 m/s
d) Spectra: +5°, 6.06 m/s
Fig. 10Torsional VIV crest response dot time-history curve and spectra
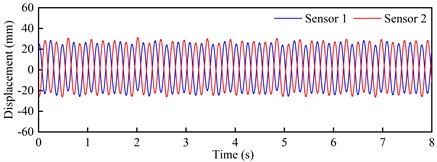
a) Time-history curve: +3°, 8.60 m/s
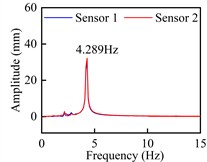
b) Spectra: +3°, 8.60 m/s
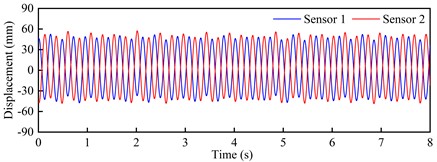
c) Time-history curve: +3°, 15.28 m/s
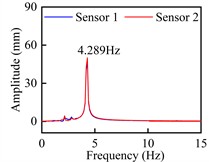
d) Spectra: +3°, 15.28 m/s
e) Time-history curve: +5°, 9.22 m/s
f) Spectra: +5°, 9.22 m/s
g) Time-history curve: +5°, 16.67 m/s
h) Spectra: +5°, 16.67 m/s
Observed from Fig. 9 and Fig. 10, these time-history curves recorded by laser displacement device at each VIV crest response dot show obvious single-frequency harmonic vibration characteristics under +3° as well as +5°. At the crest response dot of vertical bending VIV of the trusses beam section (Fig. 9), these model’s shifting curves are recorded by the two laser displacers, and the locking wind speed is close. The predominant frequency is 2.227 Hz, that is familiar with the vertical bending natural periodicity about test prototype. On its contrary, at the corresponding dots of secondary and main lock-in region crests of the torsional VIV (Fig. 10), the two laser displacement devices recorded the opposite model’s shifting curves. Although the locking wind speed is different, the predominant frequency is 4.289 Hz, that is familiar with the torsional natural periodicity about test prototype. All these above phenomena indicate that the vertical bending and torsional VIV of bridge beam have the possibility to be excited by vortex flow with different stripping frequencies.
4. Numerical analysis of target bridge under large attack flow
4.1. The comparison between test and simulation results
In the cause of verifying Computational Fluid Dynamics reliability, the static three-component force coefficients of trusses beam under these conditions of 10 m/s wind speed and five different wind angles of attack can be figured out. The results can be illustrated in Table 6.
The grid division of the CFD model is completed by the pre-processing software ICEM CFD 2022 R1. The computational domain is divided into two parts: the internal region and the external region by using the rigid motion region near the wall + the dynamic grid region + the background grid region. The external area is a static grid area which is divided by structured grid. The inlet boundary is set to the velocity-inlet boundary. The outlet boundary is set to the pressure-outlet boundary which can ensure the full development of the flow field in the downstream wake region and avoid the phenomenon of airflow backflow at the outlet. The upper and lower boundaries are set to the symmetry boundary. The internal region is a dynamic grid region and a near-wall rigid motion region, which is divided by unstructured grids. The main beam section and the outer wall of the auxiliary members are set to the non-slip wall boundary condition.
When the internal mesh is divided, the maximum size of the whole mesh is set to 7×10⁻⁵ ( is main beam width); the near-wall grid maximum size of the bridge deck and the web part is set to 5×10⁻⁵, the near-wall grid maximum size of the railing part is set to 2×10⁻⁵, and a 10-layer boundary layer with a linear growth rate of 1.1 is set. The growth rate of external structured mesh is 1.05, and the maximum mesh size is 3×10⁻⁴. According to the above setting, the total number of CFD models generated by the software is about 784,000. The time step is 1×10⁻⁴s, the number of calculation steps is 1×10⁵ steps, and the total calculation time is 10 s.
Table 6Comparisons of aerodynamic coefficients test and simulation values
–5° | –3° | 0° | +3° | +5° | ||
Value of experiment | 0.7855 | 0.6810 | 0.6531 | 0.7320 | 0.8553 | |
Value of simulation | 0.7618 | 0.6542 | 0.6389 | 0.7221 | 0.8198 | |
Error | 3.02 % | 3.93 % | 2.17 % | 1.35 % | 4.15 % | |
Value of experiment | –0.8207 | –0.4102 | 0.2989 | 0.8767 | 1.0678 | |
Value of simulation | –0.7985 | –0.4011 | 0.2812 | 0.8456 | 1.0547 | |
Error | 2.71 % | 2.22 % | 5.92 % | 3.55 % | 1.23 % | |
Value of experiment | –0.1039 | –0.0889 | –0.0153 | 0.0310 | 0.0451 | |
Value of simulation | –0.0998 | –0.0841 | –0.0145 | 0.0282 | 0.0419 | |
Error | 3.95 % | 5.40 % | 5.23 % | 9.03 % | 7.09 % | |
From Table 6, it can be seen that the minimum error between the test value and the simulated value of the static three-component force coefficient is 1.23 %, the maximum error is 9.03 %, the average error of drag, lift as well as moment coefficient is 2.92 %, 3.13 % and 6.14 %, respectively, and the overall average error is 4.06 %. From the perspective of static three-component coefficient, the calculation result error is small, and the numerical simulation accuracy is high.
User Define Function (UDF) is a secondary development module provided by Fluent software to expand its functions and meet specific user needs. It allows users to add new physical models, boundary conditions, source terms or other functions by writing custom C language code.
In this study, the DEFINE_CG_MOTION macro is used in the UDF program for solving the vertical bending VIV response of the main beam. The user-defined motion function is used to control the motion of the computational domain, so as to define the linear velocity and angular velocity of the rigid body at each time step. The corresponding vertical bending VIV differential equation is:
where, is the mass of the structure, is the vertical displacement of the structure, is the vertical bending damping of the structure, is the vertical bending stiffness of the structure, and is the vertical force of the structure.
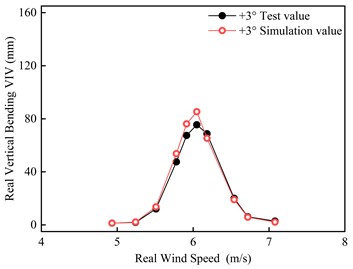
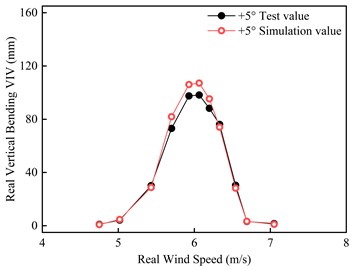
In the cause of further verifying CFD reliability, the UDF program is activated during the numerical simulation process to simultaneously solve the vertical bending VIV amplitude. The comparison between the experimental value and the simulated value of the vertical bending VIV amplitude under the wind angle of attack of +3° and +5° can be illustrated in Fig. 11.
Fig. 11Comparison of vertical bending VIV amplitude between test and simulation
a)+3°
b)+5°
From Figure 11, it can be seen that the locking range, amplitude and change trend of vertical bending VIV obtained by numerical simulation are similar to those of wind tunnel test. Under +3°, the greatest fluctuation obtained by numerical simulation is 83.31 mm, which deviates from the experimental value of 75.54 mm by 10.29 %; Under +5°, the greatest fluctuation obtained by numerical simulation is 107.14 mm, which is 9.07 % deviation from the experimental value of 98.23 mm. The greatest error between two methods is 10.29 %, while the average error is 5.64 %. From the perspective of vertical bending VIV amplitude, the calculation result error is small, and the numerical simulation accuracy is high.
In summary, the CFD method used in this study is reasonable, the CFD results plays exactly, and target model accuracy is good. It is reliable to assay these characteristics of air flow field around the main beam section.
5. The Characteristics of flow field around the original section
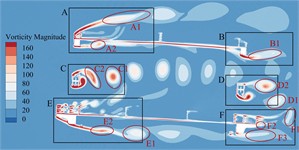
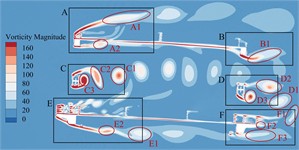
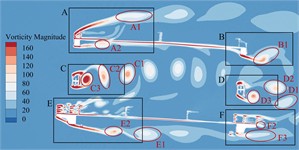
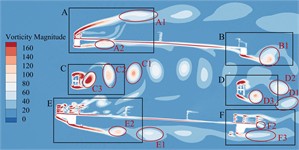
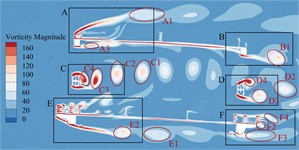
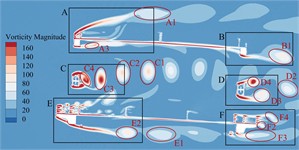
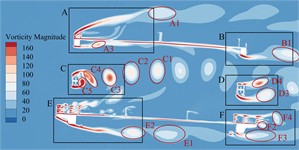
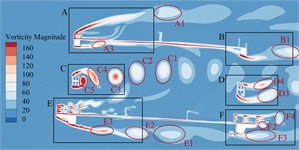
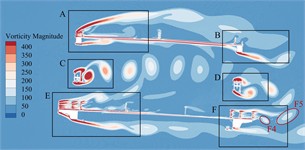
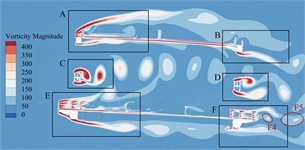
Bridge test shows that the trusses beam in the completion state has obvious VIV phenomenon under +3° as well as +5°. In order to explore the mechanism of VIV, it is necessary to analyze the flow field around the main beam section. Taking this crest response dot of vertical bending VIV under +3° as an example, the generation, attachment, separation and stripping of vortex after air flow leapfrogs the main beam section are analyzed. The instantaneous vorticity evolution in one single vibration period can be illustrated in Fig. 12.
Fig. 12Transient vorticity evolution of the trusses beam cross-section within one vibration cycle at the crest response dot of vertical bending VIV
a)
b)
c)
d)
e)
f)
g)
h)
According to Fig. 12, these ingoing flow passes through the upper bridge lay, web member and underpart bridge lay to separate, resulting in vortices of different sizes and different frequencies and falling off. According to the vortex stripping, the flow field around the main beam section can be divided into six regions A-F. The evolution of vorticity in each region is as follows:
In domain A of the upper bridge lay, this flow is separated after passing through the upper chord. The airflow on the upper lay is blocked by the railings of service trunk as well as those anti-collision railings, and a vortex A1 with a width of about 0.2 ( is bridge breadth) can be formed at the top of upper lay. After separation, it continues to move downstream, and the strength gradually decreases until it dissipates. A complete vortex stripping is completed in a single vibration period. The vortex stripping frequency is close to the vibration frequency of the vertical bending VIV, indicating that the vortex may be related to the vertical bending VIV. Except for railing top part, high-frequency stripping vortices are also continuously generated in the gap of the railing, but they are small in size and low in strength, and dissipate quickly. In addition, after the incoming flow is blocked by the upper chord, vortices A2 and A3 with smaller size and underpart strength are formed on the underpart side. Under the effect on the 'compression effect' of upper and underpart bridge lays [10-12] and the wind angle of attack, they quickly attach to the bridge lay and move downstream close to the underpart surface, and the vortex stripping frequency is slightly higher than that at the top of the upper railing.
These vortex stripping around the leeward side domain B of the upper bridge lay is relatively simple. That airflow moving close to the underpart surface of the upper bridge lay is blocked by the upper chord on the leeward side to form vortex B1. After separation, it continues to move downstream and the size is further increased. There is no obvious vortex stripping above the upper chord on the lee area. In one single vibration period, the underpart side of upper chord just completes a complete vortex stripping period, that is, the vortex stripping frequency is very familiar with bridge vertical bending VIV frequency. Some Scholars [13-15] found that the key factor in the generation of vertical bending VIV is the formation of large-scale vortices on the upper as well as underpart bridge surfaces, while periodic VIV force is generated on the main beam during the movement. Therefore, it can be inferred that the vortex in the domain above the upper bridge lay and the wake flow domain is related to the vertical bending VIV.
In that windward side of belly bar domain C, the inflow is blocked by the belly bar, and the top vortex stripping occurs on the upper and underpart side-edges of belly bar, while these vortices on both side-edges fall off alternately, showing a representative Karman vortex street occurrence After the vortex separation, it moves downstream and develops until it dissipates. During a vibration period, there are five vortices from C1 to C5 in region C, and the vortex stripping frequency shows higher than the vertical bending VIV frequency.
Due to this consistent cross-section form, the region D of the leeward side web member should have a similar vortex stripping mode to the region C. However, because the incoming flow is no longer a uniform flow, it is alternately impacted by the upstream periodic vortex, and the leeward side web member undergoes staggered edge vortex stripping to form a Karman vortex street. In a single vibration period, only four vortices are generated in region D from D1 to D4, and the vortex stripping frequency is significantly underpart than that in region C. The VIV force generated by the vortex is proportional to its intensity and inversely proportional to the square of distance [13]. However, the section size of web member is small and far away from the upper and underpart bridge lays. Therefore, this vortex stripping behind the web member has little effect on the VIV of the main beam.
The windward side domain E of the underpart bridge lay is similar to domain A, and the underpart side flow is separated into two parts by underpart bridge lay. That airflow on the upper side is blocked by the sidewalk railings and the anti-collision railings. Although no large vortex is formed, a large number of smaller but higher frequency and stronger vortices are generated at the gap between the railings and the top of the railings. Some vortices are “compressed” by upper and underpart bridge lays and attached to underpart bridge lay. These remaining vortices slowly move downstream until they dissipate. The underpart airflow is blocked by the sidewalk bracket for the first time, and quickly attaches to the underpart chord of the windward side. After the separation again, it is blocked by the track of the maintenance vehicle, and a vortex E1 to E3 with a width of about 0.1B is formed behind it. After the separation, it continues to move downstream, the size is further increased, and there is no reattachment phenomenon. The vortex stripping frequency is greater than the vibration frequency of the vertical bending VIV of the trusses beam.
There are many factors that affect the vortex stripping in the leeward domain F of the underpart bridge lay, and the vortex stripping mode is more complex than other domains. The vortex generated in this domain is mainly composed of the vortex F1 stripping from the top of the railing, the small vortex stripping from the gap of the railing, the wake flow F2 stripping from the sidewalk upper surface, and wake flow F3 generated at the bottom of the underpart chord. In addition, the maintenance vehicle track plays a role in blocking the incoming flow in front of the underpart chord. It should be noted that the F3 width of the wake flow is large and moves downstream in an S-shaped manner. The vortex intensity in the wake flow is low and there is no obvious vortex stripping phenomenon. However, with the increase of wind speed, large vortex stripping may occur. The airflow on the upper surface of the underpart bridge lay is close to the bridge lay under the 'compression effect'. The boundary layer is thin, and only vortex stripping occurs in the wake. Therefore, this vortex does not directly act on the upper as well as underpart bridge surfaces, which is not major cause of the vertical bending VIV.
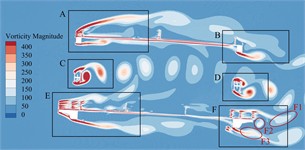
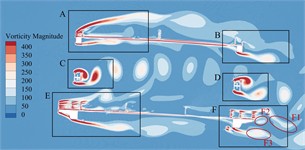
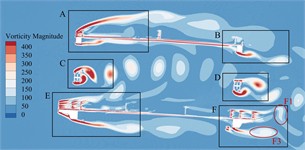
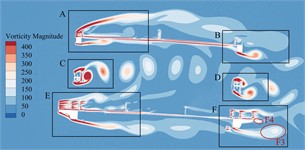
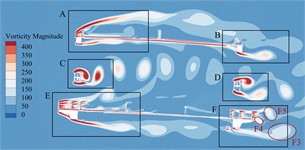
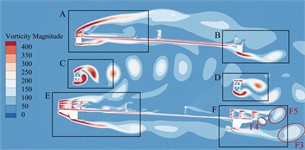
By observing the evolution of the flow field around the vertical bending VIV crest response dot of the trusses beam in a single vibration period, it can be found that these vortex stripping frequency in the upper side domain and the wake flow domain of the upper bridge lay is familiar with the height of the vibration frequency, which may drive the vertical bending VIV o. In order to find out which vortex that dominates the torsional VIV, the CFD numerical simulation is carried out on the completion state trusses beam with the crest response dot of the torsional VIV under +3°. That instantaneous vorticity evolution in one single vibration period can be illustrated in Fig. 13.
Fig. 13Transient vorticity evolution of the trusses beam within one vibration cycle at the crest response dot of torsional VIV
a)
b)
c)
d)
e)
f)
g)
h)
Observing from Fig. 13, when the torsional VIV occurs, there is no significant change in the vortex stripping pattern in the A-E zone except for the domain F on the leeward side of the underpart lay. However, due to the large increase of the wind speed, vortex strength in each area has increased significantly. In domain F of the underpart bridge lay, the vortex stripping mode above bridge lay does not change significantly, but the wake flow under the underpart chord has obvious vortex stripping phenomenon with the overgrowth of flow velocity. Vortex F3, vortex F2 as well as F4 formed on the upper surface of the sidewalk fall off alternately, and continue to move downstream until it dissipates. In addition, in a single torsional VIV period, a complete vortex stripping period is completed here, that is, the vortex stripping periodicity can be familiar with the torsional VIV periodicity of bridge trusses beam, which may drive the torsional VIV.
The two-lay trusses beam is composed of multiple components, and the section form is complex. Different components show different turbulence characteristics, resulting in vortices of different sizes and stripping frequencies. In order to explore the mechanism of VIV and verify that target bridge VIV can be made from these vortex stripping in these above domain, 29 measuring dots are arranged near the main beam section in the numerical simulation calculation. The flow field around the main beam section is calculated and the wind speed change is recorded. The measuring dots of P1-P6, P7-P12 and P13 are set above, below and behind the upper bridge lay respectively. The measuring dots of P14 and P15 are set behind the ventral rods on the windward and leeward sides, respectively. The measuring dots of P16-P21, P22-P28 and P29 are set above, below and behind the underpart bridge lay, respectively. The measuring dots of P22 and P28 are located behind the track of the maintenance vehicle, while the specific settlement of these dots can be illustrated in Fig. 14.
Fig. 14Schematic diagram of measurement dot locations

Through the frequency-response curve spectrum assay of the air velocity time series recorded at the measuring dot, that frequency of vortex stripping at each position of the flow field is obtained, and the corresponding is calculated. The results can be illustrated in Table 7.
Table 7Characteristic frequency and St number of measurement dots
Measuring dot | Frequency (Hz) | ||
Crest response dot of vertical bending VIV | Crest response dot of torsional VIV | ||
P29 | 1.47, 3.08 | 3.96, 7.78 | 0.33, 0.65 |
P1-P6, P13 | 2.39 | 6.04 | 0.51 |
P7-P12, P22-P28 | 2.68 | 6.82 | 0.57 |
P1-P6, P16-P21 | 4.54 | 11.39 | 0.96 |
P22, P28 | 5.02 | 12.62 | 1.06 |
P15 | 8.85 | 22.34 | 1.87 |
P7-P14 | 10.54 | 26.48 | 2.23 |
In the wind tunnel test of the segment model, the vibration frequency of the vertical bending VIV in the completion state is 2.23 Hz, and the corresponding number is 0.47, which is close to the number of 0.51 recorded by the P1-P6 and P13 measuring dots in the CFD numerical simulation. Combined with Fig. 12, it can be considered that those vortex stripping in the upper lay and wake flow domain dominates vertical bending VIV of the trusses beam in the completion state. Accompany with the torsional VIV occurrence, the vibration frequency of the main as well as secondary lock-in region recorded in the wind tunnel test is 4.29 Hz, and the corresponding number is 0.36 and 0.64, respectively, which is close to the number of 0.33 and 0.65 corresponding to these vortex stripping of P29 zone in CFD numerical simulation, and the P29 measuring dot is located on the side of the main beam. The VIV force generated here has more possibility to promote target bridge to produce torsional VIV. Combined with Fig. 13, it can be considered that the vortex stripping in the wake flow region of the underpart lay plate dominates torsional VIV of bridge main beam in the completion state. Therefore, when it is necessary to use aerodynamic measures to suppress the VIV of the target bridge, the aerodynamic shape of the above domain should be optimized [16-18].
6. The influence of wind angle of attack
6.1. The primitive section of construction-state model
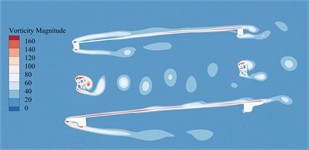
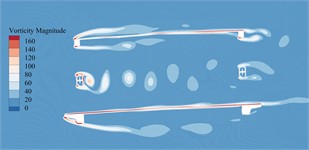
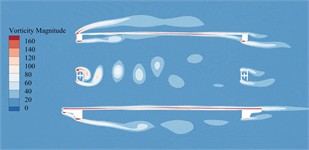
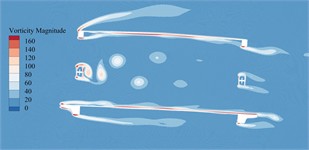
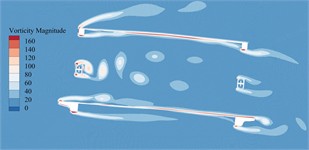
The vorticity distribution of the static flow field around the primitive section of the main beam in construction state at a certain time under –5°, –3°, 0°, +3° as well as +5° can be illustrated in Fig. 15. Since here exists no obvious VIV occurrence in wind tunnel test of bridge main beam in construction state, in order to facilitate the comparison with the completion state, the wind speed corresponding to the crest response dot about vertical bending VIV in completion-state model is used for numerical simulation.
Fig. 15Vorticity distributions around the trusses beam under different wind angles of attack during construction state
a) –5°
b) –3°
c)0°
d)+3°
e)+5°
From Fig. 15, it can be seen that the aerodynamic performance of the primitive section in construction state is good. After the flow of each wind angle of attack passes through bridge beam, only the rear of web member produces an obvious Karman vortex street, and the remaining parts do not form a vortex with sufficient strength and range. The VIV force generated is difficult to drive the vibration of the main beam. In addition, due to the lack of the influence from auxiliary components such as railings, maintenance vehicle tracks and sidewalks, the vortex stripping frequency in the key domains of the above-mentioned dominant VIV is far away from the vertical bending and torsional fundamental frequency of the main beam, so here exists no obvious VIV occurrence of bridge main beam in construction state.
6.2. The primitive section of completion-state model
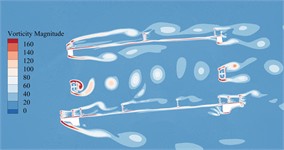
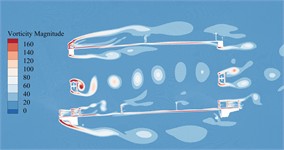
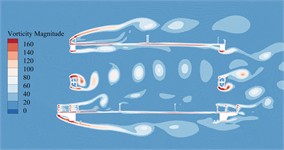
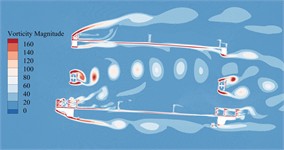
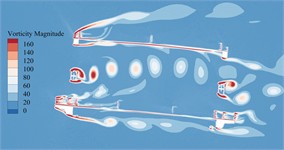
The vorticity distribution of the static flow field around the primitive section of the main beam in the completion state at a certain time under –5°, –3°, 0°, +3° as well as +5° can be illustrated in Fig. 16.
It can be seen from Fig. 16 that due to the addition of railings, maintenance vehicle tracks and sidewalk brackets, the vortex stripping pattern of primitive bridge section in completion state is more complicated, especially a large number of non-negligible vortices are generated near these auxiliary components. Compared with the primitive section of the main beam in the construction state, these vortices have stronger strength and wider range, and produce greater VIV force on the main beam. Therefore, the aerodynamic performance of the main beam is reduced. When the vortex stripping frequency is close to the vibration frequency of the main beam, there is an obvious VIV phenomenon. Compared with +3° and +5°, that vortex generated by bridge main beam section under the other wind angles of attack is small in size and low in strength, which is not enough to drive the bridge to generate VIV. Especially in the key domain behind the underpart bridge lay, the blocking of windward lay to that incoming flow makes it impossible to form vortex stripping behind the underpart chord on the leeward side. Therefore, the main beam in the completion state has obvious VIV phenomenon only under +3° as well as +5°.
Fig. 16Vorticity distributions around the trusses beam under different wind angles of attack during completion state
a) –5°
b) –3°
c)0°
d)+3°
e)+5°
7. Conclusions
This study mainly explores the aerodynamic performance of the primitive section in the completion as well as construction state under large wind angle of attack. The VIV response of the segment model under different wind angles of attack is tested by wind tunnel test. The vorticity evolution of the beam section in a single vibration period is analyzed by CFD. The VIV formation mechanism as well as the impact about wind angle of attack on VIV are explored. These main conclusions are as follows:
1) The vibration test shows that the main beam in the completion state has obvious VIV phenomenon under +3° and +5°, while bridge main beam in construction state has no VIV phenomenon at the five wind angles of attack.
2) The vertical bending VIV first occurred in the main beam of the completion state, and then two torsional vortex vibrations with a large amplitude and a small amplitude occurred. Both vertical bending and torsional VIV are simple harmonic vibrations with a single frequency, and the vertical bending VIV frequency is confined at 2.227 Hz, and the torsional VIV frequency is confined at 4.289 Hz, which is close to the natural frequency of the test model. Compared with the +3° wind angle of attack, the VIV amplitude of the main beam is larger and the lock-in region is longer under +5°.
3) The three-component force coefficients of the main beam obtained by the wind tunnel test and the numerical simulation play well consistency about the outcome of vertical bending VIV amplitude, indicating that the CFD method used in this study is reasonable, CFD results plays exactly, so that target model is highly reliable.
4) The static flow field around the main beam section is obtained by CFD numerical simulation. When the ingoing air flow leapfrog different composing parts of bridge main beam, multiple vortex flow with different strength, size and stripping frequency are formed. By analyzing the instantaneous vorticity evolution of the main beam section in a single vibration period and the time series of wind speed recorded by the measuring dots, it can be seen that the vortex stripping in the upper lay and wake flow domain is key influencing factor of vertical bending VIV in completion state, meanwhile the vortex stripping in wake flow domain of the underpart lay is key influencing factor of the torsional VIV.
5) Due to the lack of railings, service truck trackways, and walkway brackets, the construction-state trusses beam produces fewer vortices and low strength, so no VIV occurs. Although a large number of non-negligible vortices are generated in the main beam section of the completion state, at 0°, −3° and −5°, here exists no vortex in rear domain of the underpart chord on the leeward side because the incoming flow is blocked by the lay on the windward side, and the vortices generated in the rest parts are difficult to form sufficient VIV force. Therefore, there is no obvious VIV phenomenon in the main beam of the completion state at these wind angles of attack.
In the next research blueprint, we plan as follows:
1) In the current conventional wind tunnel test and numerical simulation, we use uniform flow as the research object, and the results are conservative. The actual wind environment is turbulent, so we plan to design a specific turbulent flow field for testing or expansion in the future.
2) The main objective of this study is to explore the effect of wind angle of attack on bridge VIV. Based on this, we plan to focus on exploring and analyzing effective additional aerodynamic measures, including deflectors, fairings, tuned mass dampers, etc., and analyze their applicability and effectiveness in actual bridge engineering, so as to provide a more comprehensive solution to VIV-related problems in the future.
3) VIV is a complex fluid-solid coupling phenomenon, which is affected by many factors. For bridges, the main influencing factors include aerodynamic shape, Reynolds number, Strouhal number, mass-damping parameters, etc. In our current research, we mainly consider the influence of aerodynamic shape transformation on the VIV performance of the main beam. However, in the future research, we will further consider the comprehensive influence of structural damping and other factors on the VIV performance of the main beam in the completion and construction state.
References
-
C. Pany, “Panel Flutter Numerical study of thin isotropic flat plates and curved plates with various edge boundary conditions,” Politeknik Dergisi, Vol. 26, No. 4, pp. 1467–1473, Dec. 2023, https://doi.org/10.2339/politeknik.1139958
-
S. Cao, Y. Zhang, H. Tian, R. Ma, W. Chang, and A. Chen, “Drive comfort and safety evaluation for vortex-induced vibration of a suspension bridge based on monitoring data,” Journal of Wind Engineering and Industrial Aerodynamics, Vol. 204, p. 104266, Sep. 2020, https://doi.org/10.1016/j.jweia.2020.104266
-
M. He, P. Liang, Y. Zhang, Y. Wang, and K.-D. Wang, “Identification, tracking and warning of vortex induced vibration using k-means clustering method,” Structure and Infrastructure Engineering, Vol. 20, No. 3, pp. 380–393, Mar. 2024, https://doi.org/10.1080/15732479.2022.2096081
-
C. Neto, D. R. Evans, E. Bonaccurso, H.-J. Butt, and V. S. J. Craig, “Boundary slip in Newtonian liquids: a review of experimental studies,” Reports on Progress in Physics, Vol. 68, No. 12, pp. 2859–2897, Dec. 2005, https://doi.org/10.1088/0034-4885/68/12/r05
-
S. Maheux, J. P. C. King, A. El Damatty, and F. Brancaleoni, “Theory for nonlinear section model tests in the wind tunnel for cable-supported bridges,” Engineering Structures, Vol. 266, p. 114623, Sep. 2022, https://doi.org/10.1016/j.engstruct.2022.114623
-
Y.-B. Yang, C. W. Lin, and J. D. Yau, “Extracting bridge frequencies from the dynamic response of a passing vehicle,” Journal of Sound and Vibration, Vol. 272, No. 3-5, pp. 471–493, May 2004, https://doi.org/10.1016/s0022-460x(03)00378-x
-
A. M. Puzrin and G. T. Houlsby, “Rate-dependent hyperplasticity with internal functions,” Journal of Engineering Mechanics, Vol. 129, No. 3, pp. 252–263, Mar. 2003, https://doi.org/10.1061/(asce)0733-9399(2003)129:3(252)
-
N. Rezazadeh, A. de Luca, and D. Perfetto, “Unbalanced, cracked, and misaligned rotating machines: a comparison between classification procedures throughout the steady-state operation,” Journal of the Brazilian Society of Mechanical Sciences and Engineering, Vol. 44, No. 10, p. 450, Sep. 2022, https://doi.org/10.1007/s40430-022-03750-1
-
A. Gonzalez, M. Ferrer, M. de Diego, G. Piñero, and J. J. Garcia-Bonito, “Sound quality of low-frequency and car engine noises after active noise control,” Journal of Sound and Vibration, Vol. 265, No. 3, pp. 663–679, Aug. 2003, https://doi.org/10.1016/s0022-460x(02)01462-1
-
S. Oh, S.-I. Seo, H. Lee, and H.-E. Lee, “Prediction of wind velocity to raise vortex‐induced vibration through a road‐rail bridge with truss‐shaped girder,” Shock and Vibration, Vol. 2018, No. 1, pp. 1–10, Aug. 2018, https://doi.org/10.1155/2018/2829640
-
A. Larsen and A. Wall, “Shaping of bridge box girders to avoid vortex shedding response,” Journal of Wind Engineering and Industrial Aerodynamics, Vol. 104-106, pp. 159–165, May 2012, https://doi.org/10.1016/j.jweia.2012.04.018
-
H. Tang, J. Kang, and Y. Li, “Aerostatic and aerodynamic stability of a suspension bridge during early erection stages,” Journal of Wind Engineering and Industrial Aerodynamics, Vol. 233, p. 105297, Feb. 2023, https://doi.org/10.1016/j.jweia.2022.105297
-
C. Hu, L. Zhao, and Y. Ge, “Mechanism of suppression of vortex-induced vibrations of a streamlined closed-box girder using additional small-scale components,” Journal of Wind Engineering and Industrial Aerodynamics, Vol. 189, pp. 314–331, Jun. 2019, https://doi.org/10.1016/j.jweia.2019.04.015
-
Y. Gang, Y. Yang, W. Bo, L. Lianjie, and Z. Liangliang, “Aerodynamic admittance influence on buffeting performance of suspension bridge with streamlined deck,” Journal of Vibroengineering, Vol. 21, No. 1, pp. 198–214, Feb. 2019, https://doi.org/10.21595/jve.2018.19681
-
B. Wu, J. Zhou, S. Li, J. Xin, H. Zhang, and X. Yang, “Combining active and passive wind tunnel tests to determine the aerodynamic admittances of a bridge girder,” Journal of Wind Engineering and Industrial Aerodynamics, Vol. 231, p. 105180, Dec. 2022, https://doi.org/10.1016/j.jweia.2022.105180
-
Y. Yan, T. Yagi, K. Noguchi, Y. Ito, and R. Shimada, “Effects of handrail details on vortex-induced vibration for a box-girder bridge,” Journal of Bridge Engineering, Vol. 27, No. 3, p. 04021, Mar. 2022, https://doi.org/10.1061/(asce)be.1943-5592.0001835
-
J. Zhan, D. Xin, J. Ou, and Z. Liu, “Experimental study on suppressing vortex-induced vibration of a long-span bridge by installing the wavy railings,” Journal of Wind Engineering and Industrial Aerodynamics, Vol. 202, p. 104205, Jul. 2020, https://doi.org/10.1016/j.jweia.2020.104205
-
D. Xin, J. Zhan, H. Zhang, and J. Ou, “Control of vortex-induced vibration of a long-span bridge by inclined railings,” Journal of Bridge Engineering, Vol. 26, No. 12, p. 04021, Dec. 2021, https://doi.org/10.1061/(asce)be.1943-5592.0001803
About this article
This study is especially grateful for Chongqing Urban Railway Express Digital Construction Method and Control Research Project (City Section 2023 No.5-1), Chongqing Urban Rail Express Line Full Life Cycle CIM Technology Application Research and Demonstration Research Project (S20220413) and Central University Basic Research Fund of China (2023CDJXY-031).
The datasets generated during and/or analyzed during the current study are available from the corresponding author on reasonable request.
Jialin Yao: conceptualization. Huanhuan Li: primitive writing, software, visualization. Yang Yang: review and editing. Dawu Wang: data collation. Hui Yu: data collation.
The authors declare that they have no conflict of interest.
