Abstract
Engine abnormal noise is one of the common engine faults, which will affect the comfort, power and safety of the automobile at the same time. In order to study the abnormal noise existing in the test process of diesel engine lubricating oil circuit system, 1D numerical simulation analysis of its flow field is carried out by using simulation software GT-power to verify the boundary conditions of the model and analyze the fluctuation of pressure at different speeds and temperatures. Through numerical analysis, it is found that there is almost no pressure fluctuation in the lubrication system before the pressure limiting valve is opened, but after the pressure limiting valve is opened, pressure fluctuation occurs in the pipeline, and the pressure fluctuation is different at different positions. Finally, the lubrication pipeline is simulated and analyzed by Pumplinx software, and the pressure fluctuation in the lubrication pipeline of diesel engine is reduced by optimizing the diameter of the oil pipeline and increasing the cavity structure.
1. Introduction
The main function of diesel engine lubrication system is to provide sufficient and appropriate temperature oil for each friction pair of the engine to reduce the friction loss during engine operation, and at the same time take away excess friction heat, thus ensuring the power, economy, reliability and durability of the internal combustion engine. The main components of engine lubrication system are oil pan, oil filter, oil pump, pressure limiting valve, oil filter, etc.
In diesel engine lubrication oil circuit system, pressure fluctuation is the main reason for vibration of lubricating oil pipeline and auxiliary equipment. There are many factors causing pressure fluctuation in lubricating oil pipeline [1, 2]. The first factor is the impact of relief valves and pilot valves on pressure fluctuations. The second factor is the influence of oil transfer pump on pressure fluctuation, parameters such as pressure, velocity and density of fluid in pipe fluctuate periodically with time [3, 4]. The third factor is the influence of elbow, reversing valve and actuator on pressure fluctuation in lubricating oil pipeline. When pulsating fluid encounters impedance pipeline components such as valve, flange and elbow, vibration and noise will be caused under the action of excitation force. In addition, air mixed in the lubricating oil pipeline or wear of hydraulic components also have an impact on pressure fluctuations. In addition, air mixed in the lubricating oil pipeline or wear of hydraulic components also have an impact on pressure fluctuations.
In this paper, a diesel engine lubricating oil system is taken as the research object. GT-Power is used to simulate the pressure fluctuation in the flow field of the pipeline for abnormal noise in the same position of the lubricating oil system are analyzed. The authenticity of the simulation model is verified by experiments. Pumplinx software is used to optimize the structure of the lubricating oil pipeline and reduce the abnormal noise of the diesel engine lubricating oil system.
2. Simulation analysis model construction and validation
2.1. Analytical modeling
The specific working process of diesel engine lubricating oil system has been shown in the Fig. 1. The lubricating system analysis model is established by 1D fluid simulation software GT-power. The oil holes and oil passages in the engine body are replaced by special circular pipeline models. The discrete losses generated when the oil flows in the oil passages of the engine body in the places where the flow direction changes and the cross-sectional area of the oil passages changes are simulated by T-shaped interfaces. The 1D analysis model of the engine lubrication system is shown in the following Fig. 2.
The 1D analysis model is mainly composed of pipelines, oil pumps, pressure limiting valves, etc., where “End-1” is the oil pan pressure; “End-1-1” is the oil filter inlet; “End-2-1” is the pressure relief valve outlet pressure; the physical parameters of the oil adopt the relevant parameters of “Oil-10W30” in the software material library.
Fig. 1Lubricating oil circuit diagram
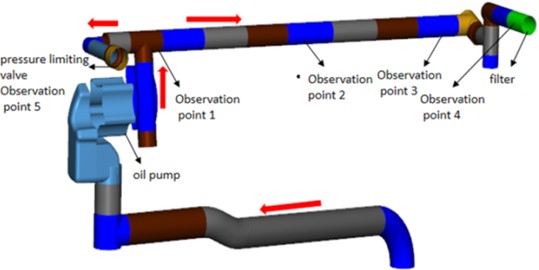
Fig. 21D analysis of lubricating oil circuit

2.2. Validation of analytical model accuracy
Diesel engine lubricating oil system actually relies on the oil pressure provided by the oil pump and the flow resistance of the lubricating system itself to complete the oil distribution and lubrication work, so the key point of calibrating the lubricating model is to verify the internal pressure of the lubricating system. The pressure sensor of this test is located at the inlet of the oil filter, as shown in the Fig. 3. Test conditions: During the whole process, the engine accelerates from 0 r/min to 2200 r/min, and runs at 1800 r/min, 2000 r/min and 2200 r/min for 10 s respectively.
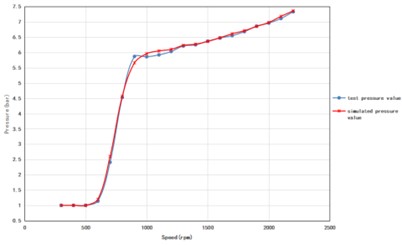
In the analysis model, the oil pan is the inlet with the pressure is 1 bar, the pressure limiting valve outlet is the outlet with the pressure is 1 bar; the oil filter inlet is the pressure outlet, and the pressure is obtained from the test. Fig. 4 shows the comparison between test data and simulation data of calibrated oil pressure measurement points. The maximum difference between simulation data and test data of oil pressure at the inlet of oil filter is about 5 %.
Fig. 3Schematic diagram of test points
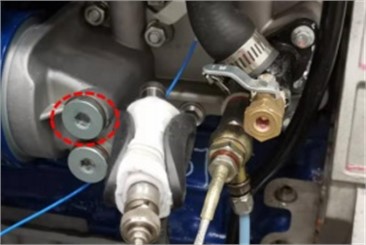
Fig. 4Comparison of results
3. Simulation of diesel engine lubricating oil system
3.1. Simulation analysis of diesel engine lubricating oil system
Fluid pressure fluctuation is one of the main sources of abnormal vibration and noise in lubrication pipeline systems. This paper focuses on in-depth analysis of fluid pressure fluctuation. 1D analysis cannot consider the pressure fluctuation caused by oil pump rotation, so the pressure fluctuation caused by oil pump is ignored in this paper.
Fig. 5Schematic diagram of observation point location

According to the characteristics of the model, five observation points are selected, which are shown in Fig. 5. Among them, observation point 1are the places where the shape of the pipeline changes greatly. Observation point 5 is the inlet position of the pressure limiting valve.
Table 1Oil pressure and flow at observation point1 and point 5
1800 r/min | 2000 r/min | 2200 r/min | ||||
Pressure (bar) | Flow (L/min) | Pressure (bar) | Flow (L/min) | Pressure (bar) | Flow (L/min) | |
Point 1 | 6.82 | 22.1 | 7.14 | 27.4 | 7.51 | 26.9 |
Point 5 | 6.82 | 0 | 7.14 | 0 | 7.49 | 4.99 |
Table 1 shows the oil pressure and flow at engine speed from 1800 r/min to 2200 r/min with normal temperature. From simulation results, it is consistent with actual conditions of diesel engine. From the tables, it can be seen that with the increase of speed, the outlet pressure and flow rate of the oil pump in the lubrication system are increased, and it can meet the requirements of lubricating on the different working conditions of diesel engine.
On the condition of 1800 and 2000 r/min with normal temperature, the oil pressure does not reach the opening condition of the pressure limiting valve, the flow at point 5 is 0 L/min. there is almost no pressure fluctuation in the pipeline. But on the condition of 2200 r/min, the pressure at point 5 has reach the pressure limit of valve, the pressure limiting valve is opened. Because of the small flow aperture at the end of the pressure relief valve, it has a certain throttling effect, and the flow rate of point 5 is only 4.9 L/min. During the process of lubricating oil flowing from point 1 to point 5, the pressure of point 5 is slightly lower than that of point 1 due to the influence of pipe diameter reduction and loss along the way. Pressure fluctuations occur at observation point, and the pressure fluctuation at the pressure limiting valve is the most obvious.
3.2. The effect of rotational speed and temperature
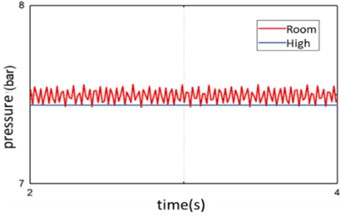
For 1800 r/min, 2000 r/min and 2220 r/min three states, the results of the mainly observe pressure fluctuation at the inlet of pressure limiting valve are shown in Fig. 6. The pressure fluctuation diagram shows that: when the engine speed increases, the oil pressure in the oil passage also increases. When the speed reaches 2200 r/min, the pressure fluctuation is obvious, the valve is open and regulated, resulting in strong pressure fluctuations.
For the engine oil temperature of 26 ℃ and 95 ℃, speed of 2200 r/min, the simulation results mainly observe the pressure fluctuation at the inlet of the pressure limiting valve are shown in the Fig. 7. At the same engine speed, the higher the temperature, the lower the viscosity of the engine oil, and the system oil pressure is lower. On high temperature conditions, the system oil pressure is low, the pressure limiting valve is not opened, and there is no flow rate change at the pressure limiting valve. On normal temperature conditions, there is obvious pressure fluctuation.
Fig. 6Pressure fluctuation diagram
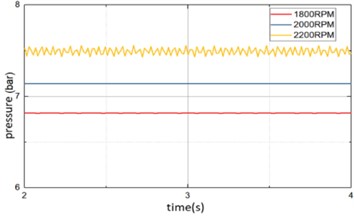
Fig. 7Pressure fluctuation at 2200 r/min
4. Optimization and effects
Through 1D analysis of lubricating oil system, it can be seen that the pressure fluctuation is easily caused by opening and adjusting the pressure limiting valve in lubricating oil system, and abnormal noise is easy to occur in lubricating oil system at normal temperature. Combined with lubrication oil system three-dimensional analysis, in order to avoid excessive impact on lubrication oil system, the oil pipeline optimization. So the pressure fluctuation characteristics of observation points are taken as physical quantities for evaluation of simulation results, and effective optimization designs are sought by comparing pressure fluctuation characteristics.
Fig. 8Pressure fluctuation at observation point 1 and point 5
4.1. Three-dimensional analysis of original design
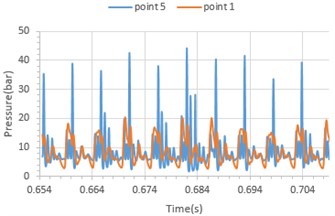
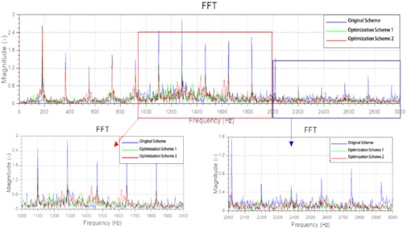
Pumplinx is used to simulate the lubrication pipeline, and the boundary conditions are the same as 1D simulation. When the engine speed is 2200 RPM and the oil temperature is low, The CFD analysis is carried out to solve the problem of obvious “sizzling” noise. The simulation results shown in Fig. 8. Because the observation point 5 is close to the pressure limiting valve, the fluctuation amplitude is prominent due to the influence of valve opening and closing.
4.2. Optimization
In this paper, we combine product design to determine the allowable range of dimensional parameters. Then divide these parameters according to a certain size gradient and combine them with other divided parameters. The structure optimization of lubricating oil system is carried out by changing the diameter of oil pump outlet pipe, deepening the depth of oil pump outlet groove and adding cavity structure in oil pump outlet pipe. We have chosen two effective solutions to showcase for engineering feasibility. The specific design is shown in Fig. 9 and Table 2.
Fig. 9Pipeline structure diagram
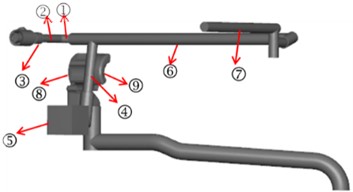
Table 2Optimization design
Case | 1) pipe diameter | 2) pipe diameter | 3) length | 4) pipe diameter | 5) with or without | 6) pipe diameter | 7) pipe diameter | 8) depth | 9) depth |
Original | 11.5 | 11.5 | 15.3 | 16 | no | 16 | 14 | / | / |
Optimization 1 | +7.5 | +7.5 | unchanged | –2 | yes | +3 | +5 | +5 | +3 |
Optimization 2 | +7.5 | +7.5 | unchanged | –2 | yes | +3 | +5 | unchanged | unchanged |
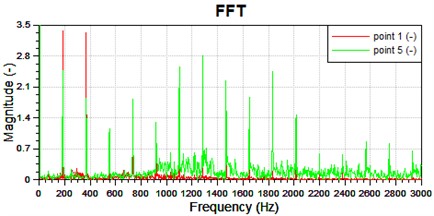
Compared with the original design and the optimized design, the optimized design is better than the original design, that is, adjusting the pipe diameter properly and improving the cavity structure are helpful to reduce the pressure fluctuation in the lubricating oil path. From the simulation results shown in Fig. 10 and Fig. 11, the amplitude fluctuation of optimization design 1 is the smallest, and the effect is better than that of optimization design 2, that is, increasing the depth of oil pump outlet groove helps to reduce the pressure fluctuation in lubricating oil path.
Fig. 10Pressure fluctuation spectrum of point 1
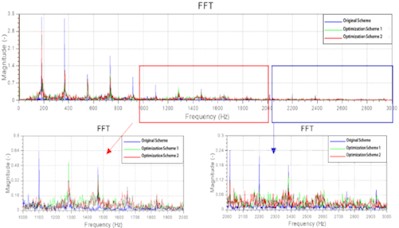
Fig. 11Pressure fluctuation spectrum of point 5
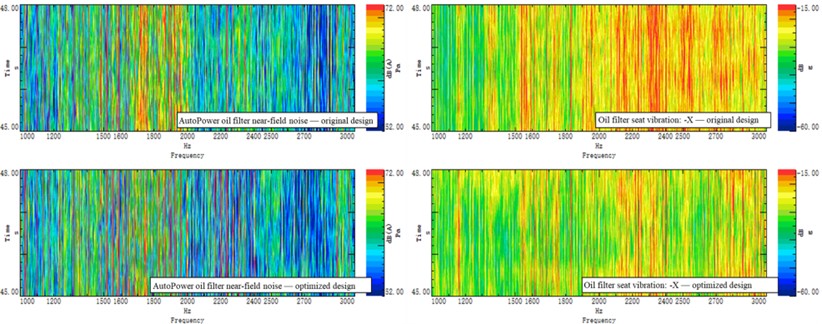
According to the measurements of optimization design I, samples are made and verified by experiments. The test results are shown in Fig. 12. The left column of Fig. 12 shows the near-field noise test results of the oil filter, the optimization scheme achieved significant reduction in the frequency range of 1500 Hz to 2700 Hz, especially in the frequency range of 1600 Hz to 2100 Hz, where the sound reduction was particularly noticeable. The right column of Fig. 12 shows the vibration test results of the oil filter, and the optimized scheme has been effectively improved in the frequency range of 1500 Hz to 2700 Hz. The subjective evaluation is consistent with the experimental test results, and the problem noise has significantly improved.
Fig. 12Validation results of optimization design 1
5. Conclusions
This article adopts a combination of one-dimensional and three-dimensional methods, and creatively considers the influence of the pump oil dynamic characteristics of the oil pump and the dynamic impact characteristics of the pressure relief valve on the lubrication system.
1) The relative error of oil pressure between the calculated and the test for abnormal noise of the lubricating oil circuit system analysis model is about 5 %, which meets the requirements. And the results shows that: The pressure fluctuation in the lubricating oil circuit will be caused by the opening and closing of the pressure limiting valve, and then the abnormal noise will occur.
2) Analysis of pressure fluctuation in the pipe under different working conditions, the speed increases, the oil pressure in the pipeline increases, and the pressure fluctuation occurs after the pressure limiting valve is opened, that is, the speed is an important factor affecting the pressure fluctuation of the pipeline; when the speed is the same, with the increase of temperature, the oil pressure decreases (too small is not conducive to the formation of lubricating oil film), the pressure limiting valve is not opened, and there is almost no pressure fluctuation in the pipe.
3) Optimizing the structure of lubricating oil circuit through 3D simulation, adjusting the diameter of pipeline properly, improving the cavity structure and increasing the depth of groove at the outlet of oil pump are helpful to reduce the pressure fluctuation in lubricating oil circuit. According to the optimization, the experiment proves that the optimization design is effective.
References
-
J. W. Li, J. W. Shen, and Y. Liu, “Study on low frequency oil pressure fluctuation of diesel engine lubrication system,” Internal Combustion Engine Engineering, Vol. 43, No. 5, pp. 100–108, 2022.
-
J. Y. Zhou, Q. W. Zhu, and J. Liu, “Mechanism analysis and suppression method of pressure fluctuation in lubricating oil pipeline,” Guangdong Shipbuilding, Vol. 38, No. 6, pp. 78–80, 2019.
-
E. Lisowski, G. Filo, and J. Rajda, “Pressure compensation using flow forces in a multi-section proportional directional control valve,” Energy Conversion and Management, Vol. 103, pp. 1052–1064, Oct. 2015, https://doi.org/10.1016/j.enconman.2015.07.038
-
X. G. Wang and K. W. Ye, “Pressure pulsation analysis of lubricating oil system based on Flowmaster,” Mechanical Research and Applications, Vol. 30, No. 4, pp. 33–35, 2017.
About this article
The authors have not disclosed any funding.
The datasets generated during and/or analyzed during the current study are available from the corresponding author on reasonable request.
The authors declare that they have no conflict of interest.
