Abstract
In order to predict the impact of sulfate corrosion on concrete, based on grey system theory, GM(1,1) and GM(1, N) models were used to predict and analyze the compressive strength and relative dynamic elastic modulus of concrete under sulfuric acid corrosion. The results show that the prediction error of the GM(1,1) model for concrete sulfate corrosion attenuation is within 5 %, and the residual size test of the GM(1, N) model for concrete sulfate corrosion is within 10 %.
1. Introduction
Grey system theory [1] predicts the development of prediction samples with a small number of samples, and has good predictions for systems with small samples and more unknown information. Recent studies have further demonstrated the versatility and accuracy of grey models in concrete research. For example, Zheng Chuanlei et al. [2] analyzed and predicted the relative elastic modulus of fiber-reinforced recycled aggregate concrete under freeze-thaw conditions using the GM(1,1) model, showing that when the recycled aggregate replacement rate exceeds 50 % (by mass), its impact on concrete frost resistance becomes minimal, with a prediction accuracy of first-order. Bao et al. [3] employed the GM(1,1) model to simulate the durability of sisal fiber concrete in marine environments, finding that the relative residual error between predicted and experimental values was small, indicating that the model can reliably predict concrete lifespan. Zhang et al. [4] developed a GM(1,3) prediction model for the compressive strength of white dense concrete using pore structure parameters, with an average error of less than 10 % between predicted and experimental values, highlighting the significant influence of pore structure on the mechanical properties of concrete. Feng Zhongju et al. [5] used the GM(1,1) model to predict the durability of concrete in high-cold salt marsh regions, achieving a prediction error of less than 6 %, with a low-probability error of under 5 %, demonstrating high prediction accuracy. Gao Zhe et al. [6] studied the impact of initial stress damage on the durability of lightweight aggregate concrete using the GM(1,1) model and performed lifespan predictions, concluding that the model provides first-order prediction accuracy and can quantitatively evaluate the frost resistance of lightweight aggregate concrete after catastrophic events. The GM (1, N) model was constructed using significantly correlated influencing factors so that the grey system model has no requirements for the quantity of experimental data, and is suitable for predicting the corrosion life of multiple types of concrete. This article predicts the evaluation indicators of concrete after sulfuric acid corrosion based on the GM(1,1) model and GM(1, N) model.
2. GM(1,1) model prediction
2.1. Establishment of GM (1,1) model
The establishment of a grey system model primarily encompasses the processes of data verification and preprocessing, model selection, model parameter estimation, model accuracy testing, and the evaluation of prediction accuracy. The general steps for modeling are illustrated in Fig. 1.
Fig. 1Modeling Steps

2.2. GM(1,1) model verification
When the accuracy of the GM(1,1) model does not meet the requirements, the residual sequence can be used to establish the residual GM(1,1) model and modify the original model to improve accuracy.
2.3. GM(1,1) model prediction of compressive strength of sulfuric acid corroded concrete
Sulfuric acid corroded concrete was calculated and analyzed by writing MATLAB program. Taking A7, A2, and A8 as examples, predicting the decay rate of the GM(1,1) model can obtain parameters [, ] through calculation:
[, ]A7= [0.046313,1.036371];
[, ]A2= [0.025404,1.075179];
[, ]A8= [0.012389,1.052259].
The prediction formula can be obtained:
Fig. 2 depicts the degradation of concrete at different ages due to sulfuric acid corrosion. According to Table 1 [8] and Fig. 3, it can be seen that the GM(1,1) model is suitable for predicting the attenuation of concrete sulfuric acid corrosion. The ratio of calculated values to experimental values is around 1, with an error of no more than 5 %.
Fig. 2Degradation of concrete at different ages due to sulfuric acid corrosion
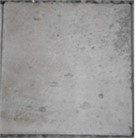
a) 15 d
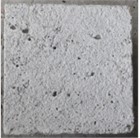
b) 30 d
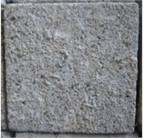
c) 60 d
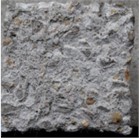
d) 90 d
Fig. 3Comparison of experimental and calculated values
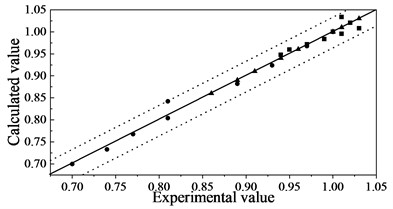
Table 1Comparison of calculated concrete compressive strength results with experimental data
Time / d | EV A7 | EV A2 | EV A8 | CV A7 | CV/EV A7 | CV A2 | CV/EV A2 | CV A8 | CV/EV A8 |
0 | 1 | 1 | 1 | 1.00 | 1.00 | 1.00 | 1.00 | 1.00 | 1.00 |
15 | 0.97 | 1.01 | 1.01 | 0.97 | 1.04 | 1.03 | 1.00 | 1.03 | 1.02 |
30 | 0.93 | 1.03 | 1.02 | 0.92 | 1.01 | 1.02 | 0.99 | 0.98 | 1.00 |
45 | 0.89 | 1 | 1.03 | 0.88 | 0.99 | 1.01 | 0.99 | 0.99 | 0.98 |
60 | 0.81 | 0.96 | 1.01 | 0.84 | 0.96 | 1.00 | 1.04 | 1.00 | 0.99 |
75 | 0.80 | 0.94 | 0.99 | 0.80 | 0.94 | 0.98 | 0.99 | 1.00 | 0.99 |
90 | 0.77 | 0.91 | 0.97 | 0.77 | 0.91 | 0.97 | 1.00 | 1.00 | 1.00 |
105 | 0.74 | 0.89 | 0.95 | 0.73 | 0.89 | 0.96 | 0.99 | 1.00 | 1.01 |
120 | 0.70 | 0.86 | 0.94 | 0.70 | 0.87 | 0.95 | 1.00 | 1.01 | 1.01 |
Average | 1.01 | 1.00 | 1.01 | ||||||
C | 0.12 | 0.35 | 0.22 |
2.4. Prediction of relative dynamic elastic modulus of concrete subjected to sulfuric acid corrosion using GM(1,1) model
Taking A7, A2, and A8 as examples, predicting the relative dynamic elastic modulus of GM(1,1) model can obtain parameters [, ] through calculation:
[, ]A7= [0.042215, 1.045150];
[, ]A2= [0.025141, 1.084889];
[, ]A8= [0.013419, 1.070685].
The prediction formula can be obtained:
From Table 1 and Fig. 4, it can be seen that the GM(1,1) model is suitable for predicting the relative dynamic elastic modulus of sulfuric acid corroded concrete. The ratio of calculated values to experimental values is around 1, with an error of no more than 5 %.
Fig. 4Comparison between experimental and calculated value
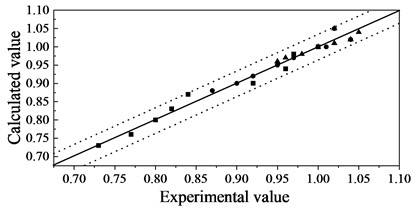
Table 2Comparison of calculated relative dynamic elastic modulus values with experimental results
Time / d | EV A7 | EV A2 | EV A8 | CV A7 | CV/EV A7 | CV A2 | CV/EV A2 | CV A8 | CV/EV A8 |
0 | 1 | 1 | 1 | 1.00 | 1.00 | 1.00 | 1.00 | 1.00 | 1.00 |
15 | 0.97 | 1.02 | 1.02 | 0.98 | 1.01 | 1.05 | 1.03 | 1.05 | 0.97 |
30 | 0.96 | 1.04 | 1.05 | 0.94 | 0.98 | 1.02 | 0.98 | 1.04 | 1.01 |
45 | 0.92 | 1.01 | 1.04 | 0.90 | 0.98 | 1.00 | 0.99 | 1.02 | 1.02 |
60 | 0.84 | 0.97 | 1.02 | 0.87 | 1.03 | 0.97 | 1.00 | 1.01 | 1.01 |
75 | 0.82 | 0.95 | 1.00 | 0.83 | 1.01 | 0.95 | 1.00 | 1.00 | 1.00 |
90 | 0.80 | 0.92 | 0.98 | 0.80 | 0.99 | 0.92 | 1.00 | 0.98 | 1.00 |
105 | 0.77 | 0.9 | 0.96 | 0.76 | 0.99 | 0.90 | 1.00 | 0.97 | 0.99 |
120 | 0.73 | 0.87 | 0.95 | 0.73 | 1.00 | 0.88 | 1.01 | 0.96 | 0.99 |
Average | 1.01 | 1.00 | 0.99 | ||||||
C | 0.14 | 0.22 | 0.32 |
3. GM(1,N) model prediction
3.1. GM(1,N) model
The GM(1,1) model only considers the variation rule of a variable under the single factor of time. If the influence of multiple variables is to be taken into account, the GM(1,N) model needs to be used. The GM(1,N) model can be employed to describe first-order, multivariable linear dynamic changes, with its input variables being the N-dimensional correlated influencing factors and the time series of the prediction object.
3.2. Grey relational analysis theory
The measure of the correlation between two system elements over time or other objects is called the degree of correlation. Grey correlation analysis is a method of measuring the correlation between two factors based on the similarity of their development trends. It is suitable for quantitative measurement of system change trends.
3.2.1. Grey correlation degree calculation
1)The reference sequence of system behavior and the corresponding control sequence that affects its behavior:
where, is the numerical value of each indicator years used for calculating the correlation coefficient.
2) Data transformation:
where, is 1, 2,..., .
3) Relevance:
where, is 1, 2,..., , and is 1, 2,..., .
4) The magnitude and significance of correlation degree.
The degree of correlation indicates the closeness of the relationship between the subsequence and the parent sequence. If , the closeness of the relationship between subsequence 1 and the parent sequence is greater than that between subsequence 2 and the parent sequence.
3.3. GM(1,N) model prediction of compressive strength of concrete after sulfuric acid corrosion
3.3.1. Calculation of correlation degree
is the sequence of concrete compressive strength, is the sequence of corrosion time, is the sequence of sulfuric acid pH value, is the sequence of water cement ratio, and is the sequence of fly ash content.
Standardize the sequence to obtain standardized sequences = (0.985, 0.985,..., 0.926), = (0, 0.125,..., 1), = (0.67, 0.67,..., 1), = (0.8, 0.8,..., 0.8), = (0.33, 0.33,..., 0.33). The calculation of the degree of incidence based on grey theory is presented in Table 3.
It can be seen that the order of importance of the influencing factors is > > > . The gray correlation between sulfuric acid pH value and concrete compressive strength is the highest, indicating that sulfuric acid pH value has the greatest impact on concrete compressive strength among these four influencing factors; The grey correlation between corrosion time and concrete compressive strength is the smallest, indicating that corrosion time has the minimal impact on concrete compressive strength among these four influencing factors.
Table 3Grey correlation degree
Project | ||||
Grey correlation degree | 0.5644 | 0.8065 | 0.5846 | 0.7799 |
3.3.2. GM(1,N) model prediction
Calculate the parameter a [–0.5924, –0.0028, 0.0692,0.07, –1.1786] using the Matlab program, and calculate X. The residual size test was used with 7.1 %, which meets the requirements.
Prediction of relative dynamic elastic modulus of concrete after sulfuric acid corrosion using GM (1, N) model.
3.3.3. Calculation of correlation degree
is the sequence of relative dynamic elastic modulus of concrete, is the sequence of corrosion time, is the sequence of sulfuric acid pH value, is the sequence of water cement ratio, and is the sequence of fly ash content. Standardize the sequence to obtain standardized sequences = (0.935, 0.955,..., 0.877), = (0, 0.125,..., 1), = (0.67, 0.67,..., 1), = (0.8, 0.8,..., 0.8), = (0.33, 0.33,..., 0.33). The calculation of the degree of incidence based on grey theory is presented in Table 4 [9].
Table 4Grey correlation degree
Project | ||||
Grey correlation degree | 0.5644 | 0.7802 | 0.5753 | 0.7785 |
It can be seen that the order of importance of the influencing factors is > > > . The grey correlation between the pH value of sulfuric acid and the relative dynamic elastic modulus of concrete is the highest, indicating that the pH value of sulfuric acid has the greatest impact on the relative dynamic elastic modulus of concrete among these four influencing factors; The grey correlation between corrosion time and the relative dynamic elastic modulus of concrete is the smallest, indicating that corrosion time has the minimal impact on the relative dynamic elastic modulus of concrete among these four influencing factors.
3.3.4. GM(1,N) model prediction
Calculate the parameter a [–0.4719, –0.0032, 0.0757, 0.0111, –0.8809] using Matlab program, and calculate . The residual size test was used with 6.9 %, which meets the requirements.
4. Conclusions
This article analyzes the changes in the sulfuric acid corrosion performance of concrete through grey theory, and the specific conclusions are as follows:
1) A prediction model for evaluating the performance of concrete after sulfuric acid corrosion was proposed based on grey theory, and the prediction model is in good agreement with experimental values.
2) Through correlation analysis, it is pointed out that the pH value of sulfuric acid has a significant impact on the neutralization depth and compressive strength decay rate of concrete. The influence of fly ash content on the compressive strength decay rate is similar to that of water cement ratio.
References
-
P. P. Xu and J. B. Ding, “Application of grey system theory in project management general contracting,” (in Chinese), Design of Water Resources and Hydroelectric Engineering, Vol. 41, No. 4, pp. 35–38, 2022.
-
C. L. Zheng, S. X. Li, and C. K. Sun, “Freeze-thaw damage and life prediction of fiber recycled coarse aggregate concrete,” (in Chinese), China Measurement and Test, Vol. 50, No. 3, pp. 29–36, 2024.
-
H. Bao, H. Meng, W. You, and F. Qin, “Study on the corrosion resistance of sisal fiber concrete in marine environment,” SN Applied Sciences, Vol. 1, No. 12, pp. 1–6, Nov. 2019, https://doi.org/10.1007/s42452-019-1551-8
-
S. Y. Zhang et al., “Grey model study on strength and pore structure of self-compacting concrete with different aggregates based on NMR,” Journal of Building Engineering, Vol. 64, p. 10556, 2023.
-
Z. J. Feng, S. X. Chen, and H. Xu, “Durability evaluation of concrete in alpine salt marsh area based on gray system theory,” (in Chinese), Journal of Traffic and Transportation Engineering, Vol. 18, No. 3, pp. 18–26, 2018.
-
C. Gao, X. Z. Kong, and X. D. Shen, “Freeze-thaw resistance evaluation of lightweight aggregate concrete with stress damage based on GM(1,1),” (in Chinese), Advanced Engineering Sciences, Vol. 53, No. 4, pp. 184–190, 2021.
-
Y. Lv, D. Niu, X. Liu, M. Lin, and Y.-C. Li, “Corrosion damage and life prediction of concrete structure in the coking ammonium sulfate workshop of iron and steel industry,” Springer Science and Business Media LLC, Scientific Reports, Feb. 2023.
-
M. Q. Lin et al., “Experimental research on shear behavior of reinforced concrete beams subjected to sulfuric acid corrosion,” (in Chinese), Industrial Construction, Vol. 49, No. 6, pp. 7–13, 2019.
-
M. Q. Lin, “Study on degradation law of material and structural properties of concrete corroded by sulfuric acid,” Xian University of Architecture and Technology, 2018.
About this article
This work was financially supported by Shandong province institution (2019GSF111050) and Key research and development project of Doctoral foundation of University of Jinan (XBS1820) and Science and technology project of University of Jinan (W2022186).
The datasets generated during and/or analyzed during the current study are available from the corresponding author on reasonable request.
The authors declare that they have no conflict of interest.
