Abstract
The paper represents numerical and experimental investigation of ultrasonic piezoelectric transducer which operation is based on three different vibration modes. Multi-frequency operation of the transducer allows to obtain sound pressure fields with different patterns, sound fields intensities and frequencies which allows to obtain more flexible and adjustable agglomeration process of fine and ultrafine. Results of numerical investigations have shown that vibration modes of transducer at 25.83 kHz, 34.73 kHz and 52.41 kHz frequencies are suitable for acoustic pressure generation. Moreover, the calculations revealed that at these frequencies sound pressure levels (SPL) reaches up to 142 dB while SPL patterns at different frequencies are different. Experimental investigations have confirmed results of numerical investigations and showed that resonant frequencies of transducer are at 25.65 kHz, 31.1 kHz, 50.8 kHz while SPL values reaches up to 132.5 dB.
1. Introduction
Air pollution by fine and ultrafine particles is a major health concern in heavily industrialized and urbanized areas. These particles, which are produced by burning fossil fuels, contribute to numerous diseases and organ damage. Conventional air filtering systems like cyclone separators, fibrous filters, and electrostatic precipitators are not effective at capturing these fine particles [1]. To improve the efficiency of these filters, pretreatment of fine and ultrafine particles is necessary. Ultrasonic acoustic agglomeration is a promising solution, using high-frequency and high-intensity acoustic fields to agglomerate these particles through orthokinetic or acoustic wake effects. This process allows air filtering systems to become more effectively capture the resulting particle agglomerates [2].
Guo et al. reported on a transducer used to induce an acoustic field for fire smoke particles agglomeration [3]. The acoustic pressure source, based on a piezoelectric transducer and a cone-shaped concentrator. Amplified displacements are transferred to a disc-shaped radiator. Numerical and experimental investigations indicated that the operating frequency of the acoustic pressure source was 15 kHz, producing up to 146 dB SPL. The study found that the agglomeration process, driven mainly by the acoustic wake effect, significantly impacted smoke particle agglomeration.
Selicani and Buiochi reported on a stepped-plate ultrasonic transducer for acoustic pressure generation [4]. This transducer utilized a Langevin transducer with a stepped booster and a stepped plate mounted on top. The device converts Langevin longitudinal displacements into flexural vibrations of the stepped plate. Numerical and experimental investigations revealed an operating frequency of 22.35 kHz, achieving up to 122 dB SPL. The results indicated that the stepped plate produced modified acoustic field patterns, potentially enhancing the agglomeration process.
Ultrasonic acoustic pressure sources typically operate at a fixed frequency, resulting in a single SPL pattern. However, as particle size and concentration change over time, their agglomeration efficiency varies [5]. Therefore, a fixed frequency ensures proper agglomeration only under specific conditions. To maintain efficient agglomeration considering changes in particle size, concentration, and motion speed, the acoustic pressure source must operate at multiple frequencies and generate different SPL patterns.
This paper presents the results of numerical and experimental investigations on an ultrasonic acoustic pressure source designed for the acoustic agglomeration of fine and ultrafine particles. Compared to state of art, the proposed ultrasonic acoustic pressure source stands out by its possibility to operate at three different resonance frequencies and as a result generate three different acoustic pressure fields with different frequencies and pressure distribution patterns which allows to affect different sizes of particles. So, such flexibility allows to adjust the SPL field to changes in particle size, concentration, and motion speed. Additionally, the multi-frequency operation enables switching between frequencies, facilitating semi or fully automatic control of the acoustic agglomeration process.
2. Design and operation principle of acoustic pressure source
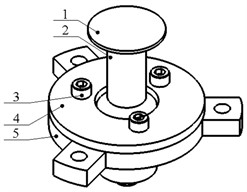
Acoustic pressure source is based on Langevin transducer, disc shaped radiator and clamping plates. The Langevin transducer is composed from stepped horn made of high-grade aluminum, two piezoelectric rings made of hard piezoelectric material, back end and pre-compressing bolt made of stainless steel. The bolt is used to assembly the Langevin to one structure while disc shaped radiator, made of high-grade aluminum, is placed on top of the horn. Clamping of the transducer is implemented via clamping ring which is formed at the horn. The clamping ring is placed between two clamping plates made of polylactide plastic (PLA) while clamping force is applied via three bolts which holds the clamping plates and Langevin transducer together. The design of the acoustic pressure source as well as it excitation schematics are given in Fig. 1.
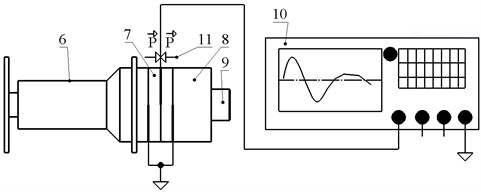
Fig. 1Schematics of ultrasonic acoustic pressure source; 1 – acoustic pressure radiator; 2 – Langevin transducer; 3 – clamping bolts; 4 – top part of clamping ring; 5 – bottom part of clamping ring; 6 – horn; 7 – piezoelectric rings; 8 – back end; 9 – pre-compressing bolt; 10 – excitation signal generator and its amplifier; 11 – polarization direction
a) Isometric view
b) Excitation schematics
As shown in Fig. 1(a), the longitudinal displacements of the Langevin transducer are amplified by a stepped horn with a 2.4 amplification ratio and transferred to a disc-shaped radiator. This radiator converts the longitudinal vibrations into bending vibrations, generating acoustic pressure fields. Different bending modes of the radiator create acoustic pressure at different frequencies with different patterns and SPL levels. The stepped design of the disc reduces its thickness, increasing displacement amplitudes and enhancing acoustic pressure levels through different bending deformations.
Therefore, operation of the ultrasonic acoustic pressure source relays on excitation of Langevin transducer by harmonic excitation signal. Frequency of excitation signal shall be in coincidence with one of resonance frequencies which are used for its operation. Excitation schematics is given in Fig. 1(b). As can be found in the Figure, generation of ultrasonic acoustic pressure is implemented by single signal which is generated and amplified by integrated signal generator and amplifier. So, considering that ultrasonic acoustic pressure source will be operated at different vibration modes and during operation the acoustic pressure source should be switched between the modes such simple excitation schematics and integrated signal generation allows to adjust operation of it in automatic or semi-automatic regime considering to input and output concentrations of the particles as well as to efficiency of agglomeration process.
3. Numerical investigation of acoustic pressure source
Numerical investigations were performed to verify multi-frequency operation of ultrasonic acoustic pressure source as well as indicate its electromechanical and acoustical characteristics. For this purpose, numerical model was built by COMSOL Multiphysics with the following conditions – horn and disc shaped radiator were set as made of Aluminum alloy 6061 T6, back end and pre-compression bolt were set as made of stainless steel DIN 1.4301 while piezoceramic rings were set as made of PI Ceramics PIC181. Electrical boundary conditions were set as it is given in Fig. 1(b) while fixed boundary condition was set to clamping ring which is located at the horn. Finally, on top of the disc shaped radiator was placed cylindrical air volume with initial pressure of 101 kPa and temperature of 23 °C.
Therefore, the first stage of numerical investigation was dedicated to indication of vibration modes and their natural frequencies which are suitable for acoustic pressure generation. For this purpose, modal analysis of the ultrasonic acoustic pressure source was set up. Results of calculations are given in Fig. 2.
Fig. 2Modal shapes of ultrasonic acoustic pressure source
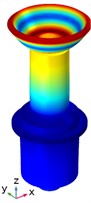
a) The first modal shape at 25.82 kHz
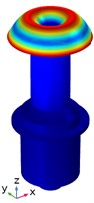
b) The second modal shape at 32.71 kHz
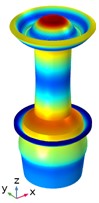
c) The third modal shape at 52.42 kHz
So, Fig. 2 shows that vibration modes indicated at 25.82 kHz, 32.71 kHz and 52.42 kHz natural frequencies are suitable for acoustic pressure generation while longitudinal displacements of Langevin transducer are converted to bending vibrations of the disc shaped radiator. Moreover, it can be found that vibration modes of the disc shaped radiator have different shapes which confirms assumption generate acoustic pressure with different patterns intensities and frequencies.
Next stage of numerical investigation was set to indication of impedance and phase frequency characteristics of the ultrasonic acoustic pressure source. For this purpose, frequency domain study was set up for each vibration mode. The results of calculations are given in Fig. 3.
Fig. 3 shows that the calculated impedance and phase frequency characteristics confirm the modal analysis results, with resonance frequencies at 25.83 kHz, 34.73 kHz, and 52.41 kHz for all three vibration modes. Minor mismatches, due to the discrete calculation steps, are less than 0.5 % and do not significantly impact the results. Also, effective coupling coefficient () was calculated for each vibration mode and reached 0.172, 0.095 and 0.312, respectively. Therefore, these results indicated resonance frequencies of ultrasonic acoustic source and have showed it suitability for acoustic pressure generation.
Fig. 3Impedance and phase frequency characteristics of ultrasonic acoustic pressure source
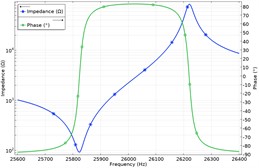
a) Characteristics of the first vibration mode
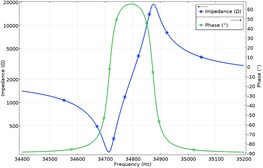
b) Characteristics of the second vibration mode
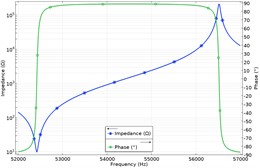
c) Characteristics of the third vibration mode
The next stage of numerical investigation aimed to indicate sound pressure levels (SPL) values as well as patterns of acoustic fields while ultrasonic acoustic pressure source is excited by harmonic signal which amplitude is 100 Vp-p. For this purpose, frequency domain study, for each resonance frequency case separately, with piezoelectric – acoustic – structural multiphysics interaction was used. Boundary conditions for acoustic pressure propagation medium were set as follows: initial pressure was set to 101.32 kPa while temperature to 22 °C. Results of calculations are given in Fig. 4.
Fig. 4Sound pressure levels (SPL) while harmonic signal used to drive ultrasonic acoustic pressure source
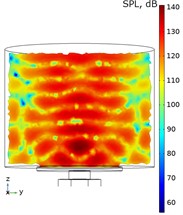
a) At 25.83 kHz
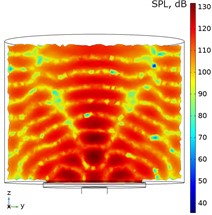
b) At 34.73 kHz
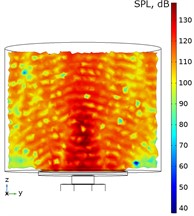
c) At 52.41 kHz
Fig. 4 demonstrates that operation at different resonance frequencies the acoustic source create different patterns of acoustic fields pressures which corresponds to the vibration modes of a disc-shaped radiator. During analysis of the patterns can be found that frequency, distribution of high- and low-pressure regions as well as intensity levels at all three cases are different. So, different acoustic pressure patterns with different characteristics will strengthen orthokinetic or acoustic wake effects which will allow to increase efficiency of acoustic agglomeration process of particles with different sizes. At frequencies of 25.83 kHz, 34.73 kHz, and 52.41 kHz, the source maximum SPL values are 140.88 dB, 137.49 dB, and 139.12 dB, respectively, with a minor deviation of 1.38 dB. In order to fully define acoustical characteristics of the source maximum SPL values at different excitation signal amplitudes as well as sound power level (SWL) at 100 Vp-p were calculated. Results of calculations are given in Figure 5.
As Fig. 5(a) shows SPL maximum values at different frequencies and excitation signal amplitudes varies from 110 dB to 141 dB. Also, the SPL values at different frequencies have similar maximum values which shows that acoustic pressure source is able to ensure stable acoustic field at different frequencies. Fig. 5(b) shows that the source has similar sound power level at different frequencies which confirms it stable operation at these frequencies as well as proper acoustic pressure for agglomeration process.
Fig. 5Acoustic characteristics of the source
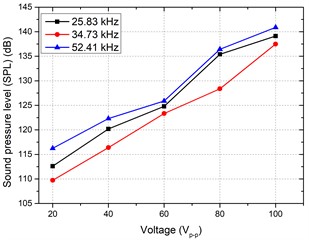
a) Maximum sound pressure levels at different excitation signal amplitudes
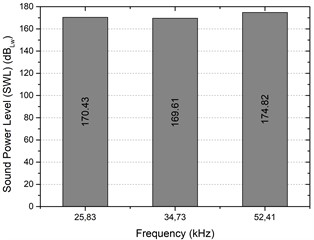
b) Sound power level at 100 Vp-p
4. Experimental investigation of acoustic pressure source
Experimental investigations were performed in order to confirm the acoustical and electro-mechanical characteristics of ultrasonic acoustic pressure source, validate its operation at different frequencies, and assess its acoustical characteristics. For this purpose, a prototype was made while view of prototype is given in Fig. 6.
So, during the first stage of experimental investigation impedance and phase frequency characteristics of prototype were measured. Results of measurements are given in Fig. 7.
Fig. 6Prototype of acoustic pressure source
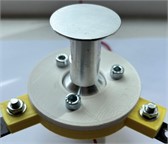
a) Top view
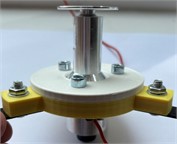
b) Side view
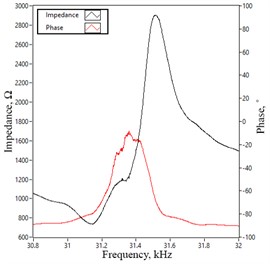
Fig. 7Impedance and phase frequency characteristics of transducer
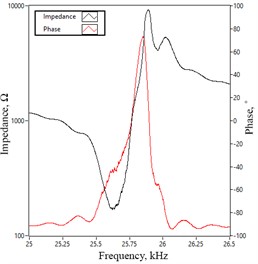
a) The first vibration mode
b) The second vibration mode
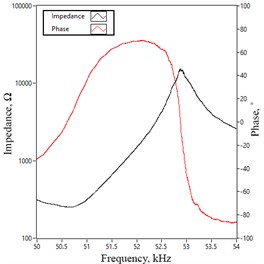
c) The third vibration mode
Fig. 7 shows that the resonance frequencies of the transducer's first, second, and third vibration modes are 25.65 kHz, 31.1 kHz, and 50.8 kHz, respectively. The highest difference between calculated and measured resonance frequencies is 10.45 % for the second vibration mode. In contrast, the differences for the first and third modes are 0.69 % and 3.07 %, respectively. Next stage of experimental investigation was dedicated to measure SPL and calculate SWL characteristics of the acoustic pressure source. Results of investigations are given in Fig. 8.
As Fig. 8(a) shows SPL maximum values at different frequencies and excitation signal amplitudes varies from 103 dB to 131 dB. Compare to results of numerical calculation measured values are lower by 10-15 % which is caused by measuring probe positioning error. Fig. 8(b) shows that the source has similar sound power level at different frequencies which confirms it stable operation at these frequencies. On the other hand, differences between measured and calculated values does not exceed 10 % which shows good potential of the acoustic pressure source.
Fig. 8Acoustic characteristics of the source
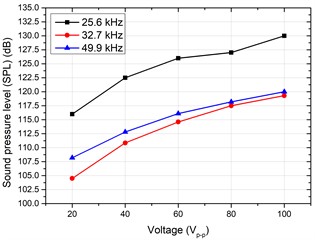
a) Maximum sound pressure levels at different excitation signal amplitudes
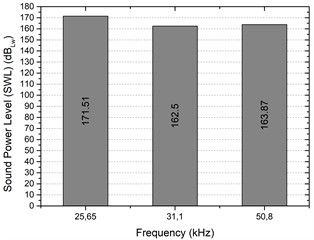
b) Sound power level at 100 Vp-p
5. Conclusions
Multi-frequency ultrasonic piezoelectric acoustic pressure source was developed and investigated. Results of investigations have showed that the acoustic pressure source is able to operate at three vibration modes at frequencies of 25.6 kHz, 32.7 kHz and 49.9 kHz and provide high acoustic pressure levels potentially suitable for acoustic agglomeration process. Moreover, numerical investigations have shown that the source is able, at these frequencies, generate three different SPL patterns. During experimental measurements maximum SPL values reached 131.2 dB, 119.6 dB and 121.6 dB at frequencies of 25.6 kHz, 32.7 kHz and 49.9 kHz, respectively. The results of SPL measurements have shown that the source is able provide similar pressure levels at all three resonance frequencies. Finally, indication of SWL values at 100 Vp-p excitation signal amplitude has shown that the pressure source is able provide similar sound power level at all three resonance frequencies.
References
-
R. Sharma, O. P. Kurmi, P. Hariprasad, and S. K. Tyagi, “Health implications due to exposure to fine and ultra-fine particulate matters: a short review,” International Journal of Ambient Energy, Vol. 45, No. 1, Dec. 2024, https://doi.org/10.1080/01430750.2024.2314256
-
C. Sioutas, M. M. Badami, R. Tohidi, M. Aldekheel, V. J. Farahani, and V. Verma, “Design, optimization, and evaluation of a wet electrostatic precipitator (ESP) for aerosol collection,” Atmospheric Environment, Vol. 308, May 2023, https://doi.org/j.atmosenv.2023.119858
-
Y. Guo, G. Zhang, Y. Li, H. Gu, D. Yuan, and M. Liu, “Study on aerosol agglomeration using the airborne ultrasonic transducer,” Particuology, Vol. 82, pp. 157–165, Nov. 2023, https://doi.org/10.1016/j.partic.2023.01.017
-
G. V. Selicani and F. Buiochi, “Stepped-plate ultrasonic transducer used as a source of harmonic radiation force optimized by genetic algorithm,” Ultrasonics, Vol. 116, p. 106505, Sep. 2021, https://doi.org/10.1016/j.ultras.2021.106505
-
E. Riera, I. González-Gómez, G. Rodríguez, and J. A. Gallego-Juárez, “Ultrasonic agglomeration and preconditioning of aerosol particles for environmental and other applications,” in Power Ultrasonics, Elsevier, 2023, pp. 861–886, https://doi.org/10.1016/b978-0-12-820254-8.00029-4
About this article

This research has received funding from the Research Council of Lithuania, agreement No. S-MIP-23-140.
The datasets generated during and/or analyzed during the current study are available from the corresponding author on reasonable request.
The authors declare that they have no conflict of interest.
