Abstract
In the detection of surface defects in underwater structures, traditional methods using manual diving are inefficient. Equipment such as underwater high-definition cameras and underwater laser imaging face significant signal attenuation in deep and turbid environments, and the information contained in two-dimensional sonar images is limited, making it difficult to meet accuracy requirements. To address these shortcomings, a detection method based on sonar imaging for underwater docks using three-dimensional (3D) reconstruction is proposed. This method first reduces environmental interference through preprocessing. Then, emit sound waves towards the underwater target and receive the returning signals, which are converted into digital signals. Next, perform 3D modeling and visualization. Finally, a detailed analysis of the 3D images is conducted to identify, analyze, and assess the severity and distribution patterns of defects. The experimental results show that the 3D scanning sonar imaging detection technology can effectively detect targets and accurately identify misalignment in caisson joints, meeting practical application requirements.
Highlights
- Develop a new type of 3D sonar measurement bracket, overcome the measurement blind spots caused by spatial constraints
- Underwater 3D scanning sonar accuracy assessments are conducted
- At the optimal detection distance of 0.9m-1.1m, a scanning resolution of 1cm can be achieved
- The combination of multi-beam depth sounding and 3D scanning sonar scanning technology achieves accurate measurements
- Innovative monitoring of key structures has been carried out by 3D sonar imaging, deepening the understanding of the health status of underwater engineering
1. Introduction
The foundational structures of wharf projects are submerged underwater, which makes it difficult to use of traditional terrestrial surveying techniques [1]. Post-construction, wharf projects are subject to erosion, settling, and other destructive forces such as currents, waves, and sediment [2]. Therefore, effective quality inspection of the foundation structures of wharf projects is essential [3]. In recent years, Dajun Zhang, Xuelin Peng et al. have proposed an emerging non-contact detection method: monitoring the vibration changes within dock structures to detect engineering defects, providing a new perspective for the quality assessment of underwater infrastructures [4, 5]. Gravity-based caissons wharf projects incorporate joints during design, which if not strictly adhered to during construction or are subject to settling, deformation, or damage during operation, pose significant risks to the wharf projects. Current technical methods for detecting underwater joints and other detailed structures include underwater visual inspection, underwater laser imaging, and underwater sonar imaging. Underwater visual inspection utilizes vision, underwater photography, or video recording for detection [6-8]. While the method is convenient, simple, and widely applicable, its effectiveness depends on the imaging quality of the camera and the professionalism of divers, with associated risks to personal safety. Underwater laser imaging employs laser scanning to analyze underwater structures, but due to severe laser scattering and significant energy loss in water, its detection range is limited, and imaging quality is compromised [9-11]. Underwater sonar imaging utilizes emitted and received sound waves for ranging and positioning, categorized as single-beam and multibeam sonars [12, 13]. Single-beam sonars have wider sound emission angles, resulting in relatively poor measurement accuracy; multibeam sonars simultaneously emit and receive multiple beams, including multibeam depth sounders, side-scan sonars, and three-dimensional imaging sonars [14-16]. The 3D imaging sonar system can quickly provide accurate measurements or judgments of underwater dock joints, even in a non-contact setting, due to its superior resolution and the fact that it is not affected by posture during fixed deployment. This makes it one of the advanced methods for detecting fine underwater structures [17-19].
3D sonar imaging technology has been applied more and more deeply in the field of underwater detection in the past 20 years. Yannik et al. [20], Abbas et al. [21], and Liang et al. [22] used artificial intelligence and data analytics to demonstrate how machine learning algorithms can be used to automate the parsing of 3D sonar imagery, enabling the automatic identification of underwater targets, and improving data accuracy. Avi et al. [23], and Shuai et al. [24] focused on the study of synthetic aperture sonar (SAS) technology, and introduced the progress of SAS technology in improving the quality of underwater imaging and the coverage area, especially in long-range high-definition imaging and wide field-of-view, which is a significant enhancement. Yu et al. [25], Boyu et al. [26], and Peng et al. [27] focused on the aspects of noise suppression and signal enhancement, discussed in depth the role of advanced filtering techniques in improving the signal-to-noise ratio of 3D sonar systems, and optimized the effect of signal transmission in complex underwater environments.
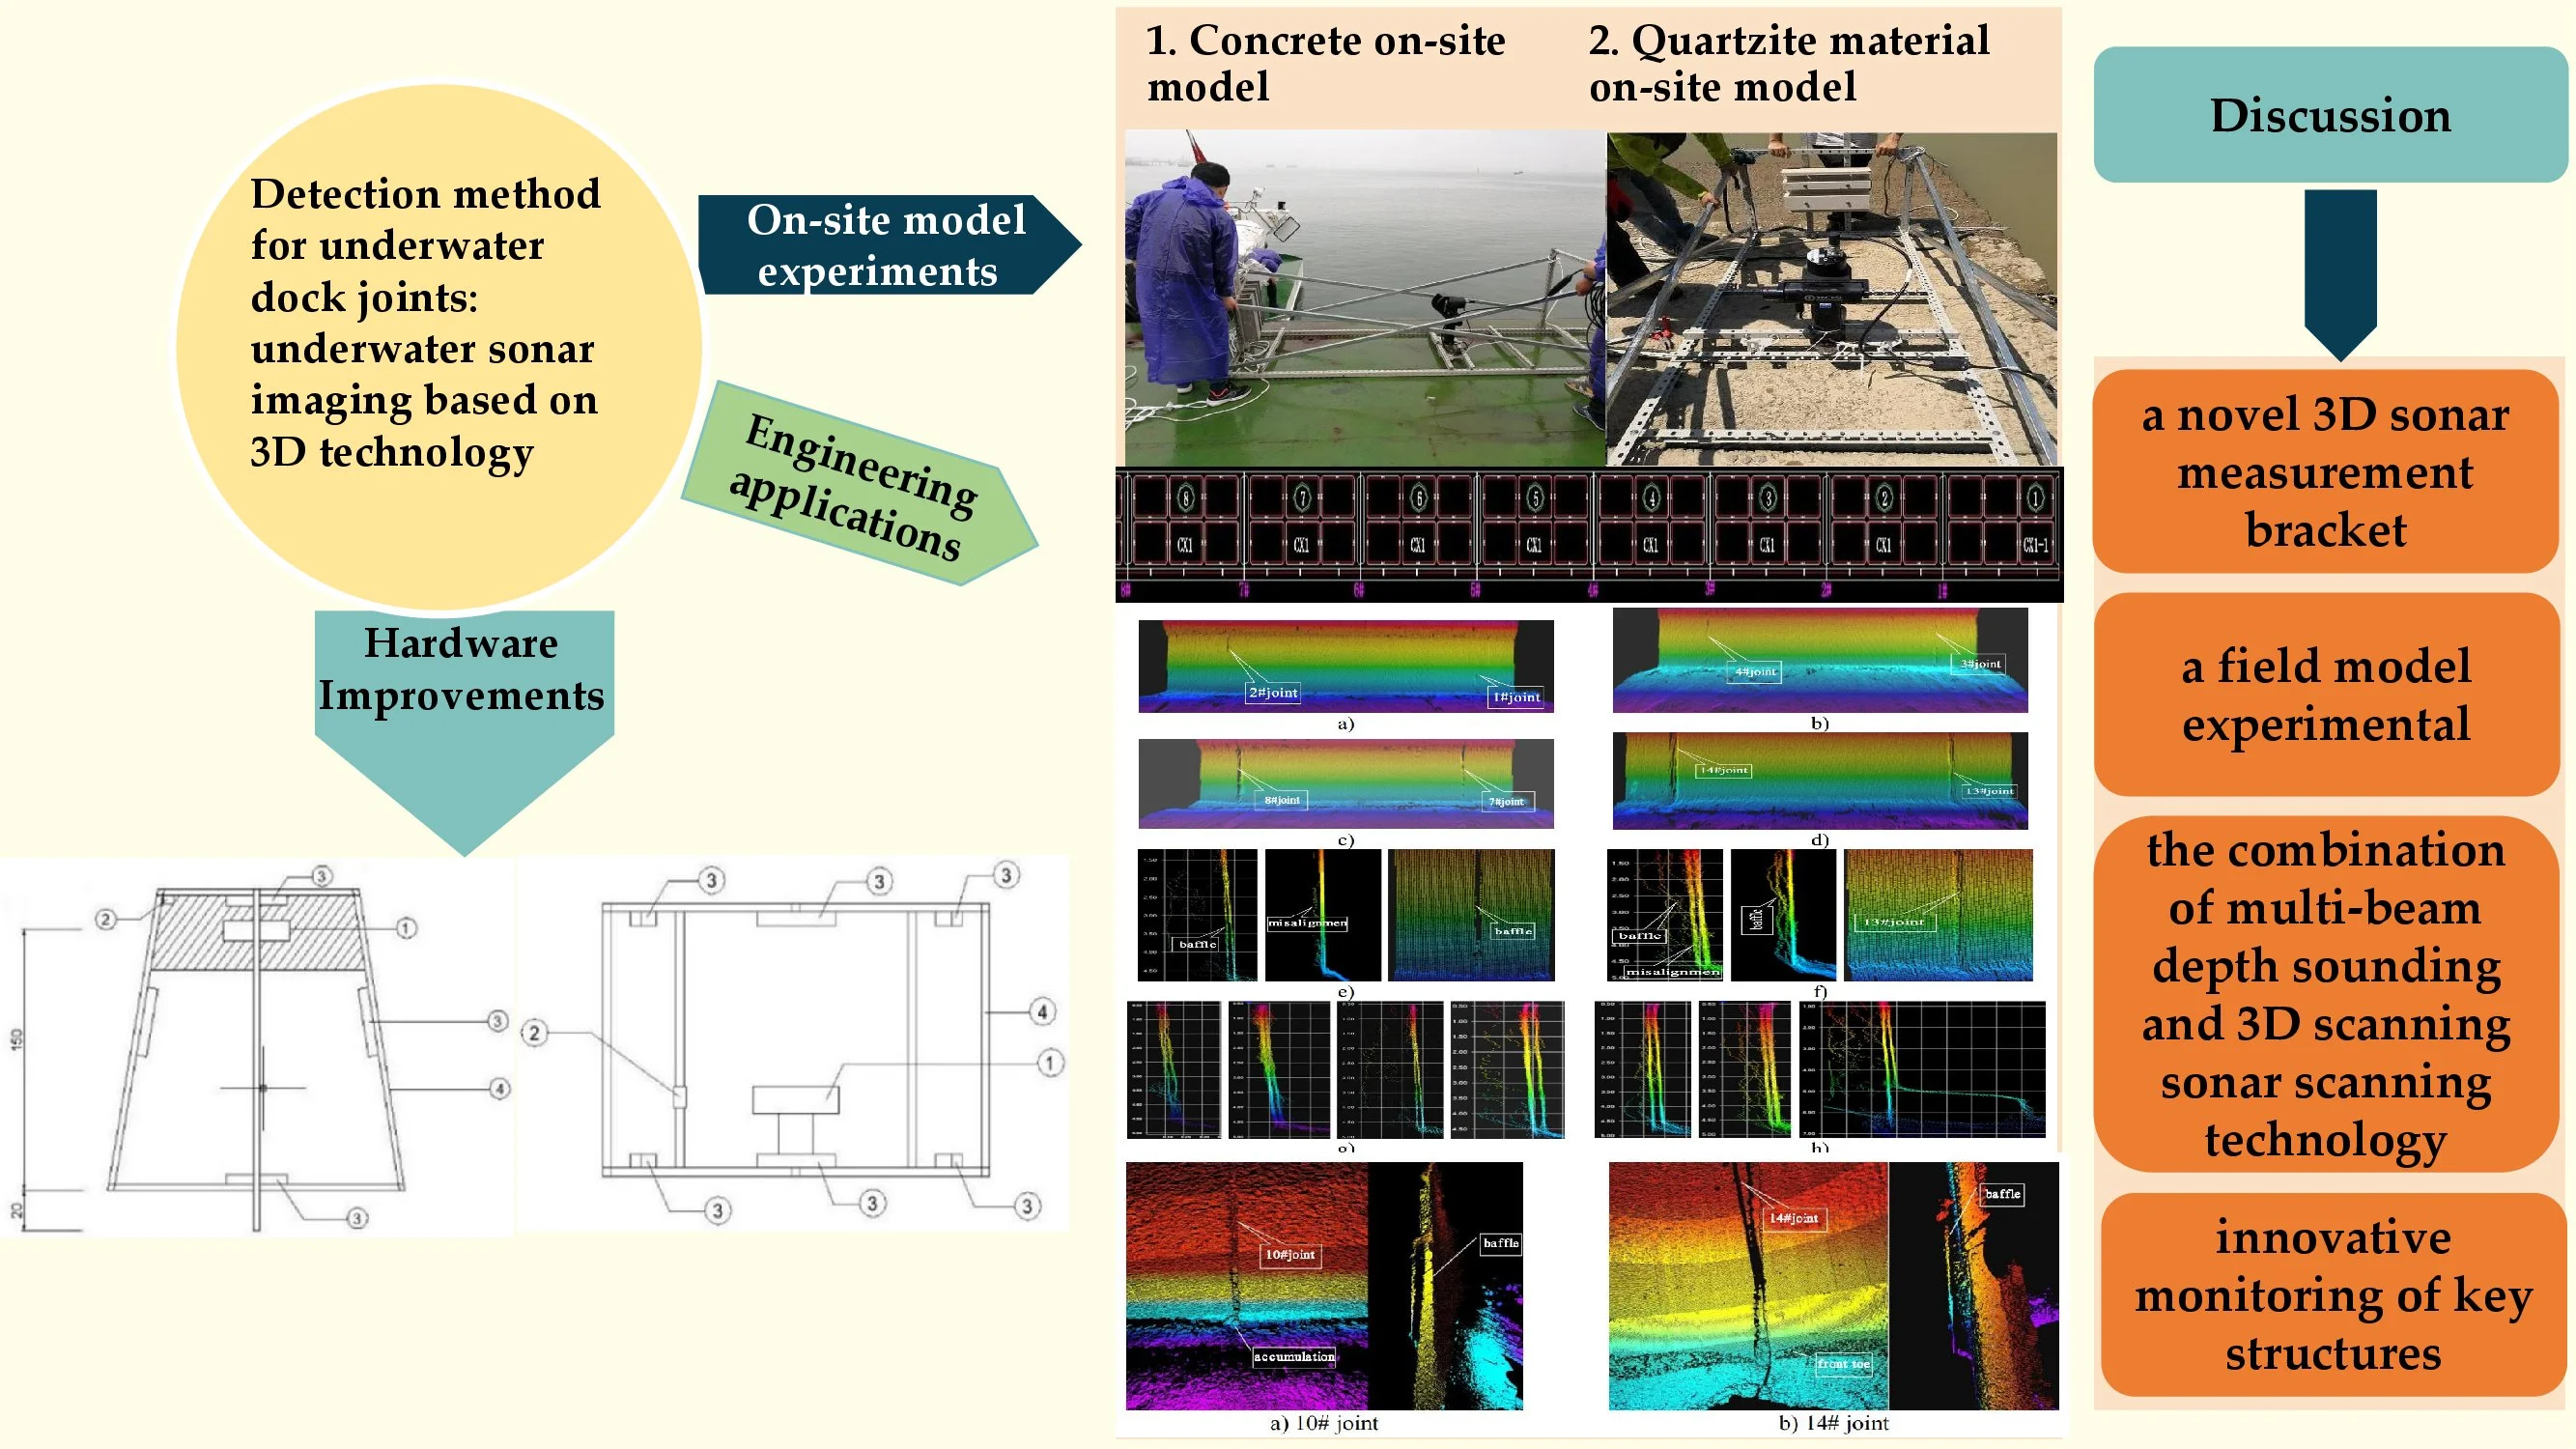
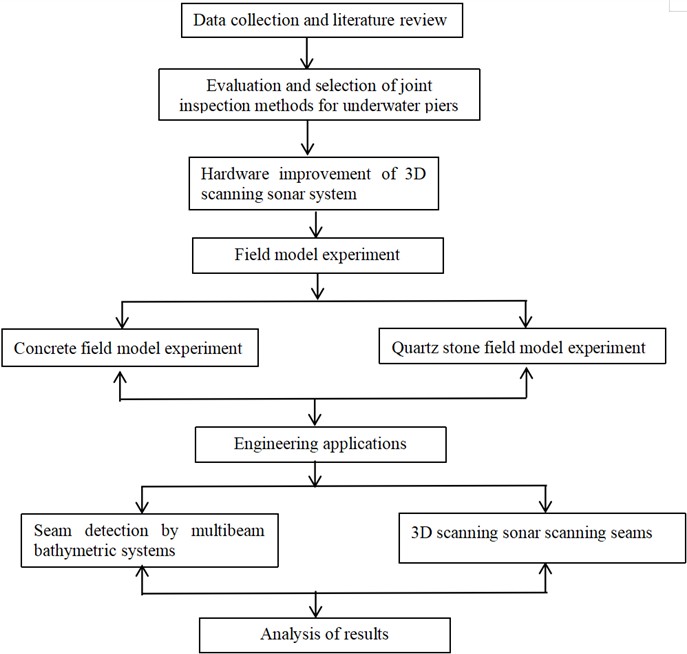
Compared with previous research, this paper solves the spatial and visual obstacles encountered in joint detection using traditional methods, and it achieves a comprehensive optimization and upgrade from hardware to software through self-developed supports and technology integration. Using the engineering example of Berths No. 1 and 2 in the Gulei operation area of Xiamen Port, it showcases the immense potential of 3D sonar imaging technology in underwater scenarios. This achievement is expected to lead a new wave of development trends in underwater structural detection technology and is significant for promoting the safety and durability of underwater engineering. A map of the workflow is illustrated in Fig. 1.
Fig. 1Workflow diagram
2. Principles of the 3D scanning sonar system and hardware improvements
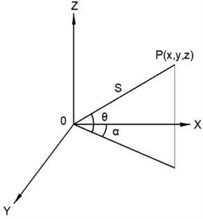
Three-dimensional scanning sonar obtains the round-trip time and sound wave intensity values of beams emitted and received underwater, in order to calculate the distance measurement value . By adjusting the rotation of the scanning sonar head via a gimbal, horizontal and vertical detection angles and of each sound wave during detection are obtained. Establish a three-dimensional coordinate system with horizontal lateral detection planes as the -axis, directions perpendicular to the -axis as the -axis, and vertical detection directions as the -axis, as shown in Fig. 2. Based on the obtained angles and distance measurements, the coordinates of sound wave footprints in the three-dimensional coordinate system are determined, please refer to Eqs. (1-3):
Fig. 2Measurement geometry of 3D scanning sonar BV5000
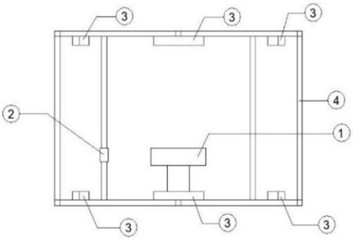
This research invents a novel 3D sonar measurement bracket, effectively solving the problem of limited detection range with traditional methods. The bracket employs a trapezoidal design, as shown in Fig. 3(a)-(b). The main unit of the 3D sonar is fixed inside the bracket cavity, ensuring large-area contact with the caisson, enhancing stability of the equipment in water flow, safeguarding the sonar transmitting effect and reducing the data error. The internal space of the bracket meets the optimal distance of 1.5 m between the sonar head and the target, balancing detection requirements and accuracy. Equipped with a depth sounder for precise positioning of the sonar head depth. By adjusting the bracket's probe angle and interacting with the caisson wall, rope tension, and buoyancy material counterweights, the 3D sonar’s operational posture requirements are met. This bracket can flexibly adjust to different depths, segmenting measurements of caisson joints, significantly improving detection accuracy.
Fig. 3Schematic diagram of the measuring stand. Note: 1) denotes the sonar station, 2) denotes the sounder, 3) is the float, 4) is the bracket
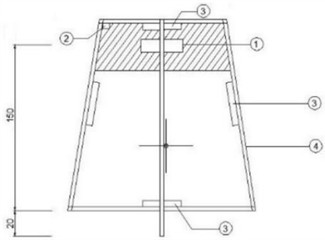
a) Top view
b) Front view
3. On-site model experiments
Design concrete and quartzite on-site model experimental schemes, produce models of standard dimensions, consider different testing conditions such as water environment, detection distance, and model materials, and conduct underwater three-dimensional scanning sonar accuracy evaluation testing.
3.1. Concrete on-site model
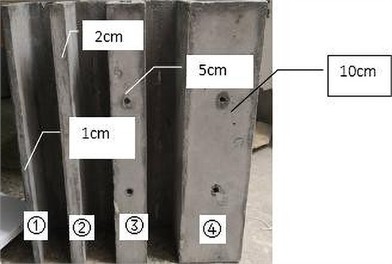
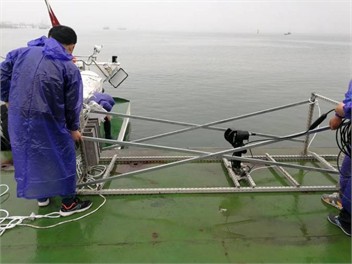
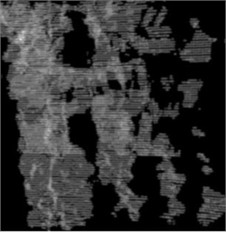
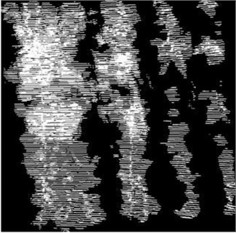
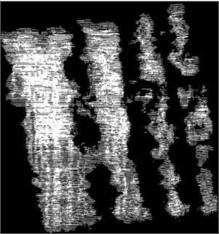
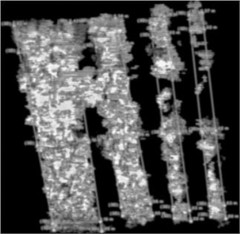
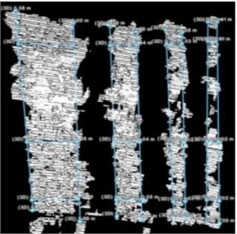
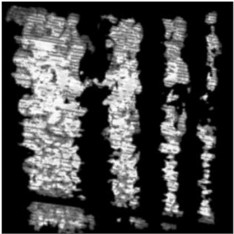
Using the BV5000-1350 three-dimensional scanning sonar, experiments were conducted in the Meizhou Bay area using a self-made vertical dock model for underwater detection. Models were constructed with cubic shapes of 1 cm, 2 cm, 5 cm, and 10 cm widths to simulate different widths of underwater components, as shown in Fig. 4(a). Model specifications include a thickness of 10 cm and a length of 40 cm. In the water environment with a sound speed of 1509 m/s, the detection performance was evaluated by adjusting the distance between the sonar and the model from 0.6 to 1.5 m, and the measurement process is shown in Fig. 4(b), with selected images displayed in Fig. 5. Considering the physical principles such as sound wave attenuation, diffraction effects, Doppler frequency shift limitations, focusing capability, and beam width, the 3D scanning sonar experiences a decrease in sound wave energy as propagation distance increases. This results in a weakening of echo signal strength, which reduces image clarity. For example, the clarity of model boundaries declines when the distance exceeds 1.1 m. On the other hand, diffraction causes sound waves to bend and disperse when encountering the edges of obstacles, affecting the precise capture of object contours. For instance, when the distance is less than 0.9 m, the echo signal may experience interference, and there are issues with signal loss due to reflections at close distances, with incomplete signals observed at the bottom of the model at 0.6 m. However, within the range of 0.9 to 1.1 m, these two negative effects are relatively balanced, maintaining optimal image quality and resolution. Therefore, the 3D sonar technology achieves a perfect fit between physical principles and practical needs at the optimal detection distance of approximately 1 m.
Fig. 4a) Frontal view of the homemade upright bank wall model, b) sonar and model fixed to the measurement stand
a)
b)
Analyzing three-dimensional sonar images, the cubic shapes of different widths were subdivided into 20 equal parts and measured for width, as Table 1 shows measurement data at distances of 0.9, 1, and 1.11 m. The data shows that the resolution of the three-dimensional sonar can reach 1 millimeter. For cubic shapes with widths of 5 cm and 10 cm, accurate measurement results with clear and continuous boundaries were obtained, with errors of less than 5 %. However, for cubic shapes with widths of 1 and 2 cm, discontinuous boundaries and significant errors were noted, with actual values exceeding confidence intervals. In summary, measurement accuracy increases with the width of the cubic shape.
Fig. 5Images of experimentally collected data at different distances from the field model (left middle right indicates the distance between the front, back, and front and rear panels, respectively)
a) 1.5 m
b) 1.2 m
c) 1.1 m
d) 1.0 m
e) 0.9 m
f) 0.8 m
Table 1Statistics of measurement results
Detection distance (m) | Model width (cm) | Average value (cm) | 95 per cent confidence interval of the mean | Variance | Mean value and true value error (%) | |
Lower limit (cm) | Upper bound (cm) | |||||
0.9 | 1 | 1.6 | 1.3 | 1.8 | 0.2 | 55.6 |
2 | 2.6 | 2.3 | 2.9 | 0.3 | 29.4 | |
5 | 4.8 | 4.5 | 5.0 | 0.2 | 4.5 | |
10 | 9.8 | 9.4 | 10.2 | 0.5 | 2.1 | |
1 | 1 | 1.5 | 1.2 | 1.7 | 0.2 | 47.5 |
2 | 2.2 | 2.0 | 2.4 | 0.1 | 8.1 | |
5 | 5.2 | 5.0 | 5.4 | 0.1 | 4.5 | |
10 | 10.2 | 9.8 | 10.6 | 0.5 | 2.3 | |
1.1 | 1 | 1.2 | 1.0 | 1.3 | 0.1 | 16.3 |
2 | 1.8 | 1.6 | 2.0 | 0.2 | 10.2 | |
5 | 4.9 | 4.8 | 5.1 | 0.1 | 1.1 | |
10 | 9.7 | 9.1 | 10.4 | 1.5 | 2.6 | |
3.2. Quartzite material on-site model
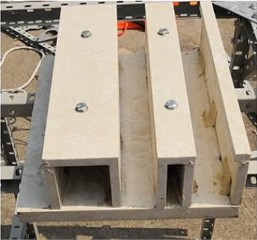
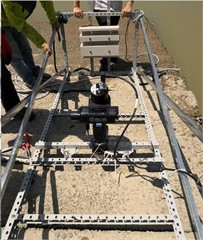
Models were embedded with various sized quartzite slabs, including sizes of 2 cm×40 cm, 5 cm×40 cm, and 10 cm×40 cm, accompanied by a 32 cm×40 cm base plate with internal slots 5 cm wide, 10 cm deep, 10 cm thick, and 40 cm long, as shown in Figs. 6 (a)-(b). Detection was conducted in turbid water with high sediment content, adjusting the distance between the BV5000 transducer acoustic center and the front plate of the model and observations were made, with detection parameters configured in ProScan software, such as angles, speed, detection points, and sound speed. The results of detection at different distances are shown in Fig. 7. The optimal detection range of the three-dimensional scanning sonar for detection is around 1 m, the resolution of 1 cm, the detection conclusions shown in Table 2. It is noted that scanning speeds of 0.5° or 1° have minimal impact on block resolution. Thresholds between 500 and 2000 have no effect on block resolution. The error partly stems from discrepancies between manually set sonar instrument and model distances, which deviates from the actual distance.
Fig. 6a) Frontal view of the homemade upright bank wall model, b) sonar and model fixed to the measurement stand
a)
b)
Fig. 7Images of experimentally collected data at different distances from the field model (left middle right indicates the distance between the front, back, and front and rear panels, respectively)

a) 2.5 m

b) 1.8 m

c) 1.5 m

d) 1.2 m

e) 1.0 m

f) 0.9 m
3.3. Ablation experiments
To investigate the actual performance of key components in the 3D sonar imaging system, the research team conducted a series of comparative ablation experiments, with the results shown in Table 3. It can be observed that all components must work in synergy to form a highly precise underwater joint detection scheme using 3D sonar imaging, and the absence of any single part would significantly weaken system performance, demonstrating the complexity and integration effects of 3D sonar imaging.
Table 2Detection results of different centre distance
Distance (m) | Speed/ thresholds | Imaging features | Imaging resolution |
2.5 | 0.5 | Poorly defined block boundaries | Distance between front and rear panels 9 cm |
1.8 | 5 | No backplane data | |
0.5 | Block boundaries are discernible but not continuous | Distance between front and rear panels 10 cm, maximum front panel length 43 cm, width 11 cm | |
1 | Distance between front and rear panels 10 cm, maximum front panel length 44 cm, width 11 cm | ||
1.5 | 0.5 | Distance between front and rear boards 10 cm, length of front board: 5 cm, 7 cm, 3 cm respectively; rear board Board length 10 cm, 7 cm | |
1.2 | 1 | Blocks (except 2 cm) with continuously resolvable boundaries | Distance between front and rear panels 10 cm; length of front panels respectively: 3 cm, 7 cm, 10 cm; length of rear panels 7 cm, 7 cm, 4 cm |
0.5 | Distance between front and rear panels 10 cm; length of front panel: 2 cm~3 cm, 7 cm, 8 cm; length of rear panel 8 cm, 7 cm, 4 cm | ||
1.0 | 0.5/1200 | Block boundaries are clear and continuous | Distance between front and rear panels 10 cm; length of front panel: 1 cm to 2 cm, 5 cm to 6 cm, 8 cm to 9 cm; length of rear panel 6 cm, 6 cm, 2 cm |
1.0 | 0.5/2000 | Distance between front and rear panels 10 cm; length of front panel: 2 cm, 5 cm, 8 cm; length of rear panel 6 cm, 7 cm, 2 cm |
Table 3Comparison results of ablation experiments
Key component | Experimental operation | Experimental results | Experimental conclusion |
Advanced digital signal processor (DSP) | DSP module ablation | Joint details in the image are unclear, accuracy decreased by approximately 20 % | Confirms the crucial role of DSP in noise suppression |
Complex background suppression algorithm | Absence of complex background suppression algorithm | Joints blend with the surrounding environment, detection rate reduced by 15 % | Indicates its critical importance for adaptability in high-contrast environments |
Adaptive threshold segmentation strategy | Failure of adaptive threshold segmentation strategy | Severe deviation in defining joint edges, overall accuracy decreased by 18 % | Demonstrates that adaptability is key for fine detail capture |
Geometric shape matching technology | Loss of geometric shape matching technology | Identification rate of long direct joints significantly dropped by 25 % | Highlights its important role in geometric shape recognition |
4. Engineering applications
To fully validate the applicability and accuracy of 3D sonar imaging technology in detecting underwater structures, the research team conducted inspections at various locations, including Quanzhou Port, Putian Meizhou Bay Port, Xiamen Port, and Xiamen Fisheries Base for Taiwan. Inspections of foundation beds, caissons, revetments, and breakwaters yielded highly consistent data. For brevity, the detection results of vertical direct joints between caissons after installation are discussed as an example at Berths No. 1 and 2 in the Gulei operation area of Xiamen Port. A total of 35 samples of caisson joints were randomly selected after the installation of the baffle, numbered from east to west, as shown in Fig. 8. During low to high tide, scanning data was collected using multibeam depth sounders and three-dimensional sonars. By analyzing the upper and lower widths and staggering of caisson joints, the quality of caisson joints installation was evaluated. Multibeam depth sound systems were used for preliminary detection of joints 1# to 35#, where joints 26# to 35# were not included in the baffle installation analysis, only analyzing misalignment. The detection results show that some joint widths are wide, showing upper and lower asymmetry or misalignment between adjacent caissons along the coast.
Fig. 8Laying of caisson installation joints

4.1. Detection of multi-beam bathymetry system joints
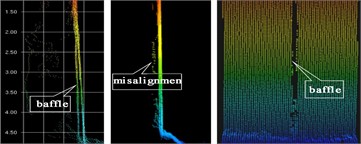
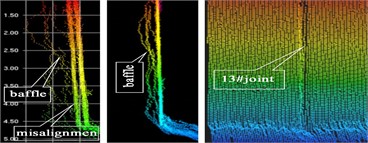
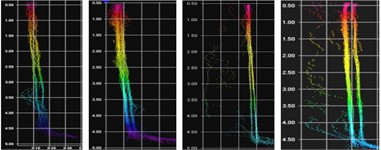
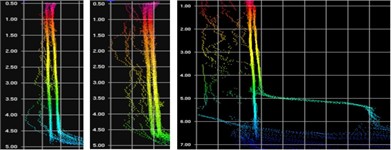
Joints of caissons are shown in Figs. 9(a)-(f), and misalignment in caissons are shown in Figs. 9(g)-(h). From Figs. 9(a)-(d), it can be observed that the widths of each joint are small, all less than 80 mm.
Fig. 9a) 3D view of 1# and 2# caisson joints, b) 3D view of 3# and 4# caisson joints, c) 3D view of 7# and 8# caisson joints, d) 3D view of 13# and 14# caisson joints, e) side view and front view of 8# caisson joints, f) side view and front view of 13# caisson joints, g) side view of misalignment in caissons 1#, 5#, 8# and 10#, h) Side view of misalignment in caissons 11#, 13# and 15#

a)

b)

c)

d)
e)
f)
g)
h)
From the front view in Fig. 9(e), joint 8# shows a widening from top to bottom (widths of 40 mm at the top and 210 mm at the bottom) with an angular displacement of approximately 1.5°. From the side view, the joint exhibits a two-section insert plate extending 3 m high (from 1 to 4 m from the theoretical depth reference) with misalignment. From the front view in Fig. 9(f), joint 13# shows a widening from top to bottom (widths of 80 mm at the top and 150 mm at the bottom) with an angular displacement of approximately 1°. From the side view, the joint features a 6.5 m high insert plate (from –2 to 4.5 m from the theoretical depth reference).
4.2. Three-dimensional scanning sonar system scanning joints
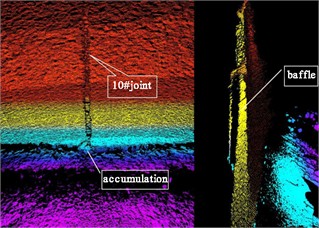
The multi-beam bathymetry system detected that joints 10#, 14#, 15#, 19#, and 25# had larger widths. Further detailed scanning and magnified detection were conducted using three-dimensional imaging sonar, and some scanning images are shown in Figs. 10(a)-(b). The detection results indicate that joints 10# and 14# have larger widths, with uniformly wide upper and lower joints and higher insert plates. Joint 10# also shows a small accumulation at the bottom. Joints 15# and 16# of the high-low caissons connections are wider with even upper and lower widths, and the front toe of caisson 15# is prominent. Joints 19# and 25# are less obvious, showing a widening from top to bottom, with joint 19# featuring an insert plate in the upper half.
Fig. 103D scanned front view and side view of joints
a) 10# joint
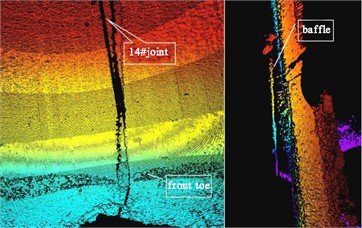
b) 14# joint
The allowable range for caisson installation joint width is from 50 mm to 110 mm. A total of 25 joints were randomly sampled for testing, among which 11 had widths less than 50 mm and 6 exceeded 110 mm. The upper joints of caissons 10#, 14#, 15#, 19#, and 25# are wider, while the lower joints of caissons 19# and 25# are narrower, showing a widening from top to bottom, with uniform upper and lower widths for the remaining joints. The visual inspection of the detection images indicates that the boundaries of each joint are relatively regular, without damage. Adjacent mismatches of caissons near the water surface and lower parts were randomly sampled for 30 joints, with 15 exceeding 30 mm. Tables 4-5 summarize the caisson joint width detection and adjacent caisson mismatch statistics.
Table 4Caisson joint width detection statistics
No. | Joint width (mm) | No. | Joint width (mm) | No. | Joint width (mm) | No. | Joint width (mm) | ||||
Upper | Lower | Upper | Lower | Upper | Lower | Upper | Lower | ||||
1# | 35 | * | 8# | 40 | 210(197) | 15# | 190 | 200(194) | 22# | 40 | * |
2# | 50 | * | 9# | 90 | * | 16# | 25 | * | 23# | 20 | * |
3# | 55 | * | 10# | 135 | 140(134) | 17# | 85 | 80 | 24# | 25 | * |
4# | 65 | * | 11# | 30 | * | 18# | 50 | * | 25# | 110 | 50 |
5# | 25 | * | 12# | 30 | * | 19# | 120 | 50 | |||
6# | 20 | * | 13# | 80 | 150(145) | 20# | 20 | * | |||
7# | 60 | 80 | 14# | 235 | 230 | 21# | 10 | * | |||
Note: * denotes that multibeam bathymetric system detections were unable to measure the joint width | |||||||||||
Table 5Adjacent misalignment in caissons statistics
No. | Adjacent misalignment in caissons near the water surface (mm) | Description of the phenomenon | No. | Adjacent misalignment in caissons near the water surface (mm) | Description of the phenomenon | ||
Upper | Lower | Upper | Lower | ||||
1# | 40 | 40 | Upper and lower levels are identical | 18# | 40 | 40 | Upper and lower levels are identical |
5# | 30 | 30 | 21# | 10 | 100 | Reverse widening from lower to upper | |
8# | 10 | 80 | Widening from lower to upper | 23# | 30 | 160 | Widening from lower to upper |
10# | 60 | 100 | 25# | 60 | 60 | Upper and lower levels are identical | |
11# | 50 | 90 | 26# | 10 | 60 | Widening from lower to upper | |
13# | 30 | 30 | Upper and lower levels are identical | 27# | 10 | 40 | Reverse widening from lower to upper |
15# | 50 | 50 | 28# | 10 | 70 | ||
16# | 50 | 50 | 29# | 20 | 70 | ||
17# | 40 | 40 | 30# | 30 | 30 | Upper and lower levels are identical | |
5. Conclusions
This project has developed a new type of 3D sonar measurement bracket, conducting experiments on concrete and quartz models. a measurement approach combining multi-beam depth sounding and 3D scanning sonar scanning technology was employed to achieve precise measurements of the underwater dock surface joints.
1) To address the limitations of traditional equipment in underwater detection, our research team independently designed a novel 3D sonar measurement bracket, overcoming the measurement blind spots caused by spatial constraints. This flexible and adaptable bracket can extend and retract freely at various depths, effectively reaching complex terrains such as caisson joints, ensuring comprehensive and unobstructed data collection. The bracket is integrated with a stabilization control system that maintains the precise positioning of the measuring equipment even in the face of water flow impacts or external disturbances, significantly enhancing data quality and reliability.
2) A field model experimental plan was designed. Considering factors such as water environment, light intensity, flow velocity, detection distance, and model materials, underwater 3D scanning sonar accuracy assessments were conducted. The experiments showed that at the optimal detection distance of 0.9m-1.1m, a scanning resolution of 1cm can be achieved. the detection results exceeded the corresponding requirements of the “Standards for Quality Inspection of Water Transport Projects” [28].
3) The combination of multi-beam depth sounding and 3D scanning sonar scanning technology possesses strong anti-interference capabilities, ensuring stable performance output in both shallow and deep water regions, even in harsh environments with a significant amount of suspended particulate matter, achieving accurate measurements.
4) Innovative monitoring of key structures such as foundation beds, caissons, revetments and wave breakwaters in important areas such as Quanzhou Port, Putian Meizhou Bay Port, Xiamen Port, and Xiamen Fisheries Base for Taiwan has been carried out by 3D sonar imaging, deepening the understanding of the health status of underwater engineering. in the future, it will even be extended to various fields such as marine scientific research and underwater cultural heritage protection, opening up a new era of more comprehensive and refined monitoring of the underwater world.
References
-
A. Fernandez-Perez, J. L. Lara, D. Lucio, and I. J. Losada, “Compound climate change risk analysis for port infrastructures,” Coastal Engineering, Vol. 193, p. 104560, Oct. 2024, https://doi.org/10.1016/j.coastaleng.2024.104560
-
S. Li, D. Su, F. Yang, H. Zhang, X. Wang, and Y. Guo, “Bathymetric LiDAR and multibeam echo-sounding data registration methodology employing a point cloud model,” Applied Ocean Research, Vol. 123, p. 103147, Jun. 2022, https://doi.org/10.1016/j.apor.2022.103147
-
A. K. Mohapatra and T. Sahoo, “Surface gravity wave interaction with a floating dock in the presence of a submerged composite wavy porous plate,” Applied Ocean Research, Vol. 139, p. 103686, Oct. 2023, https://doi.org/10.1016/j.apor.2023.103686
-
D. Zhang, A. Polamarasetty, M. O. Shahid, B. Krishnaswamy, and C. Ma, “Metamaterial-based passive analog processor for wireless vibration sensing,” Communications Engineering, Vol. 3, No. 1, p. 44, Mar. 2024, https://doi.org/10.1038/s44172-024-00190-8
-
X.-L. Peng and H. Hao, “A numerical study of damage detection of underwater pipeline using vibration-based method,” International Journal of Structural Stability and Dynamics, Vol. 12, No. 3, p. 1250021, May 2012, https://doi.org/10.1142/s0219455412500216
-
W. Jia, X. Wang, Y. Li, P. Chen, and Z. Xie, “Calibration method for key refractive parameters of underwater binocular vision,” Optics and Lasers in Engineering, Vol. 179, p. 108228, Aug. 2024, https://doi.org/10.1016/j.optlaseng.2024.108228
-
A. Alizadeh, M. Daghigh, M. Bali, H. Golpour, and M. H. Kazeminezhad, “A framework for implementing structural integrity management of an aging fixed offshore platform using wave modeling for risk-based underwater inspection provision,” Ocean Engineering, Vol. 309, p. 118368, Oct. 2024, https://doi.org/10.1016/j.oceaneng.2024.118368
-
Q. Tang et al., “Study on the performance of vortex suction cup for an underwater inspection robot,” Ocean Engineering, Vol. 300, p. 117462, May 2024, https://doi.org/10.1016/j.oceaneng.2024.117462
-
Y. Huang and R. Chen, “Scientific mapping and bibliometric analysis of research advancements in underwater image enhancement,” Journal of Visual Communication and Image Representation, Vol. 101, p. 104166, May 2024, https://doi.org/10.1016/j.jvcir.2024.104166
-
P. S. and C. M. Denny J., “An efficient approach to detect and segment underwater images using Swin transformer,” Results in Engineering, Vol. 23, p. 102460, Sep. 2024, https://doi.org/10.1016/j.rineng.2024.102460
-
H. Zhao et al., “Underwater arbitrary distance measurement using laser frequency comb with simultaneous correction of underwater refractive index,” Measurement, Vol. 204, p. 111995, Nov. 2022, https://doi.org/10.1016/j.measurement.2022.111995
-
H. Tan, L. Zheng, C. Ma, Y. Xu, and Y. Sun, “Deep learning-assisted high-resolution sonar detection of local damage in underwater structures,” Automation in Construction, Vol. 164, p. 105479, Aug. 2024, https://doi.org/10.1016/j.autcon.2024.105479
-
S. Zhang, Y. Zhu, W. Xiong, X. Rong, and J. Zhang, “Bridge substructure feature extraction based on the underwater sonar point cloud data,” Ocean Engineering, Vol. 294, p. 116770, Feb. 2024, https://doi.org/10.1016/j.oceaneng.2024.116770
-
M. Jacobi, “Autonomous inspection of underwater structures,” Robotics and Autonomous Systems, Vol. 67, pp. 80–86, May 2015, https://doi.org/10.1016/j.robot.2014.10.006
-
Y. Huang, Q. Zhuo, J. Fu, and A. Liu, “Research on evaluation method of underwater image quality and performance of underwater structure defect detection model,” Engineering Structures, Vol. 306, p. 117797, May 2024, https://doi.org/10.1016/j.engstruct.2024.117797
-
J. Zhao, Y. Cheng, G. Cai, C. Feng, L. Liao, and B. Xu, “Correction model of linear structured light sensor in underwater environment,” Optics and Lasers in Engineering, Vol. 153, p. 107013, Jun. 2022, https://doi.org/10.1016/j.optlaseng.2022.107013
-
H. Joe, J. Kim, and S.-C. Yu, “Sensor fusion-based 3D reconstruction by two sonar devices for seabed mapping,” IFAC-PapersOnLine, Vol. 52, No. 21, pp. 169–174, Jan. 2019, https://doi.org/10.1016/j.ifacol.2019.12.302
-
B. Chen, Y. Yang, J. Zhou, Y. Zhuang, and M. Mcfarland, “Damage detection of underwater foundation of a Chinese ancient stone arch bridge via sonar-based techniques,” Measurement, Vol. 169, p. 108283, Feb. 2021, https://doi.org/10.1016/j.measurement.2020.108283
-
S. Zhu, J. Liu, A. Guo, and H. Li, “Non-contact measurement method for reconstructing three-dimensional scour depth field based on binocular vision technology in laboratory,” Measurement, Vol. 200, p. 111556, Aug. 2022, https://doi.org/10.1016/j.measurement.2022.111556
-
Y. Steiniger, D. Kraus, and T. Meisen, “Survey on deep learning based computer vision for sonar imagery,” Engineering Applications of Artificial Intelligence, Vol. 114, p. 105157, Sep. 2022, https://doi.org/10.1016/j.engappai.2022.105157
-
A. Abbaszadeh Shahri, C. Shan, and S. Larsson, “A novel approach to uncertainty quantification in groundwater table modeling by automated predictive deep learning,” Natural Resources Research, Vol. 31, No. 3, pp. 1351–1373, Apr. 2022, https://doi.org/10.1007/s11053-022-10051-w
-
L. Li, Y. Li, C. Yue, G. Xu, H. Wang, and X. Feng, “Real-time underwater target detection for AUV using side scan sonar images based on deep learning,” Applied Ocean Research, Vol. 138, p. 103630, Sep. 2023, https://doi.org/10.1016/j.apor.2023.103630
-
A. Abu and R. Diamant, “Underwater object classification combining SAS and transferred optical-to-SAS Imagery,” Pattern Recognition, Vol. 144, p. 109868, Dec. 2023, https://doi.org/10.1016/j.patcog.2023.109868
-
S. Teng et al., “Review of intelligent detection and health assessment of underwater structures,” Engineering Structures, Vol. 308, p. 117958, Jun. 2024, https://doi.org/10.1016/j.engstruct.2024.117958
-
Y. Shen, Y. Li, W. Li, H. Gao, and C. Wu, “A novel underwater weak signal detection method based on parameter optimized VMD and 3D chaotic system,” Digital Signal Processing, Vol. 151, p. 104571, Aug. 2024, https://doi.org/10.1016/j.dsp.2024.104571
-
B. Zhao, Q. Zhou, L. Huang, and Q. Zhang, “Unpaired sonar image denoising with simultaneous contrastive learning,” Computer Vision and Image Understanding, Vol. 235, p. 103783, Oct. 2023, https://doi.org/10.1016/j.cviu.2023.103783
-
P. Shi, Q. He, S. Zhu, X. Li, X. Fan, and Y. Xin, “Multi-scale fusion and efficient feature extraction for enhanced sonar image object detection,” Expert Systems with Applications, Vol. 256, p. 124958, Dec. 2024, https://doi.org/10.1016/j.eswa.2024.124958
-
“Standard for quality inspection of port and waterway engineering construction,” (in Chinese), Ministry of Transport of the People’s Republic of China, JTS 257-2008, 2008.
About this article
This work was supported by China Communications Third Highway Engineering Bureau Co., Ltd. (No. 4GS-FZJC-0618-2023-0006, H202306015, CZJTTYHK20230011), the Fujian Provincial Department of Science and Technology (No. 2024R0082), and CCCC Highway Consultants Co., Ltd. (Nos. H202410007, CZJTAHXY2024014).
The datasets generated during and/or analyzed during the current study are available from the corresponding author on reasonable request.
The authors declare that they have no conflict of interest.
