Abstract
The large mining-height hydraulic support test-bed serves as a crucial tool for heavy hydraulic support factory inspections and type testing. With the successful development of the ZY29000/45/100D hydraulic support, the need for a large high-mining hydraulic support test-bed has become evident. This paper combines the theory of rigid-flexible coupling in virtual prototypes and ADAMS multi-body dynamic simulation technology to analyze the strength of the 50,000 kN hydraulic support test-bed. ANSYS classic modules were employed to address the flexibility of key components within the test-bed. The fatigue life of the test-bed was analyzed using NSOFT software, the von Mises yield criterion, and the Goodman modified curve. The S-N curve of material parameters for the test-bed components was used to conduct a shrinkage test. The results indicate that the lowest position is the most vulnerable during the shrinkage test. Among the key components, the stress on the pin bearing is 356.6 MPa, which is 167.9 %, 123.3 %, and 41.6 % higher than that of the pillar, movable beam, and base, respectively. The fatigue life of the base under low, medium, and high shrinkage conditions is1.1×107, 4.0×10⁸, and 1.7×10⁸, with damage values of 8.8×10⁻⁸, 2.5×10⁻⁹, and 5.7×10⁻⁹, respectively. The base’s life under low shrinkage conditions is the shortest, followed by that under high shrinkage conditions. These research findings provide technical guidance and an optimization foundation for the successful development of a 50000 kN hydraulic support test-bed. They also offer a new method and approach for analyzing and predicting the fatigue life of key components in large-scale industrial and mining equipment operating under complex conditions, with promising practical applications.
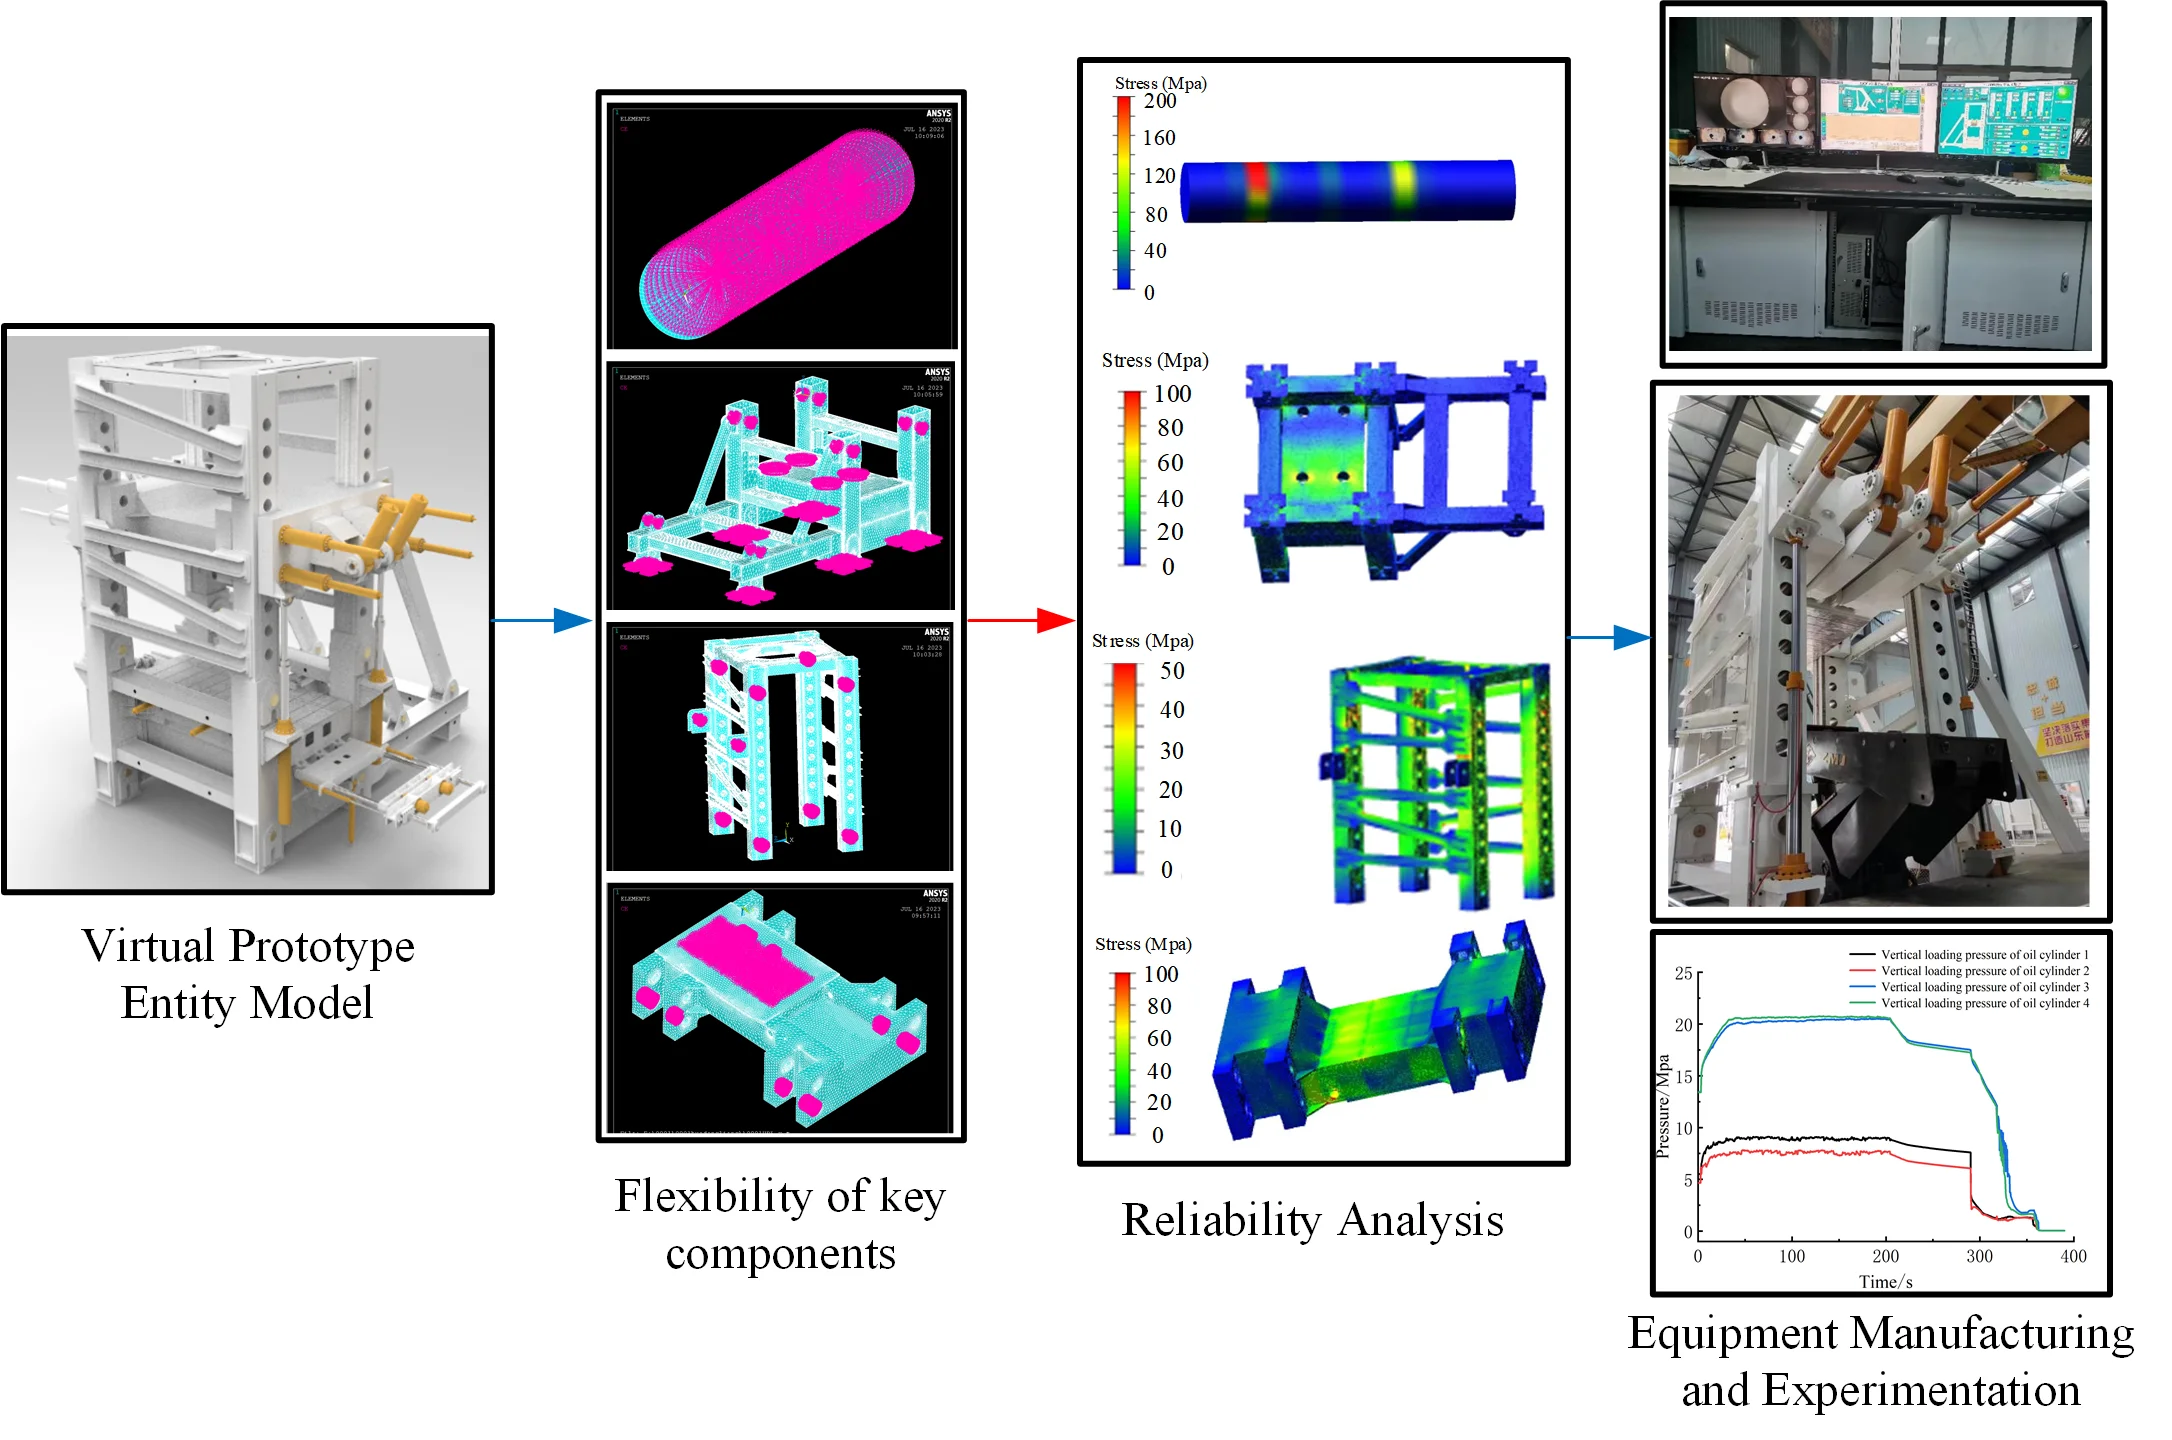
Highlights
- Reliability analysis of a 50000 kN hydraulic support test bench based on the basic theory of rigid flexible coupling in virtual prototyping and ADAMS multi-body dynamics simulation technology.
- By using the ANSYS-NSOFT interface technology, using the von Mises yield criterion and Goodman correction curve, the batch life of the test bench was analyzed, and the weak loading area and fatigue life trend of the heavy-duty hydraulic support test bench were identified.
- Provide a new method and means for fatigue life analysis and prediction of key components of large-scale industrial and mining equipment under complex working conditions.
1. Introduction
Hydraulic supports, as critical equipment for fully mechanized mining faces, exhibit excellent support performance [1]. With the development of high mining height and fully mechanized mining technology, existing hydraulic support test benches can no longer meet the factory inspection requirements. The development of a large-tonnage hydraulic support test bench is urgently needed.
As computer software and hardware technologies advance rapidly, virtual prototype technology has gradually become an important tool for coal mining equipment design and reliability analysis [2, 3]. Zheng Xinliang [4], using ANSYS for transient analysis, obtained the stress-time curve of the fatigue vulnerability points on the test bench. Combining the material P-S-N curve, the maximum fatigue damage value was calculated, and suggestions were made for replacing high-strength materials in fatigue vulnerable components. Bao Lei et al. [5] applied AMESim simulation software to study the dynamic performance of the hydraulic system of the hydraulic support test bench. By optimizing simulation parameters, the main technical parameters of the boosting cylinder were improved. Liang Ying et al. [6] designed the overall scheme of the large-tonnage hydraulic support test bench, calculating the mechanical performance of key components, loading conditions, and material selection to determine the final technical parameters. Liu Heyang [7] conducted a force analysis of the active beam system of the test bench under biased loading conditions of the hydraulic support. Through orthogonal experimental analysis, the influence of factors such as thickness, length, and position of the reinforcing plate on its weight and maximum stress were studied, and a fatigue life map was obtained through NSOFT fatigue life calculation. Du Hele [8] proposed a method for the hole-shaft coordination of the beam in the large-tonnage hydraulic support test bench. A mathematical model and transfer function for the four-cylinder synchronous system were established for external load tests, and a fuzzy PID controller was designed. Wang Jie et al. [9], based on the AHP fuzzy model, optimized the research on the pin-shaft nodes of the hydraulic support test bench. Five main indicators to reduce the stress peak in the contact area of the pin-shaft node hole wall were determined, and the optimal parameter combination was obtained. Wang Jun et al. [10] employed the method of adding a taper angle inside the pin-shaft hole to improve the phenomenon of stress concentration at the edge of the pin hole and pin-shaft fit. Based on the orthogonal experimental method, the influence of key dimensional parameters on the stress, strain, and maximum deformation of the pin-shaft structure was studied. Nima Rezazadeh et al. [11] utilized the Wavelet Time Scattering (WTS) method to investigate rotor system fault diagnosis, confirming the significant effectiveness of the WTS method in diagnosing rotor system faults. The ultimate goal of studying system reliability is to obtain the system's remaining useful life. Nima Rezazadeh et al. [12] developed an efficient method for assessing remaining useful life and designed a hybrid model. First, features were extracted using Principal Component Analysis (PCA). Then, using an ensemble model consisting of weighted averaging, K-Nearest Neighbors (KNN), and Gaussian Process Regression (GPR), the optimized hybrid model outperformed linear, KNN, and GPR models. Previous studies mostly focused on static load conditions and did not consider the effects of dynamic loads, power transmission between multiple bodies, or the flexibility of key components. Additionally, fatigue life analysis was insufficient, and there was a lack of comprehensive stress distribution studies under various working conditions.The high bearing pressure, harsh component loading, and complex structure of the large-tonnage hydraulic support test bench result in high manufacturing costs. Overcoming the technical challenges in designing and developing the large-tonnage hydraulic support test bench requires the application of virtual prototype technology for system-level simulation, taking into account the nonlinear coupling relationships between various components of the test bench system.
2. Test bench structural design
In accordance with GB25974.1-2010 [13] and Q/YKZ0102-2018 [14] hydraulic support test requirements, combined with the technical parameters for 7 m, 8.2 m, and 10 m high mining hydraulic supports provided by Donghua Heavy Machinery, a comprehensive design scheme for the entire test bench was proposed. Multiple schemes and technical parameter validations were conducted, leading to the final determination of the optimal structural design and overall technical parameters, as shown in Table 1.
Table 1Test bench overall technical parameters
Program | Parameter | Program | Parameter |
Maximum bearing capacity under internal loading | 50000 kN | Maximum external load capacity | 40000 kN |
Maximum load capacity of shield beam | 10000 kN | Maximum loading capacity of tail beam | 5000 kN |
Test allowable support height | 2700 mm-13000 mm | Test bench elevation range | 2700 mm-8700 mm |
Minimum key height size | 400 mm | Test platform size | 4000 mm×8000 mm |
Shrinkage test stroke | 145 mm | Shrinkage test speed | 0-100 mm/min |
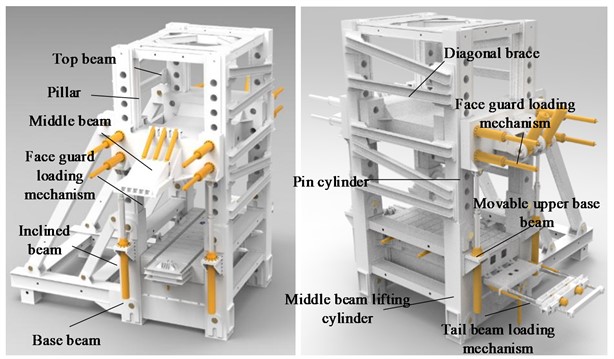
The composition of the test bench structure is illustrated in Fig. 1 and includes the following main components: base, inclined beam, face guard plate loading mechanism, mobile mid-beam, pillar, top beam, shield beam loading mechanism, diagonal brace, movable upper beam, tail beam loading mechanism, face guard plate loading cylinder, locking pin cylinder, and mid-beam lifting cylinder.
Fig. 1Test bench structure general drawing
3. Theoretical foundation of the study
The components of the hydraulic support test bench possess high strength and stiffness, yet the deformations of key stressed components such as the movable beam, base, and pin-shaft cannot be overlooked [10]. During the pressing frame test, especially under conditions such as shrinkage stroke, the movable beam experiences compression from the support roof. Under the influence of nonlinear dynamic loads, it undergoes vibration and deformation, transmitting these effects to other components [6]. Therefore, in the multibody dynamics model of the hydraulic support test bench, flexible treatment of critical components becomes essential.
3.1. Theory basis of rigidity-flexibility coupling
According to the principle of energy conservation, the potential and kinetic energy of flexible bodies are defined as follows [15], [16]:
where, K represents the stiffness matrix, Wg(ξ) denotes the gravitational potential energy, ξ is the generalized coordinate, M(ξ) represents the generalized mass matrix.
The energy dissipation function is given by:
where, D is the deformation damping coefficient matrix.
After coupling the flexible body with the rigid body through equations, the Lagrangian expression for the flexible body is given by:
where, L is the Lagrangian term, Ψ represents the constraint equation, λ is the Lagrange multiplier, Γ denotes the energy dissipation function, Q is the generalized force projected onto ξ.
The differential equations of multibody dynamics are given by:
where, ξ, ˙ξ and ¨ξ are, respectively, the generalized coordinates and their time derivatives for the flexible body, M(ξ) and represent, respectively, the mass matrix and its time derivative for the flexible body.
3.2. Fatigue life theory
The S-N curve represents the functional relationship between fatigue strength and fatigue life, and its expression takes the form of a power function [17], [18]:
where, σ denotes the material stress, N represents fatigue life, m and C are constants associated with material and stress parameters. The logarithmic form of Eq. (6) is expressed as:
where, A=lgC/m, B=-1/m.
Due to the presence of asymmetric loading conditions, it is necessary to convert the mean stress of non-symmetric loads into loads with zero mean stress, i.e., the S-N curve correction. The expression for the Goodman correction model is given as follows [19]:
where, σa represents stress amplitude, σm-1 denotes the stress amplitude when the mean stress is zero, σm-1 denotes the stress amplitude when the mean stress is zero, σm is the mean stress, and Rm is the ultimate strength.
Based on the assumption that fatigue damage is equal to the cumulative cycle ratio, the expression for the Miner’s rule resulting from the operational cycles is given as follows [20]:
where, ni represents the actual number of cycles at the ith stress amplitude level, Ni is the allowable number of cycles at the ith stress amplitude level until fatigue failure occurs. When D equals 1, i.e., when cumulative damage reaches its limit, the component will experience fatigue failure.
4. Strength analysis
In accordance with the national standards for the factory inspection of hydraulic supports, the performance shrinkage tests were conducted at three different heights within the range of the support adjustment: high, medium, and low. The subsidence amount exceeded 100 mm, and the subsidence speed did not exceed 100 mm/min. The test was not conducted within the 50 mm range from the highest and lowest points of the support. The horizontal load limit of the support acting on the test bench was set at 0.3 times the working resistance. During the test, both the pillar and the safety valve of the hydraulic jack were adjusted to the specified working pressure.
4.1. Generation of flexible components
The key component models requiring flexibility were imported into the ANSYS classical module through interfaces. Material density, Young’s modulus, Poisson's ratio, and other parameters were assigned to the models, and grids were drawn [21]. The material parameters are shown in Table 2.
Table 2Test bench material parameters
Component Names | Materials | Density / g.cm-3 | Poisson’s ratio | Young’s modulus / GPa |
Pivot Shaft | 35CrMnSiA | 7.73 | 0.29 | 207 |
pillar | Q550d | 7.85 | 0.28 | 194 |
Moving Beam | Q550d | 7.85 | 0.28 | 194 |
Base | Q550d | 7.85 | 0.28 | 194 |
Based on the connection and contact properties of components in the system, external points are set, and keypoints are established. Grids are then generated for these keypoints. A rigid region is created using the coupling module Coupling/Ceqn. Finally, the model is exported to ADAMS and saved as an MNF (Modal Neutral File). The modal neutral file for the key components of the test bench is illustrated in Fig. 2.
Fig. 2Test bench key components flexible mode file
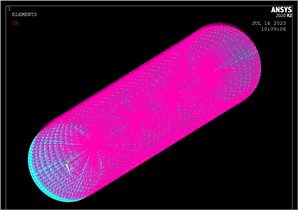
a) Flexible component – pivot shaft
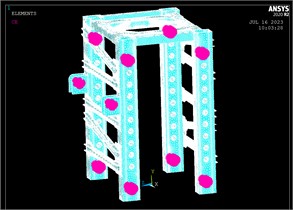
b) Flexible component – pillar
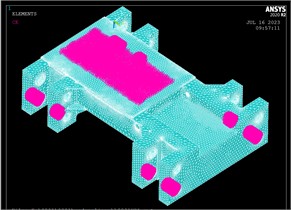
c) Flexible component – moving beam
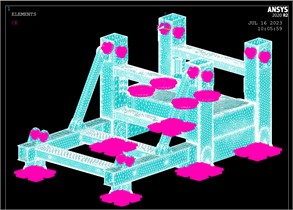
d) Flexible component – base
4.2. Establishment of rigid-flexible coupling model
The three-dimensional solid model's world coordinates serve as the assembly reference and are essential for accurately associating flexible components with the ADAMS multibody dynamics system. The assembly model is imported into ADAMS in X-T format, where the entire multibody dynamics system is initially rigid. To analyze the stress and strain on the key components of the test bench accurately, a rigid-flexible substitution is performed. Based on the world coordinates of the solid model, the positions of flexible components are adjusted. Finally, it is ensured that the external points of the flexible components coincide with the external points of the assembled components [22]. The constraints between the test bench components are outlined in Table 3.
Table 3Test bench component constraint relationship
Serial No. | Constrained component | Constraint mate |
1 | Pivot Shaft and Bushing | Fixed |
2 | Moving Beam and Pivot Shaft | Fixed |
3 | Pillar and Pivot Shaft | Fixed |
4 | Base and Pivot Shaft | Fixed |
5 | Base and Ground | Fixed |
4.3. Shrinkage test strength analysis
The shrinkage test strength analysis is conducted using an external loading approach. The support pillar slowly increases from 0 s to 5 s to the rated working pressure, and it maintains the rated working pressure after 5 s. The external loading cylinder is driven by speed, with zero speed from 0 s to 5 s (meaning the piston rod is stationary, waiting for the pillar to pressurize completely), and from 5 s to 6 s, the speed increases from 0 to 1.5 mm/s (the highest speed according to national standards), then maintains a uniform speed.
Based on the factory inspection shrinkage test standards for hydraulic supports at low, medium, and high positions, taking the ZY5000/15.5/32D hydraulic support as the engineering object, the height is adjusted to 4670 mm for the low-position shrinkage test, as shown in Fig. 3(a). Using the ZY29000/45/100D hydraulic support as the engineering object, the height is adjusted to 7070 mm and 8670 mm for the medium and high-position shrinkage tests, as shown in Figs. 3(b) and 3(c).
Fig. 3Rigid-flexible coupling general assembly model
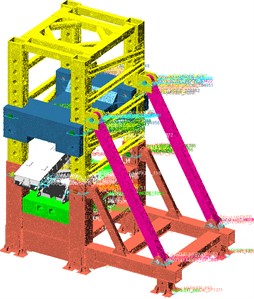
a) Low position assembly model
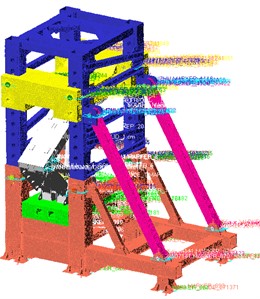
b) Medium position assembly model
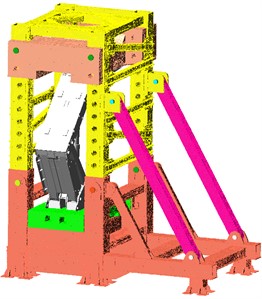
c) High position assembly model
To facilitate the observation and analysis of the stress distribution characteristics of the pivot shaft, a stress threshold is set based on the simulation results. The stress contour plot displaying the maximum stress on the pivot shaft is obtained, as shown in Fig. 4.
From Fig. 4, it can be observed that under the conditions of low, medium, and high-position shrinkage tests, the stress distribution on the pivot shaft is mostly scattered. However, there is a relatively high stress value at the contact point with the pillar, indicating a stress concentration phenomenon. This is a weak point in the pivot shaft. To further analyze the stress and node information at these weak points, the obtained hotspots are listed in Table 4.
Fig. 4Pin stress cloud map
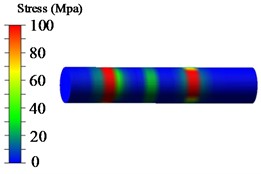
a) Nephogram of low-position allowance shrinkage shaft stress
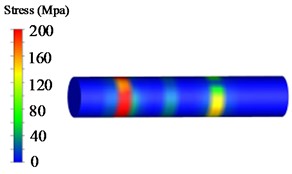
b) Nephogram of medium-position allowance shrinkage shaft stress
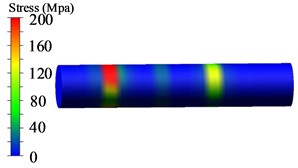
c) Nephogram of high-position allowance shrinkage shaft stress
Table 4Pin hot spot table
Low | Medium | High | ||||
Position stress | ID | Position stress | ID | Position stress | ID | |
1 | 356.6 | 2360 | 308.2 | 2360 | 288.2 | 2360 |
2 | 354.4 | 1984 | 305.3 | 1984 | 286.7 | 3313 |
3 | 352.7 | 1985 | 304.6 | 3313 | 285.9 | 3312 |
4 | 351.2 | 3313 | 303.2 | 1985 | 284.8 | 3311 |
5 | 349.2 | 1986 | 301.9 | 3312 | 283.7 | 3310 |
From Table 4, it can be observed that the maximum stress values under low, medium, and high-position shrinkage conditions are 356.6 MPa, 308.2 MPa, and 288.2 MPa, respectively. The yield strength of the pivot shaft material 35CrMnSiA is 1275 MPa. Therefore, the safety factors under low, medium, and high-position shrinkage test conditions are 3.57, 4.13, and 4.42, respectively, meeting the strength safety requirements of mechanical design.
During the loading process, the test bench pillar undergoes tensile, compressive, horizontal, and other time-varying nonlinear force-coupling effects. The stress contour plots for low, medium, and high-position shrinkage conditions are shown in Fig. 5.
According to Table 4, the maximum stress values under low, medium, and high positions for the shrinkage condition are 356.6 MPa, 308.2 MPa, and 288.2 MPa, respectively. The yield strength of the pin shaft material 35CrMnSiA is 1275 MPa. Consequently, the safety factors under the shrinkage test conditions at low, medium, and high positions are 3.57, 4.13, and 4.42, respectively, meeting the safety requirements for mechanical design strength.
During the loading process, the experimental platform pillar experiences tension, compression, and horizontal time-varying nonlinear force coupling. The stress contour maps under low, medium, and high positions for the shrinkage condition are shown in Fig. 5.
From Figure 5, it is evident that the areas of the sleeve in contact with the pin shaft, the welding area between the reinforcing ribs and the pillar, and the stress at the weld seam of the main pillar plate exhibit relatively higher stress.
To obtain specific stress values in the stress concentration areas, the exported hotspots are presented in Table 5. As shown in Table 5, the maximum stresses under low, medium, and high positions for the shrinkage condition are 131.1 MPa, 75.4 MPa, and 71.5 MPa, respectively. Notably, the pillar stress is highest under the low position shrinkage condition. Based on the yield strength of the pillar material Q550d, the safety factors for the pillar under low, medium, and high positions for the shrinkage condition are 4.19, 7.29, and 7.69, respectively.
Fig. 5Pillar stress nephogram
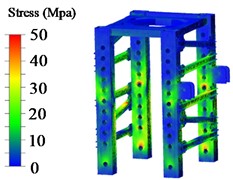
a) Nephogram of low-position allowance shrinkage pillar stress
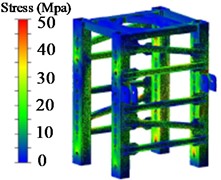
b) Nephogram of medium-position allowance shrinkage pillar stress
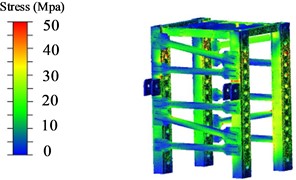
c) Nephogram of high-position allowance shrinkage pillar stress cloud map
Table 5Pillar hot spot table
Low | Medium | High | ||||
Position stress | ID | Position stress | ID | Position stress | ID | |
1 | 133.1 | 42901 | 75.4 | 2214 | 71.5 | 90427 |
2 | 129.5 | 2214 | 74.8 | 42604 | 70.3 | 24537 |
3 | 128.3 | 42604 | 74.2 | 42901 | 67.7 | 22961 |
4 | 127.6 | 89417 | 74.1 | 89417 | 67.3 | 86069 |
5 | 125.1 | 2218 | 72.8 | 42804 | 66.1 | 22960 |
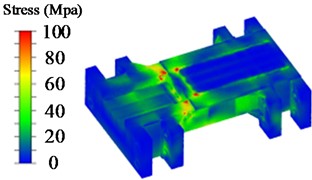
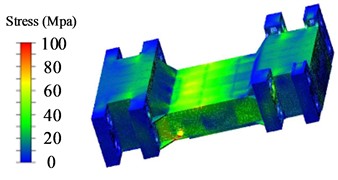
The active beam makes direct contact with the top beam of the test stand and is one of the components directly subjected to force during testing. Its main framework is in the form of a box structure, equipped with 8 dowel holes for adjusting and positioning the active beam. The stress contour map of the active beam in the experimental platform is shown in Fig. 6.
Fig. 6Stress nephogram of moving beam
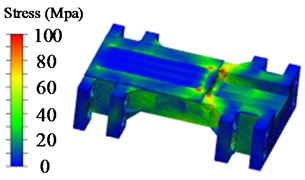
a) Nephogram of low-position allowance shrinkable movable beam stress
b) Nephogram of medium-position allowance shrinkable movable beam stress
c) Nephogram of high-position allowance shrinkable movable beam stress
Table 6Movable beam part hot spot table
Low | Medium | High | ||||
Position stress | ID | Position stress | ID | Position stress | ID | |
1 | 159.7 | 38450 | 152.5 | 38450 | 156.2 | 38450 |
2 | 152.9 | 22609 | 144.6 | 22609 | 147.4 | 22609 |
3 | 146.9 | 22932 | 140.2 | 22932 | 143.8 | 22932 |
4 | 146.1 | 23793 | 138.0 | 23793 | 141.7 | 23793 |
5 | 145.3 | 14978 | 137.3 | 14978 | 141.2 | 14978 |
From Fig. 6, it is observed that the stress values in the transition area of the protrusion, ear plate area, contact area with the tested bracket top beam, rib plate welding area, and upper cover plate area of the active beam are relatively high, indicating varying degrees of stress concentration. The exported hotspots are listed in Table 6. The stress concentration in the transition area of the protrusion, ear plate area, and rib plate welding area can be reduced by rounding corners and using auxiliary welding processes during the output of engineering drawings.
According to Table 6, the stress in the active beam is the lowest during the medium position shrinkage, at only 152.5 MPa, followed by 156.2 MPa during the high position shrinkage, and the maximum stress occurs during the low position shrinkage, reaching 159.7 MPa. Based on the yield strength of the active beam material Q550d, the safety factors for the low, medium, and high position shrinkage conditions are 3.44, 3.60, and 3.52, respectively.
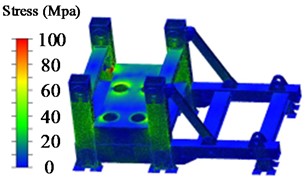
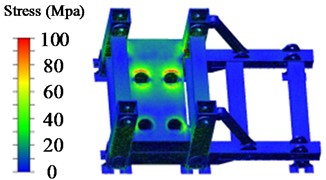
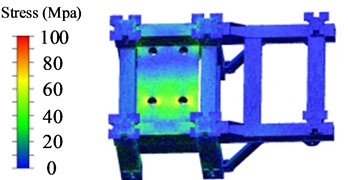
The base supports the test stand and its related equipment, housing four cylinders embedded within it to provide power for vertical external loading of the hydraulic support. When applying vertical external loading, the bottom platform is raised synchronously by the four loading cylinders, driving the bottom platform to load the tested bracket. The stress contour map of the experimental platform base is shown in Fig. 7.
Fig. 7Base stress nephogram
a) Nephogram of low-position allowance shrinkable base stress
b) Nephogram of medium-position allowance shrinkage base stress
c) Nephogram of high-position allowance shrinkable base stress
From Fig. 7, it can be observed that the stress values are relatively high in the contact area between the base pillar and the lower platform, the area where the cylinders are placed on the base plane, and the area of the hydraulic cylinder oil pipe holes, indicating varying degrees of stress concentration. These are considered as weak points in the base. The exported hotspots for the low, medium, and high positions are presented in Table 7.
According to Table 7, under the shrinkage test conditions, the maximum stress values for the low, medium, and high positions are 251.8 MPa, 211.3 MPa, and 215.6 MPa, respectively. Based on the performance parameters of the Q550d material, the safety factors for the base under low, medium, and high position shrinkage conditions are 2.18, 2.60, and 2.55, respectively.
Table 7Base hot spot table
Low | Medium | High | ||||
Position stress | ID | Position stress | ID | Position stress | ID | |
1 | 251.8 | 243983 | 211.3 | 113119 | 215.6 | 113119 |
2 | 220.4 | 271116 | 198.4 | 238364 | 204.9 | 238364 |
3 | 210.4 | 259349 | 191.6 | 238182 | 198.8 | 143630 |
4 | 206.8 | 243985 | 189.8 | 238154 | 197.9 | 238182 |
5 | 202.9 | 261017 | 186.5 | 243938 | 195.6 | 238154 |
5. Fatigue life analysis
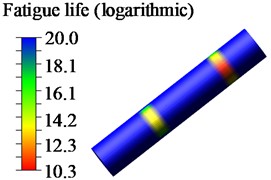
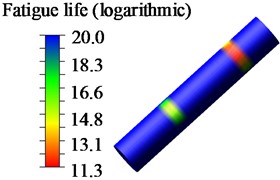
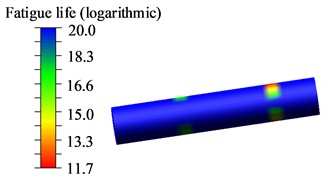
Based on the NSOFT fatigue life analysis method, the von Mises yield criterion and the Goodman correction curve were selected. Utilizing the S-N curve of the material parameters for the experimental platform components, fatigue life and damage values were obtained for each node. The minimum stress cycle count was considered as the final fatigue life of the component. To visually inspect positions with shorter fatigue life, a logarithmic contour map of the fatigue life of the pin shaft on the test stand was obtained, as shown in Fig. 8.
Fig. 8Logarithmic cloud diagram of fatigue life of upper pin
a) Nephogram of low-position allowance shrinkage shaft life
b) Nephogram of medium-position allowance shrinkage shaft life
c) Nephogram of high-position allowance shrinkage shaft life
From Fig. 8, it can be observed that the region with lower fatigue life of the pin shaft appears at the contact area with the pillar sleeve. This location aligns with the stress distribution identified in the strength analysis. Furthermore, the NSOFT fatigue life analysis confirms the accuracy of the strength analysis.
Table 8Fatigue life and damage table of pin joints
Low | Medium | High | ||||
Life | Damage | Life | Damage | Life | Damage | |
1 | 2.1×10¹⁰ | 4.7×10⁻¹¹ | 2.4×10¹¹ | 4.1×10⁻¹² | 5.1×10¹¹ | 1.9×10⁻¹² |
2 | 2.1×10¹⁰ | 4.7×10⁻¹¹ | 2.4×10¹¹ | 4.1×10⁻¹² | 9.4×10¹¹ | 1.1×10⁻¹² |
3 | 2.1×10¹⁰ | 4.7×10⁻¹¹ | 2.4×10¹¹ | 4.1×10⁻¹² | 9.4×10¹¹ | 1.1×10⁻¹² |
4 | 2.1×10¹⁰ | 4.7×10⁻¹¹ | 2.4×10¹¹ | 4.1×10⁻¹² | 9.4×10¹¹ | 1.1×10⁻¹² |
5 | 4.1×10¹⁰ | 2.4×10⁻¹¹ | 2.4×10¹¹ | 4.1×10⁻¹² | 9.4×10¹¹ | 1.1×10⁻¹² |
Based on the results of the life analysis, the fatigue cycle counts and damage values for each node are presented in Table 8. According to Table 8, the fatigue cycle count is the lowest under the low position shrinkage condition, with a value of 2.1×10¹⁰ cycles, and the damage is 4.7×10⁻¹¹, indicating that the pin shaft is close to an infinite life state. It is evident from the strength and fatigue analyses that the higher the stress a component experiences, the lower its fatigue life.
Therefore, based on the strength analysis results, the base with the maximum stress-bearing capacity, made of Q550d material, was selected for fatigue life analysis. The logarithmic contour map of the fatigue life is shown in Fig. 9.
Fig. 9Logarithmic cloud diagram of base fatigue life
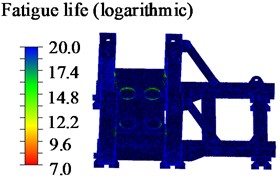
a) Nephogram of low-position allowance shrinkage base life
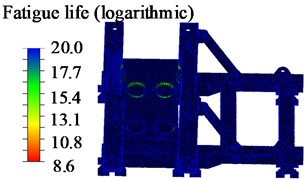
b) Nephogram of medium-position allowance shrinkage base life
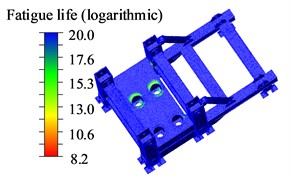
c) Nephogram of high-position allowance shrinkage base life
From Fig. 9, it is evident that the region with lower fatigue life is at the contact area between the cylinder flange plate and the base, as well as at the weld seam of the base pillar. This is attributed to the cylinder serving as an external high-load power source, causing the base flange area to experience prolonged exposure to high pressure and nonlinear forces. To obtain specific fatigue life values, the obtained fatigue life and damage values are presented in Table 9.
Table 9Fatigue life and damage table of base node
Low | Medium | High | ||||
Life | Damage | Life | Damage | Life | Damage | |
1 | 1.1×10⁷ | 8.8×10⁻⁸ | 4.0×10⁸ | 2.5×10⁻⁹ | 1.7×10⁸ | 5.7×10⁻⁹ |
2 | 1.3×10⁸ | 7.7×10⁻⁹ | 1.0×10⁹ | 9.8×10⁻¹⁰ | 5.4×10⁸ | 1.8×10⁻⁹ |
3 | 3.6×10⁸ | 2.8×10⁻⁹ | 1.6×10⁹ | 6.3×10⁻¹⁰ | 1.0×10⁹ | 9.8×10⁻¹⁰ |
4 | 3.6×10⁸ | 2.8×10⁻⁹ | 1.6×10⁹ | 6.3×10⁻¹⁰ | 1.0×10⁹ | 9.8×10⁻¹⁰ |
5 | 4.0×10⁸ | 2.5×10⁻⁹ | 3.1×10⁹ | 3.3×10⁻¹⁰ | 1.0×10⁹ | 9.8×10⁻¹⁰ |
According to Table 9, the fatigue life of the base under the low, medium, and high positions for the shrinkage condition are 1.1×10⁷cycles, 4.0×10⁸ cycles, and 1.7×10⁸ cycles, respectively. The corresponding damage values are 8.8×10⁻⁸, 2.5×10⁻⁹, and 5.7×10⁻⁹, respectively. Among these conditions, the base fatigue life is the lowest under the low position shrinkage, followed by the high position shrinkage, and the highest fatigue life is observed under the medium position shrinkage condition.
6. Shrinkage performance experiment
The 50000 kN hydraulic support test stand, constructed after structural design and strength validation using virtual prototyping technology, is depicted in Fig. 10. The test stand underwent shrinkage performance tests, sealing performance tests, and successfully completed the type test for a 10-meter-high hydraulic support.
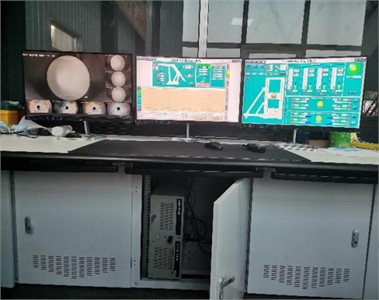
Through the control panel, you can observe the real-time status of the pin shaft position and hydraulic system parameters, as shown in Fig. 11.
Fig. 1050000 kN hydraulic support test bench
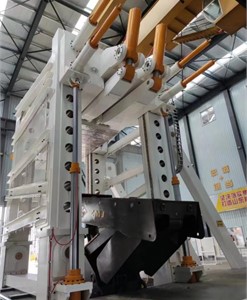
Fig. 11Hydraulic support test bench console
The displacement curve of the external loading cylinder measured during the shrinkage test process is shown in Fig. 12. During both the loading and pressurization phases, all four cylinders operate synchronously and steadily. The observed values closely match the theoretically designed values, indicating the reliable completion of various loading tests.
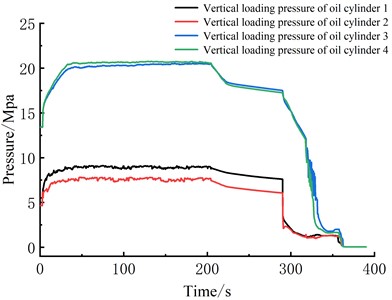
The pressure curve of the external loading cylinder is depicted in Fig. 13. As shown in Fig. 13, the maximum pressure of cylinder 4 is 20.7 MPa. The curve can be divided into three stages: loading, pressurization, and depressurization. It is observed that the pressure values for cylinders 1 and 2, as well as cylinders 3 and 4, are relatively close. This phenomenon is due to the symmetrical structure of the support, resulting in a symmetrical load-bearing capacity on both sides.
Fig. 12Cylinder displacement curve
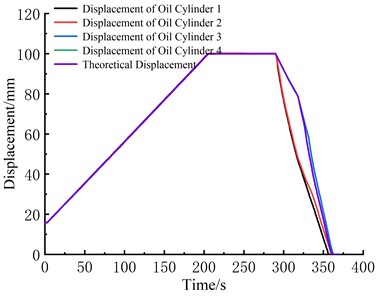
Fig. 13Cylinder pressure curve
7. Conclusions
Utilizing virtual prototyping technology and employing a multi-body dynamics simulation approach, a heavy-duty hydraulic support test stand was designed. Through the NSOFT fatigue life analysis method, the strength and fatigue life during low, medium, and high position shrinkage tests were analyzed. Key areas of high stress and regions with lower fatigue life for critical components were identified, providing practical application references for the design and development of the heavy-duty hydraulic support test stand.
1) Among the three shrinkage conditions, the low position shrinkage exhibited the most severe conditions. In critical components, the pin shaft experienced the highest stress, reaching up to 356.6 MPa, surpassing the stress values in the pillar, active beam, and base by 167.9 %, 123.3 %, and 41.6 %, respectively.
2) Based on the S-N curve of the material parameters for the test stand components and fatigue life analysis, the lowest fatigue life was observed in the base, occurring under the low position shrinkage condition. The minimum fatigue cycle count was 1.1×10⁷, with a damage value of 8.8×10⁻⁸. Further improvement in fatigue life for the base can be achieved through chamfering, enhanced welding processes, and the addition of reinforcing ribs.
3) The virtual prototype model of the rigid-flexible coupled multi-body dynamics hydraulic support test stand laid the foundation for the successful development of the 50000 kN heavy-duty hydraulic support test stand. It provides a new method and means for the fatigue life analysis and prediction of critical components in large industrial equipment under complex working conditions, with broad application prospects.
Finally, although actual engineering test conditions do not meet all the requirements of simulation modeling, the multibody dynamics rigid-flexible coupling and fatigue life analysis methods used in this study exhibit high accuracy in the load analysis of the heavy hydraulic support test bench. Therefore, this method shows promise and contributes to the development and improvement of heavy equipment. Future work will focus on applying advanced materials to the test bench to enhance strength and reduce weight, testing the load variations of key components under various working conditions, improving structural design to increase durability, and developing real-time monitoring systems to better predict and warn against overload behavior, thereby extending the service life of the test bench.
References
-
Zhu Liangchen et al., “Research on hardware-in-the-loop simulation system of powered support,” Coal Science and Technology, Vol. 2023, No. 7, pp. 1–12, Jul. 2023, https://doi.org/10.13199/j.cnki.cst.2023-0453
-
L. Zhao, Y. Wang, and M. Zhang, “Research on self⁃adaptive cutting control strategy shearer in complex coal seam,” Coal Science and Technology, Vol. 47, No. 1, pp. 541–563, 2022.
-
Zhao Lijuan et al., “Fatigue life prediction of shearer rocker shell based on DEM-MFBD bidirectional coupling technology,” Coal Science and Technology, Vol. 2023, No. 10, pp. 1–7, Oct. 2023, https://doi.org/10.13199/j.cnki.cst.2022-1908
-
X. Zheng, “The analysis of fatigue life of hydraulic support test-bed in various working conditions,” Taiyuan University of Technology, 2014.
-
L. Bao and L. Zhou, “Research based on AMESim on dynamic performance of hydraulic system for hydraulic support legs test-bed,” Chinese Hydraulics and Pneumatics, Vol. 2015, No. 2, pp. 70–73, 2015.
-
Y. Liang et al., “Design and calculation of large tonnage hydraulic support test bench and its key parts,” Scientific and Technological Innovation, Vol. 2021, No. 14, pp. 145–146, 2021.
-
H. Liu, “Research on strength and fatigue life of hydraulic support test bench under off-load conditions,” Liaoning Technical University, 2022.
-
H. Du, “Design and research of 50000kN internal and external loading hydraulic support test bench,” Liaoning Technical University, 2022.
-
J. Wang, X. Zhao, and B. Jiang, “Research on middle beam pin shaft node of hydraulic support test bench based on AHP-Fuzzy analysis model,” Coal Science and Technology, Vol. 51, No. 8, pp. 250–259, 2023.
-
J. Wang, L. Li, and X. Hou, “Structural optimization for middle beam plug-in pin shaft of hydraulic support test bench,” Mining and Processing Equipment, Vol. 51, No. 4, pp. 1–5, 2023.
-
N. Rezazadeh, M. de Oliveira, D. Perfetto, A. de Luca, and F. Caputo, “Classification of unbalanced and bowed rotors under uncertainty using wavelet time scattering, LSTM, and SVM,” Applied Sciences, Vol. 13, No. 12, p. 6861, Jun. 2023, https://doi.org/10.3390/app13126861
-
N. Rezazadeh, D. Perfetto, A. de Luca, and F. Caputo, “Ensemble learning for estimating remaining useful life: incorporating linear, KNN, and Gaussian process regression,” in Lecture Notes in Mechanical Engineering, Vol. 2023, Cham: Springer Nature Switzerland, 2024, pp. 201–212, https://doi.org/10.1007/978-3-031-52649-7_16
-
“Powered support for coal mine Part 1: General Technical Conditions,” Standards Press of China, Beijing, National Standard of the People’s Republic of China GB25974.1-2010, 2010.
-
“Coal Mine hydraulic support shield beam loading test technical standard,” Yankuang Donghua Heavy Industry Co., LTD, Jining, Enterprise standard Q/YKZ 0102-2018, 2018.
-
G. Zhu and Z. Chen, “Dynamic behavior of subway vehicles based on flexible multi‐body dynamics,” Engineering Journal of Wuhan University, Vol. 55, No. 8, pp. 840–849, 2022.
-
X. Zenc, W. Sun, and H. Wanc, “Dynamic characteristics analysis of rigid flexible multi-body contact dynamics of main bearing of wind turbine,” Machine Tool and Hydraulics, Vol. 50, No. 3, pp. 145–150, 2022.
-
L. Song, Q. Cui, and J. Zhou, “Fatigue life and dynamic reliability analysis of high-speed shaft bearing of wind power gearbox,” Acta Energiae Solaris Sinica, Vol. 44, No. 8, pp. 437–444, 2023.
-
J. Zhang, Z. Hu, and J. Zhang, “Review of advances in fatigue S-N curve prediction models,” Science Technology and Engineering, Vol. 23, No. 13, pp. 5390–5411, 2023.
-
M. Chen, F. Shao, and H. Yu, “Research on fatigue life prediction model of local stress strain method based on average stress,” Equipment Manufacturing Technology, Vol. 2020, No. 7, pp. 57–60, 2020.
-
S. Dong, Z. Bai, and J. Chang, “Fatigue analysis of HJ-2A/B satellites transportation environment based on acceleration response,” Spacecraft Engineering, Vol. 31, No. 3, pp. 122–129, 2022.
-
Li Haitong, Wu Chongyou, and Mu Senlin, “Formation mechanism of laying angle of vertical rapeseed cutters based on ANSYS-ADAMS,” Transactions of the Chinese Society of Agricultural Engineering, Vol. 36, No. 14, pp. 96–105, 2020.
-
Peng Jing, Li Xutao, and Li Shengli., “Kinematic simulation analysis of hydraulic support based on ADAMS,” Coal Technology, Vol. 42, No. 8, pp. 237–239, 2023.
About this article
The authors would like to acknowledge the support and contribution from the State Key Lab of Mining Machinery Engineering of Coal Industry, Liaoning Technical University, China. This work was supported by the National Natural Science Foundation of China [Grant number 51674134], the Liaoning Provincial Natural Science Foundation of China [Grant number 20170540420], and the Key projects of Liaoning Provincial Department of Education [Grant number LJ2017ZL001].
The datasets generated during and/or analyzed during the current study are available from the corresponding author on reasonable request.
Biao Jiang provided materials, laboratory tools and facilities. Lijuan Zhao planned and supervised the study. Liguo Han assisted with the model analysis and results. Qingqing Pang carried out the simulation model construction, the implementation of the experiment, experimental data analysis, image graphics, manuscript writing and preparation. Qizhang Gao, Na Du assisted with the literature survey. All authors read and commented on the manuscript.
The authors declare that they have no conflict of interest.

