Abstract
In this paper, Numerical simulation analysis was conducted on the ear pressure of a certain vehicle model during door closing process. Firstly, relevant airflow channel parameters are formulated based on the benchmark vehicle data, and transient closing ear pressure simulation calculation is carried out using overset grid technology. Then, the impact of key structural parameters on the interior ear pressure of the car was analyzed. Finally, based on the requirements of actual engineering design, the design scheme for the peak pressure of the car was determined, and the results will be a reference for the development and design of later vehicle.
1. Introduction
With the increasing demand from consumers for vehicle comfort, door closure sound quality, as a performance that consumers can intuitively feel, is receiving more and more attention [1-2]. In the performance design of automobiles, the closure ear pressure, as well as the closure force and sound, is an important performance indicator for door closure sound quality [3]. The ear pressure generated during the door closing process is due to a large amount of air being compressed into the passenger compartment during the door closing process, resulting in air pressure to rise rapidly, and causing discomfort feelings for passengers [4]. Consequently, the sound quality of car door closure is intimately connected to the design of the in-cabin airflow field; changes in this field directly influence the ear pressure sensation and sound quality upon door closure. Optimizing the in-cabin airflow field design can mitigate air pressure fluctuations during door closure, thereby enhancing comfort.
Traditionally, CFD simulation is employed to optimize the size and shape of the pressure relief valve, aiming to regulate cabin pressure changes. However, this approach is plagued by the need for repetitive rework and inefficiency. This paper utilizes computational fluid dynamics (CFD) with the overset mesh method [3] and NVH technology to identify key transient airflow paths. It provides a detailed analysis and quantification of the impact of airflow channel layout, interior and sheet metal distance control, and airflow channel area on the transient peak pressure during the door closing process. The research findings offer an optimization direction and solution for swiftly addressing the ear pressure issue during door closure, thereby improving the sound quality and passenger comfort of vehicle door closures. Additionally, the findings can facilitate rapid iteration and optimization in the whole vehicle pressure relief valve design, preventing NVH issues, reducing R&D tuning costs, and expediting the vehicle development process.
2. CFD simulation analysis
2.1. CFD model
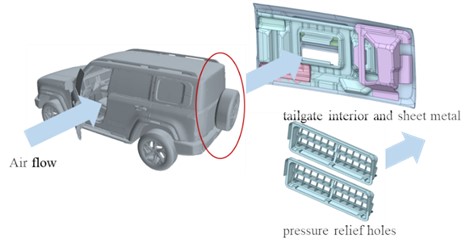
The analysis object is a complete vehicle model of a certain SUV, which includes body sheet metal, the interior and exterior decoration of the body, exterior decoration of the driver’s side door, interior and sheet metal of the tailgate, pressure relief holes, seats, etc. Variation of pressure in the cabin with time during the driver’s door closing process is analyzed, the main air flow channel is from the passenger compartment through the tailgate interior and sheet metal, and from the tailgate with a pressure relief holes.
Fig. 1Air flow inside the car during the door closing process
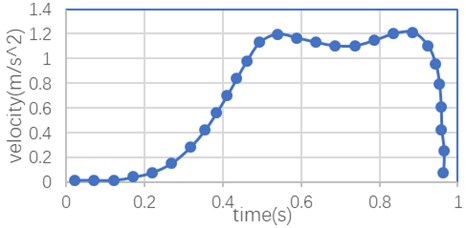
The input parameter for simulation analysis is the door closing speed, and the testing equipment is the door closing ear pressure measurement system. The testing method is conducted according to the door closing sound quality testing standard (Enterprise Standard). The test result is the curve of the door closing speed relative to the angle change, and the closing speed curve of different closing forces acting on the door can be obtained. In this article, the input parameter for simulation model is the actual closing speed curve based on 1.2 m/s when the door is fully open. The pressure change inside the car is calculated during the door closing process, and the closing speed curve is shown in Fig. 2.
Fig. 2Speed curve during door closing process
The pressure change inside the car during the closing process is a transient process, as the continuous movement of the door needs to be considered in the analysis. Therefore, the simulation analysis adopts the overset mesh method. The overset mesh method is broadly used in unsteady moving body simulation for its benefits of high grid quality and low difficulty in grid generation [5].
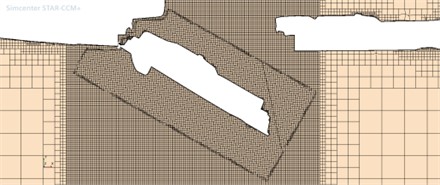
The entire fluid domain is divided into the main body area and the secondary passenger side door area. The air in the passenger compartment is compressed during the door closing process, and the pressure continuously changes with the door closing process. The mesh type is trim, and multi-layer refinement is used around the overlapping zones to ensure the quality of the overset mesh. To accurately calculate the impact of changes in the tailgate structure on the peak pressure inside the passenger compartment, grid refinement is required in the area near the door position and tailgate pressure relief channel.
Fig. 3Mesh refinement zone of body and door
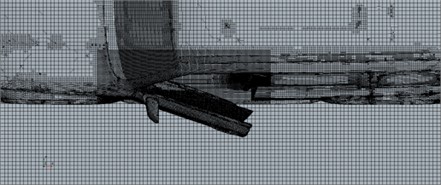
Fig. 4Mesh cross-section of overset zone
2.2. Simulation results
The airflow channel of the entire vehicle is the main outlet for the airflow inside the cabin during the door closing process. The layout of the channel and the effective pressure relief area of the channel are the main factors affecting the maximum pressure level inside the vehicle. The airflow flow channel at the tailgate position is that the airflow flows through the interior of the tailgate to the tailgate sheet metal, through the opening on the inner side of the tailgate sheet metal to the inside of the sheet metal, then flows through the inside of the sheet metal to converge in front of the pressure relief holes, and finally flows out through the pressure relief holes.
Fig. 5The air flow channel of tailgate during the door closing process
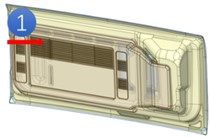
a) Interior of the tailgate
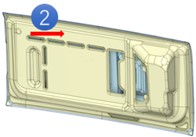
b) Tailgate sheet metal
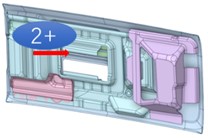
c) Tailgate sheet metal in detail
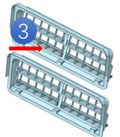
d) Pressure relief holes
The parameters in the airflow channel in the initial analysis model are: 1) channel 1 is the tailgate interior, with a flow area of 21600 mm2. 2) Channel 2 is a tailgate sheet metal opening. 3) Channel 2+ is an internal opening in the sheet metal, with an equivalent flow area of 29000 mm2. 4) Channel 3 is a pressure relief holes opening, with an equivalent flow area of 29000 mm2.
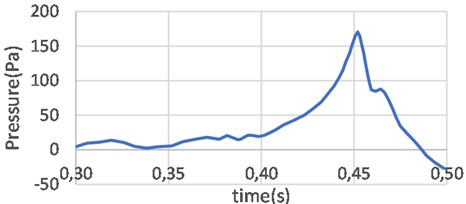
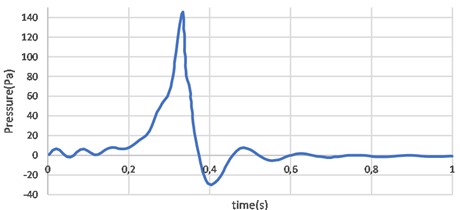
The calculation results of the CFD model show that the ear pressure at the passenger’s position will sharply increase to a peak at the beginning of the door contact sealing strip and then steadily decay during the door closing process. Due to the main flow direction of the airflow flowing from the front to the rear during the door closing process, the pressure fluctuation at the driver’s position reaches its peak first, and the peak pressure at the rear passenger’s position is slightly delayed. The simulation results show that the maximum value of ear pressure in the passenger compartment for the driver’s position is 158.9 Pa, and the maximum value for the rear passenger position is 170.7 Pa, which is close to the design upper limit. The ear pressure variation curve of 0.3 s-0.5 s is shown in the following Figs. 6, 7.
Fig. 6The ear pressure variation curve of driver’s position
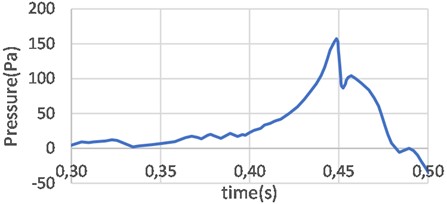
Fig. 7The ear pressure variation curve of rear passenger’s position
To ensure that the peak pressure meets the design requirements, an analysis is conducted on the impact of variations in parameters such as the distance between interior and the sheet metal of the tailgate, and the area of the pressure relief holes opening, on the changes in ear pressure inside the vehicle.
(1) Distance between interior and the sheet metal of the tailgate. Under the condition that the thickness of the tailgate remains unchanged, the peak pressure variation curve can be calculated for different distances between the interior and the sheet metal of tailgate. Closing the distance between the sheet metal and the interior of tailgate can decrease the pressure difference between the sheet metal and the pressure relief holes, but it will increase the pressure difference between the sheet metal and the interior. Conversely, the opposite is also true. By conducting comparative calculations, a relatively optimal range of spacing can be determined. By comparing the analysis results, the relatively optimal distance can be obtained.
Fig. 8Comparison of peak pressure of different distance between interior and sheet metal
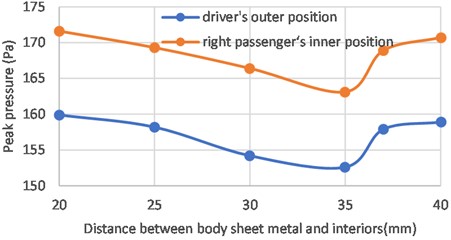
The peak pressure at distances of 20 mm, 25 mm, 30 mm, 35 mm, 37 mm, and 40 mm was calculated, with a focus on the front driver’s and right rear passenger’s position. The calculation results show that as the distance between the interior panel and the sheet metal increases, the peak pressure at both the driver and passenger positions shows a trend of decreasing first and then increasing, and the peak pressure inside the vehicle reaches its lowest when the distance is 35 mm.
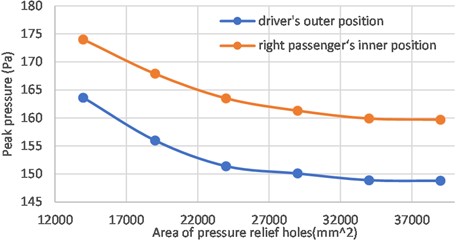
(2) Area of pressure relief holes. In the initial design, the flow area of the pressure relief hole was 29000 mm2, the increase in the flow area of the pressure relief holes can optimize the ear pressure inside the car, but due to the influence of the airflow channel inside the car, the decrease in peak pressure does not linearly change with the increase in the flow area of the pressure relief holes. Therefore, a total of multiple sets of pressure relief holes were calculated to determine the peak pressure in the vehicle, with an area distribution of 14000 mm2, 1900 mm2, 24000 mm2, 29000 mm2, 34000 mm2, 39000 mm2.
The calculation results show that, on the premise that the flow area of the sheet metal and interior remains unchanged, the peak pressure decreases continuously with the increase of the relief holes area, but it does not maintain a linear change.
Table 1Comparison of ear pressure peaks under different relief holes areas
Area of pressure relief holes (mm2) | 14000 | 19000 | 24000 | 29000 | 34000 | 39000 |
Driver’s outer position | 163.6 | 156.0 | 151.4 | 150.1 | 148.9 | 148.8 |
Right passenger’s inner position | 174.0 | 167.9 | 163.5 | 161.3 | 159.9 | 159.7 |
Fig. 9Comparison of peak pressure of different area of pressure relief holes
3. Optimization results
After comparing multiple design schemes, the final pressure curve at both the driver’s and passenger’s positions is shown in the following Figs. 10, 11. The peak ear pressure of the driver’s position is 140 Pa, and the peak ear pressure of passenger positions is 148.3 Pa, the peak pressure at each monitoring point does not exceed the ear pressure comfort range.
Fig. 10The pressure curve of driver’s position
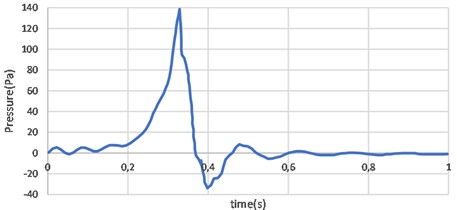
Fig. 11The pressure curve of passenger’s position
4. Conclusions
Numerical simulation analysis was conducted on the ear pressure of a certain vehicle model during door closing process. Firstly, relevant airflow channel parameters are formulated based on the benchmark vehicle data, and transient closing ear pressure simulation calculation is carried out using overset grid technology. Then, the impact of key structural parameters on the interior ear pressure of the car was analyzed. Finally, based on the requirements of actual engineering design, the design scheme for the peak pressure of the car was determined, and the results will be a reference for the development and design of later vehicle.
References
-
Y. L. Lee and S. H. Hwang, “Flow characteristics in a cabin during door closure,” Proceedings of the Institution of Mechanical Engineers, Part D: Journal of Automobile Engineering, Vol. 225, No. 3, pp. 318–327, Mar. 2011, https://doi.org/10.1177/09544070jauto1325
-
S. J. Siavoshani and V. Prasad, “Door closing sound quality methodology – airborne and structural path contributions,” SAE International Journal of Passenger Cars – Mechanical Systems, Vol. 8, No. 3, pp. 2015–1, 2015.
-
S. Li, C. Chen, X. Hu, and J. Cao, “Numerical simulation research on pressure during door closure of commercial vehicle,” SAE International Journal of Commercial Vehicles, Vol. 10, No. 2, pp. 453–459, Jun. 2017, https://doi.org/10.4271/2017-01-9182
-
A. Rolim, F. Camargo, M. Boczko, and R. Osti, “Bumper on striker: improve customer perception regarding door closing sound quality,” SAE Technical Paper, 2017.
-
X. Da, Y. Tao, and Z. Zhao, “Virtual flight Navier-Stokes solver and its application,” Procedia Engineering, Vol. 31, pp. 75–79, Jan. 2012, https://doi.org/10.1016/j.proeng.2012.01.993
About this article

The authors have not disclosed any funding.
The datasets generated during and/or analyzed during the current study are available from the corresponding author on reasonable request.
The authors declare that they have no conflict of interest.
