Abstract
The phenomena of miosis (constriction) and mydriasis (dilation) of the pupil are exhibited in response to varying levels of light intensity cast upon the eye. In general, the size and responsiveness of the human pupil are under the regulatory purview of the nervous system. Consequently, the study of the pupil offers a means to discern potential abnormalities in the human organism, as it permits an assessment of the nervous system’s behavior. However, the comprehension of pupillary dynamics remains incomplete in certain facets, and methodologies for enhancing diagnostic precision continue to evolve, primarily contingent upon current technological equipment advancements. Thus, the imperative lies in the advancement of technologies that meet these research needs, as the scrutiny of pupillary responses holds the capability to detect anomalies within the human body. Hence, the objective of this endeavor is to conduct preliminary trials of a dynamic pupillometry system, designed to both stimulate and capture images of human pupils, facilitating an investigation into their behavioral patterns. The findings elucidate various pupillary parameters and reveal significant alterations in pupillary conduct, thereby contributing to the advancement of research and technologies within the realm of pupillometry. Thus, this study undertakes an innovative exploration into pupillometry, particularly regarding stimuli of varying wavelengths, thereby providing improvements on the diagnostic, prognostic and preventive capacity with heightened reliability, given the pupil’s size and its reactions cannot be manipulated or falsified since they are involuntary.
1. Introduction
The measurement of pupil size represents a non-invasive technique known as pupillometry, allowing the quantitative assessment of pupillary behavior under varying light conditions [1].
In a simplified form, incident light initially interacts with the cornea before traversing the pupil. Subsequently, the lens of the eye refracts the light onto the retina, which contains photoreceptor cells responsible for transforming the light stimuli into electrochemical impulses. Finally, these pulses are conveyed via the optic nerve to the brain where they undergo decoding by the nervous system to form images [2]. Fig. 1 depicts illustrates key anatomical structures of the human eye involved in the passage of light.
Fig. 1Anatomy of the human eye [3]
![Anatomy of the human eye [3]](https://static-01.extrica.com/articles/24131/24131-img1.jpg)
The pupillary light reflex serves as a way for regulating the influx of light into the eyes. Elevated light levels prompt a reduction in pupil size (miosis), thereby restricting light entry, whereas diminished light levels induce pupil dilation (mydriasis), allowing more light penetration.
In addition to the pupillary light reflex, the pupil exhibits an involuntary pulsatile movement termed hippus, arising from the interplay of excitatory and inhibitory signals transmitted by the nervous system. The hippus, also known as or pupillary athetosis, manifests as continual fluctuations in pupil diameter of approximately 3 % and a frequency of approximately 0.2 Hz, irrespective of alterations in light exposure [4].
The stimuli transmission through the optic nerve traverses a region known as the optic chiasm (Fig. 2). Here, there is a crossing of nerve fibers between the optic nerves, whereby roughly half of the fibers from the right optic nerve project to the left optic nerve and vice versa. This arrangement facilitates bilateral reflection of stimuli, such that an applied stimulus in one eye elicits a corresponding response in the contralateral eye. This physiological function is referred to as “consensus reflex” [5].
Fig. 2Chiasm optical responsible for consensual reflection [6]
![Chiasm optical responsible for consensual reflection [6]](https://static-01.extrica.com/articles/24131/24131-img2.jpg)
The regulation of human pupillary size and responsiveness to light is governed by the coordinated action of the sphincter muscle, responsible for its contraction and dependent on the parasympathetic nervous system, and the dilator muscle, under the control of the sympathetic nervous system [7]. Consequently, alterations in pupil size stem from the dynamic interplay between the sympathetic and parasympathetic nervous systems [8].
Thus, the use of pupillometry serves as a valuable tool for identifying abnormalities in the human body enabling the evaluation of autonomic nervous system’s behavior [9] and may have several clinical applications [10].
Although current utilization of pupillometry in most ophthalmic clinics primarily revolves around its utility in surgical settings, its scope has considerably broadened over recent decades. This expansion spans both basic research and clinical practice due to the growing evidence that confirms the use of pupillary response as an objective physiological marker and noninvasive of the normal and abnormal functioning of the central nervous system [11] and indicative of various diseases [12].
Pupillometry has been demonstrated to be applicable in identifying individuals under the influence of drugs, as drug consumption can interfere with the nervous system functions, thereby altering pupil responsiveness to light. Numerous studies in the literature have correlated pupillary data with the use of different drugs [13-18].
The increased prevalence of drugs beyond alcohol has garnered increased attention as a potential threat to road safety, as underscored by several authors [19-21]. While alcohol remains the most frequently encountered psychoactive substance in fatal traffic accidents, other substances—whether legal or illicit, such as marijuana, amphetamine derivatives, opiates, and benzodiazepines-have also been commonly detected [22], [23].
One of the few studies conducted in Brazil revealed a 7 % prevalence of drugs detected in urine analyses of truck drivers, indicative of recent usage without necessarily implying impairment, alongside a 3 % incidence detected via blood tests, suggesting active influence of drugs. Ethanol emerged as the most commonly detected substance, followed by amphetamines, used primarily to maintain wakefulness [24].
It was found a high incidence of accidents related to excessive sleepiness negatively affecting public safety. Several studies have demonstrated the efficacy of pupillometry in detecting drowsiness and fatigue states successfully [25-27], [11].
Hence, the implementation of a dedicated pupillometry system for detecting sleep and/or drug-related effects would significantly enhance diagnostic, prognostic, and preventive capabilities, thereby constituting a technological innovation, because although there are devices that measure the pupillary variation, it was not found any currently marketed models that are able to detect if a person is in its normal state, as a nervous system capable of carrying out high-risk activities, such as driving, for example. It should be noted the high reliability of this test, since the size of the pupil and their reactions cannot be manipulated or falsified, by them being involuntary and unconscious.
Thus, this paper presents a preliminary investigation into the development of a stimulation and capture system for pupillary response utilizing stimuli of varying wavelengths within the visible spectrum. Additionally, the development of an algorithm capable of analyzing the acquired pupil size data is outlined.
2. Methodology
In literature many works and equipment can be found related to pupil analysis, such as [1], [4], [28-31]. Leveraging insights gleaned from this literature, we devised hardware tailored to the stimulation and capture of pupillary dynamics. Subsequently, a software solution was developed utilizing computer vision techniques, able to process captured images (frames) of the human eye to discern variations in pupil area over time. Subsequent sections elaborate on the intricacies of these two developmental stages of the pupillometry system.
2.1. Hardware development
For image acquisition, an infrared camera (IR) was employed. This choice was predicated on the necessity to capture images under low visible light conditions and to accentuate the contrast between darkly pigmented irises and the pupil.
Notably, infrared illumination elicits no pupillary response [28], ensuring that the results pertaining to pupil size remain unaffected by IR light.
Aspects regarding image capture were addressed in this paper, given the absence of consensus in the literature regarding the optimal parameters for pupillometry. Thus, these details will be shown in the discussion of results.
Regarding the light stimuli, [32] it was demonstrated that stimuli of varying wavelengths or intensities, upon reaching different regions of the retina, elicit distinct responses from receptors, consequently inducing varied degrees of pupillary constriction.
Thus, the initial prototype incorporates diverse stimuli within the visible spectrum, encompassing red, blue, and green wavelengths, each with adjustable intensity levels. To provide light stimulation to the human eye and observe the response of the pupil, an illumination system composed of LEDs was developed. The control of the flashes fired by LEDs was implemented using a microcontroller (MSP430G2452/Texas Instruments), programmed by the Code ComposerTM Studio.
The lighting system consists of first lighting an infrared LED that will remain lit, illuminating the eye filmed during the whole process of data acquisition. After the period of pupillary accommodation the system triggers a blue LED. Subsequently, the blue LED goes off and two blue LEDs are lit. This process will be repeated for the other two-color LEDs (green and red). Therefore, for each individual it is obtained a total of 6 pupillary responses (two different intensities for the 3 kinds of wavelengths).
The illumination range of each LED is next to the largest absorption wavelengths of the cones (cells in the retina), Fig. 3.
Fig. 3Sensitivity of the cones [33]
![Sensitivity of the cones [33]](https://static-01.extrica.com/articles/24131/24131-img3.jpg)
The arrangement of the lighting system was made for LEDs of each color to stay arranged in such a way that would enable all colors to influence the eye in an equivalent manner. The distance between the position of the eye and the center of the lighting apparatus is about 0.1 meter. According to [1], even when only one eye receives stimulus, reaction in both pupils is observed. This action is known as a consensual response and is due to optic chiasm.
Thus, the mechanical components are designed so that the light stimulus is issued in the left eye and the equipment to capture images of the pupillary response of the right eye.
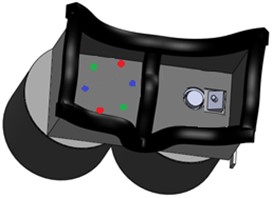
The designed hardware and its components are shown in Fig. 4. It’s possible to observe two cylinders where there will be encased part of the camera, LEDs, wires and the microcontroller. It is also observed the facial plug which seals the face so that no external light stimulus can influence in the tests.
Fig. 4Prototype designed
2.2. Software development
Computational techniques, properly applied, may be a promising way for the efficient detection and diagnosis of diseases studied nowadays. In the case of disorders associated with viewing this is no different.
Thus, in this study a software was developed, compiled with Microsoft Visual C ++ Express Edition with the OpenCV (Open Source Computer Vision Library) for image analysis of the eye of an individual in order to evaluate the variation process of pupil size when subjected to a light stimulus.
OpenCV is a library that enables the implementation of computer vision tools. It is written in C or C ++ and runs on Linux, Windows and Mac OS X. One of the goals of the OpenCV computer vision library is to provide an infrastructure that helps people to quickly implement various techniques in image or video input [34].
This work, as many other stakeholders in the eye dynamic, focuses on computer vision techniques for the detection of circular shapes of the eye. The most widely used and commonly recommended form involves the use of circular Hough Transform.
The Hough transform is a method for finding lines, circles or other shapes parameterized [34] and this algorithm is implemented in the library openCV.
The underlying algorithm is handling the frames captured by the camera used in this and subsequent manipulation, isolation of colors to finally define geometries understood by one color in question in the presence of contrast and thereby obtain object desired exposed on screen. In other words, the basic algorithm for the software of the developed task of being able to detect an object that is in contrast and define its geometry, in this case, the size of the pupil.
3. Results and discussion
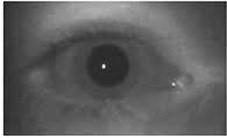
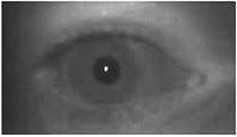
Pupil images, obtained using the apparatus designed with the IR camera, without visible light stimulus (a) and with the light stimulus (b) are shown in Fig. 5.
Fig. 5a) Pupil image without light stimulus and b) with light stimulus
a)
b)
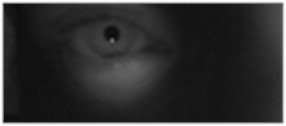
The results after implementing the program can be seen in Fig. 6 illustrating separately the windows displaying the software running.
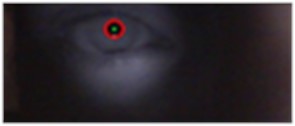
Fig. 6(a) shows the image processed by the infrared camera. Fig. 6(b) illustrates a window of the software at the time that occurs the Hough Transform function for circles location that is performed in order to distinguish the region of the pupil in relation to other objects. It notes that as the pupil changes its approximate diameter, the red circle that distinguishes it from other elements tends to accompany this change, which allows a view of the pupil ratios. Fig. 6(c) and (d) exposes the images presented previously, but in black/white and contour detection, allowing easy pupil circle distinction in relation to any other geometry observed in the image, in other words, any other element of the face, the same as the iris, which is also circular.
Fig. 6a) Pupil image acquired by the camera and b) detection of circles made by the software; c), d) images in black/white and contour detection
a)
b)

c)

d)
In literature there is still divergence of information as to which image capture rate is more suitable for pupillometry and works using some different rates is shown in Tab. 1. Thus, this study addressed this aspect, in order to see if there is considerable difference between the acquired values.
Table 1Literature data about the pupil image capture rate
Literature | Capture rate (frames/second) |
[4] | 15 |
[28] | 30 |
[30] | 24 |
[35] | 30 |
[36] | 25 |
Tests with different pupillary image capture rates were carried out simultaneously, three videos and during them there were no visible light stimuli. The place had low visible illumination intensity, but as the pupil is very sensitive to variation in brightness and an oscillation size always exist (hippus) it was necessary to position three cameras with different capture rates and the same resolution to capture the same movement of the pupil. A camera captured videos with 15 frames per second (fps), another with 30 fps and the last with 60 fps. These values were chosen based on the ranges found in the literature and results are shown in Fig. 7, where it is possible to observe the variation of pupillary area (in the unit px2, being “px” the side of a pixel).
Fig. 7Graph of pupillary area x time for different image capture rates
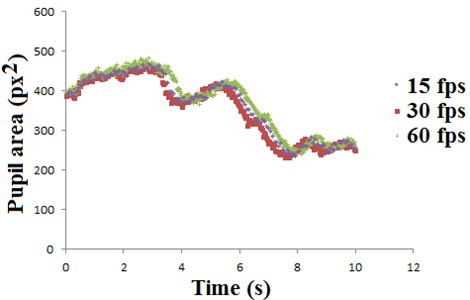
Given the results presented in Fig. 7, one can notice a slight difference between the curves, especially in times between 3 to 4 seconds and 6 to 8 seconds, which are the periods where a greater decrease in pupillary area occurs. One cause for this difference can occur due to having 03 different cameras and each being a different angle relative to the pupil. Anyway, the results for the different image capture rates are very close even in these times.
Thus, the results below were with capture rate of 30 frames per second, a rate that will not generate a high computational cost and reliability features.
The results shown in Fig. 6 it is possible to observe the clear distinction of the iris and the pupil, and because this is possible to quantitatively obtain the area of the pupil of the variation with respect to time. Thus, videos were obtained when the pupil is subjected to intermittent light stimulation with variable intensity and wavelength, Fig. 8. The lighting system consists in first lighting infrared LED that will remain illuminated, illuminating the eye for all the process of data acquisition. After, the system gives a pulse of light with only a blue LED. Thereafter, when the blue LED is off, there is a period with no visible light (about 10 seconds) and another pulse of light is given, now with two blue LEDs. This process is repeated for the green LEDs and red LEDs for the order with the same time intervals and the same light pulse (about 1 second).
Fig. 8Graph of pupillary area x time
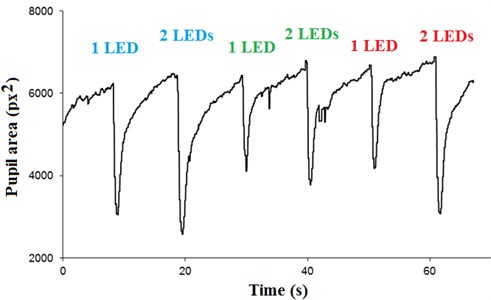
When comparing the light intensities, it is observed that there is greater constriction of the pupil area of the greater intensity on stimuli, so, two LEDs (regardless of visible wavelength) will cause pupil constriction greater than just the same length LED wave. Yet from this perspective, it is observed that there is no significant difference in pupillary constriction when the eye is illuminated by a green LED and two green LEDs.
Comparing the wavelengths, it was realized that two red LEDs cause the same pupillary constriction that a blue LED and the lower pupillary area is obtained when the eye is illuminated by two blue LEDs.
The graph also shows that the pupil constriction occurs with greater speed compared to pupillary dilation.
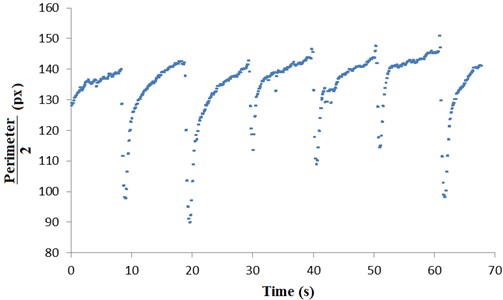
Finally, Fig. 9 shows the same result as above, however, considering the uncertainty. As the area we want to know the size (pupil) has the next form of a circle and the pixels have quadrangular format, our main mistake is in relation to approaching these areas. Thus, the uncertainty will be considered half of the pupil perimeter for each time point (frame).
Fig. 9Graph of uncertainty
4. Conclusions
This study aimed to investigate neurovisual alterations and underscored the significance of devising techniques that could be used for both diagnosis and monitoring treatment. Additionally, some key physiological aspects were highlighted that helped on the design and development of the study.
Thus, based on the understanding of the need for more specialize equipment for specific to study the dynamics of vision, and knowledge of the challenges of development thereof, the work shows the design and assembly of a device that stimulates neurovisual system and provides images of the pupil at different times and processes providing quantitative information on the pupillary reflex.
Consequently, the results show that the devised system provides preliminary subsidies for various studies involving the dynamics of the vision and development of equipment for pupillary measurement.
References
-
J. K. S. Souza, “Construção de uma Plataforma Configurável para Aquisição de Imagens com Aplicações Pupilométricas,” Universidade Federal de Minas Gerais, Belo Horizonte, 2012.
-
P. D. R. Gamlin, McDougal, H. David, A. Darlene, J. C. Beshaese, and R. Dana, Encyclopedia of the Eye. Oxford: Academic Press, United States, 2010.
-
“Anatomia do olho.” Compuland, http://www.compuland.com.br/anatomia/olho
-
G. N. S. M. Leal, “Desenvolvimento de um pupilómetro,” Faculdade de Ciências e Tecnologia da Universidade Nova de Lisboa, Lisboa, 2008.
-
R. D. Lund, H. Klassen, and M. J. Young, “Retinal transplantation and the pupillary light reflex,” Nervous Control of the eye, Vol. 13, pp. 248–274, 2000.
-
D. Purves et al., Neurociências. Universidade Federal de Sao Paulo, 2022.
-
A. Hachol et al., “Measurement of pupil reactivity using fast pupillometry,” Physiological Measurement, Vol. 28, No. 1, pp. 61–72, Jan. 2007, https://doi.org/10.1088/0967-3334/28/1/006
-
D. F. Fotiou, V. Stergiou, D. Tsiptsios, C. Lithari, M. Nakou, and A. Karlovasitou, “Cholinergic deficiency in Alzheimer’s and Parkinson’s disease: Evaluation with pupillometry,” International Journal of Psychophysiology, Vol. 73, No. 2, pp. 143–149, Aug. 2009, https://doi.org/10.1016/j.ijpsycho.2009.01.011
-
F. Fotiou, “Changes in psychophysiological processing of vision in myasthenia gravis,” International Journal of Psychophysiology, Vol. 29, No. 3, pp. 303–310, Aug. 1998, https://doi.org/10.1016/s0167-8760(98)00005-1
-
A. E. Sargsyan, D. R. Hamilton, S. L. Melton, D. Amponsah, N. E. Marshall, and S. A. Dulchavsky, “Ultrasonic evaluation of pupillary light reflex,” Critical Ultrasound Journal, Vol. 1, No. 2, pp. 53–57, Oct. 2009, https://doi.org/10.1007/s13089-009-0012-9
-
J. K. S. de Souza, M. A. D. S. Pinto, P. G. Vieira, J. Baron, and C. J. Tierra-Criollo, “An open-source, FireWire camera-based, Labview-controlled image acquisition system for automated, dynamic pupillometry and blink detection,” Computer Methods and Programs in Biomedicine, Vol. 112, No. 3, pp. 607–623, Dec. 2013, https://doi.org/10.1016/j.cmpb.2013.07.011
-
C. J. Ellis, “The afferent pupillary defect in acute optic neuritis,” Journal of Neurology, Neurosurgery and Psychiatry, Vol. 42, No. 11, pp. 1008–1017, Nov. 1979, https://doi.org/10.1136/jnnp.42.11.1008
-
K. N. Ogle, R. A. Whisnant, and J. B. Hazelrig, “Quantitative study of pupil response to miotic drugs,” Investigative Ophthtilmology, Vol. 5(2), Vol. 5, No. 2, pp. 176–185, 1966.
-
C. E. Bye, M. Clubley, T. Henson, A. W. Peck, S. A. Smith, and S. E. Smith, “Changes in the human light reflex as a measure of the anticholinergic effects of drugs. A comparison with other measures,” European Journal of Clinical Pharmacology, Vol. 15, No. 1, pp. 21–25, Jan. 1979, https://doi.org/10.1007/bf00563554
-
R. B. Murray and M. H. Loughnane, “Infrared video pupillometry: A method used to measure the pupillary effects of drugs in small laboratory animals in real time,” Journal of Neuroscience Methods, Vol. 3, No. 4, pp. 365–375, Apr. 1981, https://doi.org/10.1016/0165-0270(81)90024-8
-
S. G. Giakoumaki, E. Hourdaki, V. Grinakis, K. Theou, and P. Bitsios, “Effects of peripheral sympathetic blockade with dapiprazole on the fear-inhibited light reflex,” Journal of Psychopharmacology, Vol. 19, No. 2, pp. 139–148, Jul. 2016, https://doi.org/10.1177/0269881105048994
-
M. N. Haider, D. Regan, M. Hoque, F. Ali, and A. Ilowitz, “Effects of recent cannabis consumption on eye-tracking and pupillometry,” Frontiers in Neuroscience, Vol. 18, Apr. 2024, https://doi.org/10.3389/fnins.2024.1358491
-
E. L. Jolkovsky, F. E. Fernandez‐Penny, M. Alexis, L. N. Benson, B. H. Wang, and B. S. Abella, “Impact of acute intoxication on quantitative pupillometry assessment in the emergency department,” Journal of the American College of Emergency Physicians Open, Vol. 3, No. 5, Oct. 2022, https://doi.org/10.1002/emp2.12825
-
O. H. Drummer et al., “The involvement of drugs in drivers of motor vehicles killed in Australian road traffic crashes,” Accident Analysis and Prevention, Vol. 36, No. 2, pp. 239–248, Mar. 2004, https://doi.org/10.1016/s0001-4575(02)00153-7
-
E. W. Schwilke, M. I. Sampaio Dos Santos, and B. K. Logan, “Changing patterns of drug and alcohol use in fatally injured drivers in Washington State,” Journal of Forensic Sciences, Vol. 51, No. 5, pp. 1191–1198, Sep. 2006, https://doi.org/10.1111/j.1556-4029.2006.00239.x
-
J. C. Ponce and V. Leyton, “Drogas ilícitas e trânsito: problema pouco discutido no Brasil,” Archives of Clinical Psychiatry (São Paulo), Vol. 35, pp. 65–69, Jan. 2008, https://doi.org/10.1590/s0101-60832008000700014
-
Carmen Del Río and M., “Presence of illegal drugs in drivers involved in fatal road traffic accidents in Spain,” Drug and Alcohol Dependence, Vol. 57, No. 3, pp. 177–182, Jan. 2000, https://doi.org/10.1016/s0376-8716(99)00042-3
-
P. Holmgren, A. Holmgren, and J. Ahlner, “Alcohol and drugs in drivers fatally injured in traffic accidents in Sweden during the years 2000-2002,” Forensic Science International, Vol. 151, No. 1, pp. 11–17, Jun. 2005, https://doi.org/10.1016/j.forsciint.2004.06.031
-
M. Yonamine, “A saliva como espécime biológico para monitorar o uso de álcool, anfetamina, metanfetamina, cocaína e maconha por motoristas profissionais,” Universidade de Sao Paulo, Agencia USP de Gestao da Informacao Academica (AGUIA), São Paulo, Jun. 2023.
-
O. Lowenstein, R. Feinberg, and I. E. Loewenfeld, “Pupillary movements during acute and chronic fatigue,” Investigative Ophthalmology, Vol. 2, No. 2, 1963.
-
B. Wilhelm, H. Giedke, H. Lüdtke, E. Bittner, A. Hofmann, and H. Wilhelm, “Daytime variations in central nervous system activation measured by a pupillographic sleepiness test,” Journal of Sleep Research, Vol. 10, No. 1, pp. 1–7, Mar. 2001, https://doi.org/10.1046/j.1365-2869.2001.00239.x
-
L. Shi, L. Zheng, D. Jin, Z. Lin, Q. Zhang, and M. Zhang, “Assessment of combination of automated pupillometry and heart rate variability to detect driving fatigue,” Frontiers in Public Health, Vol. 10, Feb. 2022, https://doi.org/10.3389/fpubh.2022.828428
-
G. L. Ferrari, “Pupilometria dinâmica: aplicação na detecção e avaliação da neuropatia autonômica diabética e estudo da correlação entre a resposta temporal da pupila ao estímulo visual e a glicemia,” Ph.D. thesis, Universidade Tecnológica Federal do Paraná, Paraná, 2008.
-
R. M. Costa, “Uma nova abordagem para reconhecimento em características dinâmicas da íris humana,” Ph.D. thesis, Universidade de São Paulo, São Paulo, 2009.
-
R. U. Pedroni, “Sistema autônomo em FPGA para captura e processamento em tempo real de imagens da pupila,” Master thesis, Universidade Tecnológica Federal do Paraná, Curitiba, 2011.
-
V. A. N. Yano, “Sistema biométrico multimodal baseado em pupilometria dinâmica,” Master thesis, Universidade Federal do Paraná, Curitiba, 2011.
-
M. Kohn and M. Clynes, “Color dynamics of the pupil,” Annals of the New York Academy of Sciences, Vol. 156, No. 2, pp. 931–950, Dec. 2006, https://doi.org/10.1111/j.1749-6632.1969.tb14024.x
-
H. J. Trussell, E. Saber, and M. Vrhel, “Color image processing [basics and special issue overview],” IEEE Signal Processing Magazine, Vol. 22, No. 1, pp. 14–22, Jan. 2005, https://doi.org/10.1109/msp.2005.1407711
-
G. Bradsk and A. Kaehler, Learning OpenCV. United States: O’reilly Media, 2008.
-
I. Lee, B. Choi, K. S. Park, S. S. Kim, and J.-M. Hwang, “Development of pupillography using image processing,” Korean Journal of Ophthalmology, Vol. 19, No. 2, p. 149, Jan. 2005, https://doi.org/10.3341/kjo.2005.19.2.149
-
C. Tilmant, L. Sarry, G. Gindre, and J.-Y. Boire, “Monitoring and modeling of pupillary dynamics,” in 25th Annual International Conference of the IEEE Engineering in Medicine and Biology Society, p. 441, Jun. 2024, https://doi.org/10.1109/iembs.2003.1279854
About this article
This work was development with the supported by CAPES, CNPq, FAPEMIG and Fundação Hospital de Olhos Dr. Ricardo Guimarães.
The datasets generated during and/or analyzed during the current study are available from the corresponding author on reasonable request.
The development of the equipment was carried out by Camila Bim, the subject of her doctorate. Author Jean A. Canestri contributed to the development of the software. The author Ricardo Guimarães contributed with guidance related to the medical/physiological part. The entire project was guided by Marcos Pinotti.
The authors declare that they have no conflict of interest.
The research met all applicable standards for the ethics of experimentation. Permit to perform biomedical investigation was granted by COEP - Comitê de Ética em Pesquisa/UFMG, CAAE - 39708114.2.0000.5149. Participants provided written informed consent prior to the experiment.
