Abstract
In contemporary production, the computer numerical control machine tool is an essential processing apparatus. However, its geometric errors can often impact processing accuracy and stability. Therefore, an innovative geometric error identification method for CNC machine tools is proposed, which uses the polarization information in the dual-frequency laser interferometer to improve the measurement accuracy. By optimizing the polarization state of the laser system, the ability to identify the geometric error of the machine tool is improved. The findings of this study indicated that the measurement accuracy, measurement range, ease of operation, reliability, cost and applicability of the dual-frequency laser interferometer-based geometric error identification method for computer numerical control machine tools were 0.91, 0.87, 0.93, 0.77, 0.94, 0.85 and 0.97, respectively, which were better than the comprehensive performance of other methods. The study's suggested method offers a solid foundation for raising the precision and machining quality of machine tools by effectively and precisely identifying the geometric faults of CNC tools. The study's findings also establish the groundwork for future widespread use of dual-frequency laser interferometers in the detection of geometric faults in computer numerical control machine tools by offering theoretical justification for real-world uses.
1. Introduction
The demands placed on computer numerical control machines (CNCMs) are increasing in terms of precision and machining quality due to the ongoing growth of the manufacturing sector [1]. The geometric error (GE) of the machine is one of the key factors affecting the accuracy and machining quality of CNCM, and it is frequently unavoidable due to the complexity of the machine's structure and the machining process [2]. As the cornerstone of modern manufacturing industry, the precision of CNC machine tools directly affects product quality and production efficiency. Especially in the field of aerospace and automotive manufacturing, the accuracy of parts is extremely strict, and any small error can lead to performance degradation and even safety risks [3]. With the development of technology, the manufacturing industry is constantly looking for ways to improve the accuracy and machining quality of machine tools to meet increasingly stringent industry standards [4, 5]. Dual frequency laser interferometer (DFLI) provides a new technique for geometric error identification of CNC machine tools with its excellent measurement accuracy and stability. Although studies have shown the effectiveness of DFLI in improving machine tool accuracy, further integration of this technology to adapt to changing industrial environments, ease of operation, cost effectiveness, and compatibility with existing manufacturing processes will need to be further explored in future research. In addition, the large-scale application of DFLI in actual production also needs to address the challenges of technical standardization, equipment durability and ease of maintenance. With the deepening of these studies, DFLI is expected to play a more critical role in the field of intelligent manufacturing and precision machining. Therefore, the proposed method of geometric error identification of CNC machine tools based on dual-frequency laser interferometer not only responds to the demand of this industry, but also provides the possibility of realizing higher standard manufacturing process. The study proposes an efficient identification method of GE for DFLI-based CNCM, which obtains high-precision interference signal data by amplifying, filtering and digitizing the interference signals received by the photodetector. The GE of the machine tool in each direction is then determined by identifying and analyzing the interference signal data using an effective algorithm. The research represents a new high precision measurement technology and promotes the innovation and development of measurement technology. By quickly and accurately identifying and compensating the geometric errors of machine tools, downtime and scrap rates in production can be reduced, and production efficiency and economic benefits can be improved. The high-precision measurement method provided by this research will help to promote the improvement of relevant industry standards and meet the stringent requirements of high-end manufacturing for product accuracy. The innovation of the research is to use the high-precision characteristics of the dual-frequency laser interferometer to introduce the laser beam into the working area of the machine tool through the polarization-maintaining fiber, and to measure the reflected interference beam by the photodetector. The dual-frequency laser interferometer system is optimized, including the integration of laser, beam splitter, interferometer and controller, as well as the application of fiber coupling technology, which enhances the stability and reliability of the system, and realizes the possibility of long-distance measurement. The contribution of the research is to provide technical support for the accuracy improvement and quality control of CNC machine tools in actual production, and help to improve the overall level of manufacturing industry. It points out the direction for future measurement technology, equipment research and development and application promotion, and promotes technological progress and industrial upgrading in related fields. There are four sections to the paper. The first is a review of the literature that reviews and evaluates the state of the art in both local and international research on GE identification techniques using DFLI and CNCM. The second section suggests a productive GE identification technique using DFLI and CNCM. Through experiments, the efficacy and performance of the approach are confirmed in the third section. The findings of the study are compiled in the fourth section.
2. Related works
Widely utilized in the field of precision processing and measurement, DFLI has the benefits of high accuracy, high stability, and high dependability. A quasi-distributed fiber-optic magnetic field sensing system based on the frequency-shift interferometry fiber-cavity fading technique was designed and proven by Ou et al. in an attempt to address the issues of high cost and low sensitivity of DFLI. According to the experimental results, each sensing unit of this system’s measuring cavity loss exhibited an excellent linear connection with the magnetic field in the 0-250Oe range [6]. Wang et al. developed a unified technique for machine tool error identification based on the double ball bar test and reconfigurable mechanism model. There is an error motion induced by machine tool position-related GE for machine tool error identification. According to the experimental data, the approach works well for identifying machine tool errors that involve both rotary and linear axes [7]. To address the problem of optical attenuators that can absorb photons in DFLI, Yan et al. proposed a laser physics model to generate chaos and hopping in erbium-doped fiber lasers. According to the experimental results, the pump modulation frequency and the attenuator’s absorption frequency can be changed to either create chaos or remove it [8]. Aiming at the fact that the straightness motion error of machine axes has an important effect on the straightness machining characteristics of the workpiece, Harja et al. suggested a way to determine the measurement parameters based on a computer program. Experimental results showed that the method resulted in an average deviation of less than 1 μm for straightness GE machine tools [9]. A high power, low noise, all-solid-state continuous-wave single-frequency dual-wavelength laser operating at 671 nm and 1342 nm was designed and built by Yan et al. The experimental results demonstrated that this method can simultaneously obtain a 671 nm wavelength 3.17 W laser and a 1342 nm wavelength 2.15 W laser under 47 W pumping [10]. A new approach of CNCM fault detection based on wavelet transform was proposed by Liu et al. in response to the issues with the long detection times and low detection accuracy of the conventional methods. According to the testing results, this approach can detect objects with up to 97 % accuracy and only 1.1 seconds detection time [11].
To assess and adjust for machine precision, GE detection of CNCM is a crucial step. Using a braided structure and a highly coupled structure as the foundation, Li et al. developed a dual-band frequency-selective surface to address the dual-frequency electromagnetic shielding problem for GE discrimination of CNCMs in complicated surroundings. The structure exhibits strong angular stability, independent operating characteristics, and is polarization insensitive, according to experimental data in the dual-blocking band [12]. In response to the geometrical and dimensional imperfections of machine tool parts that cause GE in CNCM, Zhang et al. conducted a comprehensive review study on the measurement, detection, modeling, identification, reduction and compensation of GE, and reviewed the research progress of GE measurement in machine tools in recent years [13]. To address the problem of suppressing the vibration of fluid transportation pipelines in CNCM over a wide frequency spectrum, Jin et al. designed a novel vibration absorber for suppressing the vibration in fluid transportation pipelines with the change of fluid velocity. The experimental findings showed that this absorber’s energy dissipation efficiency was greatly increased to 95 % over a broad frequency range [14]. In order to stabilize the CNCM laser’s frequency difference, Jiang et al. developed a dual-cavity, dual-frequency Nd: YAG laser with a 24 GHz frequency difference at 1064 nm using a Pond-Drever-Hall frequency difference stabilization system. The results of the trial showed that the system can successfully stabilize the CNCM's GE for identification [15]. Aiming at the problem that the CNCM generates GE from the polarization state, Xie et al. proposed a flexible active mode-locked optoelectronic oscillator with switchable frequency. The experimental results indicated that the noise rejection ratio of the main mode and supermode of this method is about 30 dB, which can reduce the error [16]. Since the location data in the optical interferometer's vibration sensor cannot be immediately demodulated, GE will result., An integrated vibration sensing technique based on two distinct wavelengths of double small linewidth laser sources was proposed by Sun et al. According to experimental findings, the vibration sensing technique has a good signal-to-noise ratio in the demodulated spectrum and a straightforward signal demodulation process [17]. Pan et al. developed a new method for characterizing the plastic properties of materials based on a plane strain small punch test. They designed and assembled the required tool parts and successfully carried out the tests, resulting in punching force and center displacement data. These key data are further used to determine the plastic behavior parameters of the material [18]. Baharudin et al. constructed a model of the micromilling process that is able to predict the temperature distribution of the tool and the workpiece. They paid special attention to the temperature change of Ti6Al4V material during micro-end milling, and found that the temperature showed an upward trend with the increase of the thickness of undeformed chips [19]. Ismail et al. established a tool force prediction model for oblique cutting conditions by using orthogonal test technique. Their analysis relies heavily on the Devries model, appropriately incorporating some elements of the Amareggo-Brown model. The accuracy of the model was verified by comparing the micro-cutting experimental data of Ti-6Al-4V material with the predicted results of the model, which showed a high consistency [20]. Zhang et al. developed a fully passive vibration processing device that uses the resonance principle to attach to a vibrating surface. The study successfully demonstrated that the device can significantly enhance the sensitivity of wireless vibration measurement technology in a specific frequency range, increasing the sensitivity by more than 10 times. In addition, the device has the function of simulating real-time vibration filtering and marking, which further enhances its performance [21].
In summary, as a kind of high precision measurement equipment, dual-frequency laser interferometer has a broad application prospect in geometric error identification. Although a variety of geometric error identification methods have been proposed in the existing literature, they generally have problems such as low measurement efficiency and complex operation. This limits the application of these methods in real production environments, highlighting the need to develop new methods. Simplicity of operation: In the actual production environment, simplicity of operation is essential to improve production efficiency. Therefore, research on an identification method that is easy to operate and can provide high precision measurement results is of great significance for improving the efficiency and machining quality of CNC machine tools. Therefore, an efficient identification method of geometric errors of CNC machine tools based on dual-frequency laser interferometer is proposed, and the geometric errors of CNC machine tools are measured by dual-frequency laser interferometer.
3. Dual-frequency laser-based geometric error measurement of CNCMs
Firstly, a dual-frequency laser interferometer system is constructed to ensure that the laser beam can pass through the working area of the CNC machine tool with high accuracy and stability. The system was then optimized to improve the accuracy and reliability of the measurements. Next, a mathematical model is established to describe the process of measuring geometric errors of CNC machine tools with dual-frequency laser interferometer. Finally, a set of data processing flow is developed, including signal amplification, filtering and digital processing.
3.1. Bias-preserving fiber-coupled dual-frequency laser interferometric elongation measurement by CNCM
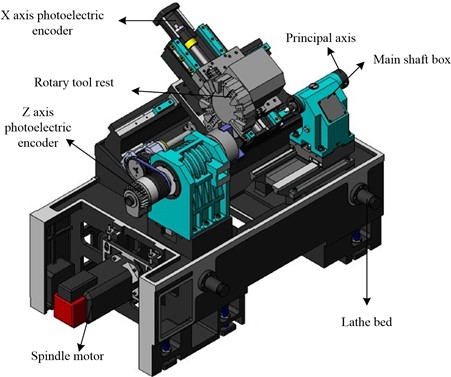
CNCM is a kind of equipment that uses digital information to control the machine tool so as to realize automatic machining. It's widely utilized in the manufacturing of machinery, aircraft, automobiles, and other industries because of its high precision, high efficiency, and high reliability. CNCM is mainly composed of three main parts: computer control system, servo drive system and machine body. It receives the input machining program, processes it, and outputs control instructions to direct the various parts of the machine tool to carry out the specified actions. The computer control system is the central component of CNCM. The servo drive system serves as the actuator of CNCM, driving the machine’s various parts according to the control instructions. The machine body is the basic part of the CNCM, which includes the bed, spindle, table and other components, and is the main body to realize machining [22]. The details are shown in Fig. 1.
Fig. 1CNC machine tool structure diagram
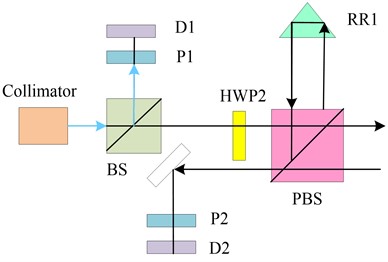
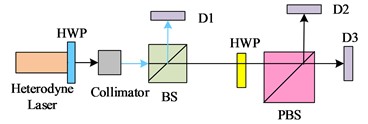
The geometrical parameters and locations of different machine tool components or parts that deviate from the ideal geometrical parameters and positions due to flaws in machine tool assembly, manufacture, design, and other processes are referred to as the GE of CNCM. The GE of CNCM can be measured and analyzed by the bias-preserving fiber (BPF)-coupled DFLs interferometric length measurement of CNCM. The principle of BPF-coupled DFLs interferometric elongation of CNCM is mainly based on laser interferometry. In particular, a monochromatic, coherent, narrow laser beam is produced by a laser and split into two beams, which are referred to as the measurement light and the reference light. A mirror reflects the reference light, which then collides with the measurement light. The measuring light strikes the object to be measured, is reflected and meets the reference light again. Where they meet, the reference light and the measuring light form interference fringes. This is due to the interference phenomenon that occurs when two light waves are coherently superimposed. Since the amount of interference fringes closely correlates with the object's length, counting interference fringes can be used to determine an object's length. The purpose of BPF is to maintain the stability of the interference fringe by guaranteeing that the light's polarization direction (PD) remains unaltered. Through BPF coupling, the influence of environmental factors on the interference fringes can be effectively suppressed, and the accuracy and stability of the measurement can be improved. The system structure of the BPF-coupled DFLI to measure the position error of the linear guideway mainly consists of the following parts, laser, beam splitter, interferometer, and controller. Furthermore, the discrepancy between the theoretical and actual interference fringes can be used to calculate the location error of the linear guide. This system structure can measure the position error of the linear guide with high precision and high efficiency, and provide powerful technical support for the fields of machinery manufacturing and aerospace. Specifically shown in Fig. 2.
Fig. 2Dual-frequency laser interferometer system structure
In the ideal case, two orthogonal beams of linearly polarized light with frequencies and emitted by a He-Ne DFLs are shown in Eq. (1):
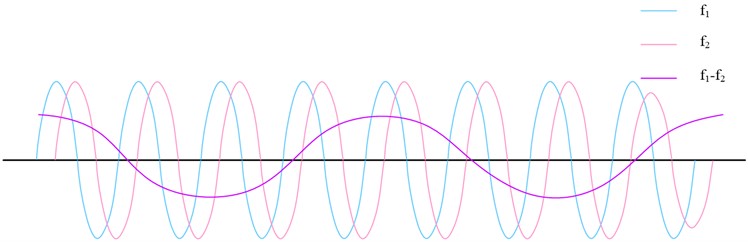
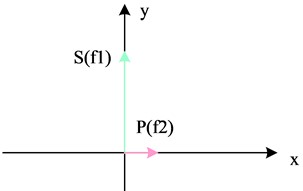
where, and are the amplitudes of the two beams of light, and are their respective frequencies, and and are their respective initial phases. Because of their differing frequencies, these two light beams cause interference phenomena when they travel through space. The phase difference between the two light beams accounts for the variations in brightness and dark in the interference fringes. The interference fringes are bright when the phase difference between the two light beams is an integer multiple of . The interference fringes are in a dim or disappearing state when the phase difference is a non-integer multiple of . The phase difference between the two laser beams can be ascertained by measuring the changes in the interference fringes, which provides details about the object being tested. It is coupled into the optical fiber through a coupling mirror, and in the middle, the vibration direction of the line polarization is adjusted by a half-wave plate HWP1 to align the two beams of orthogonally polarized light to the main axis of the optical fiber. The orthogonally polarized light is transmitted along the BPF after incidence, and the output beam at the other end of the fiber enters the measurement unit through a collimating beam expander. In the measurement cell, an interferometer can be used to measure the interference fringes of the two orthogonally polarized beams. The usual components of an interferometer are a detector, a mirror, and a beam splitter. The entering beam is divided into two beams by the beam splitter: a reference beam and a measuring beam. The reference light is reflected by the reflector back to the beam splitter, where it re-emerges with the measurement light. At the point of encounter, the two beams interfere, forming an interference fringe. The detector detects the changes in the interference fringes and thus obtains information about the object to be measured. The two orthogonally polarized beams' vibration direction can be altered, which will alter the interference fringes' position and shape, by varying the half-wave plate HWP1's angle. The position error of the observed object can be calculated by comparing the difference between the theoretical and real interference fringes [23-24]. The reference light beat frequency is shown in Fig. 3.
Fig. 3Reference light beat frequency
There are two main ways to process outlier signals, displacement demodulation and phase demodulation. By comparing and computing the Doppler frequency difference between the reference signal and the measurement signal, displacement demodulation uses the technique of frequency difference integration to ascertain an object's displacement. The reference signal is shown in Eq. (2):
where, denotes the reference signal. The measurement signal is shown in Eq. (3):
where, denotes the measurement signal. The relationship between frequency difference and displacement is shown in Eq. (4):
The measurement of the phase difference between the signal and the reference signal allows for the realization of phase demodulation, a measurement approach based on phase difference. The reference signal is shown in Eq. (5):
where, denotes the reference signal. The measurement signal is shown in Eq. (6):
where, denotes the measurement signal. The relationship between frequency difference and displacement is shown in Eq. (7):
3.2. DFLI system construction and optimization
The length measurement system of fiber optic coupled DFLI is a kind of displacement measurement system using the principle of optical interference, which adopts DFLI as the core measurement equipment, and transmits the laser beam to the interferometer through the fiber optic coupling technology to achieve high-precision displacement measurement. In the length measurement system of fiber optic coupling DFLI, optical fiber as a transmission medium can effectively avoid the interference of ambient light and improve the stability of the measurement system. At the same time, the laser beam can be conveniently transmitted to the interferometer through the optical fiber transmission to achieve long-distance measurement. BPF is a type of special optical fiber that can be used to provide high-precision physical quantity measurement by maintaining the line PD and increasing the coherent signal-to-noise ratio. A decrease in the polarization preservation performance will result from the structural defects created inside the fiber during the drawing process of BPF. This means that when line-polarized light is transmitted along one of the fiber’s characteristic axes, some of the optical signal will be coupled into the other characteristic axis that is perpendicular to it, which will ultimately lead to a decrease in the polarization extinction ratio of the outgoing polarized light signal. The fiber’s internal birefringence effect is impacted by this flaw. In BPF, a shorter beat length and better maintenance of the transmitted light's polarization state correspond with a stronger birefringence effect [25-26]. The BPF type is shown in Fig. 4.
Fig. 4Polarization-maintaining fiber type
a) Elliptic type
b) Panda type
c) Bow tie type
d) Photonic crystal fiber
Return loss is the number of decibels of the ratio of backward reflected light relative to the input light at the fiber optic connection, which reflects the reflections from the fiber optic link due to impedance mismatches, a pair of wires themselves. The return loss is shown in Eq. (8):
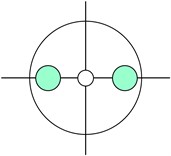
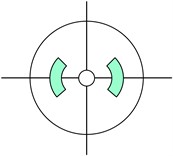
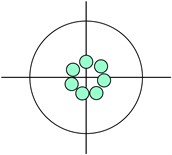
where, denotes the incident power and denotes the end-plane reflected power. Ideally, the orthogonal dual-frequency line-polarized light emitted from a DFLs should be two perfectly orthogonal line-polarized beams. However, in practice, due to the non-ideal nature of the laser, it is possible that the PDs of the two beams of line polarized light emitted are not perfectly orthogonal, or the line polarized light undergoes elliptical polarization and is no longer perfectly line polarized. The difference between orthogonality error and polarization leakage error is shown in Fig. 5.
Fig. 5The difference between orthogonal error and polarization leakage error
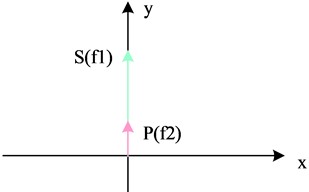
a) Orthogonal error
b) Polarization leakage error
The beamsplitter film or glass of a non-polarized beamsplitter may produce the phenomenon of birefringence, and when the direction of birefringence does not coincide with the direction of laser polarization, it will make the linearly polarized light passing through it turn into elliptically polarized light, which will produce frequency aliasing and result in a nonlinear error. The frequency aliasing brought on by the birefringence phenomena is the primary cause of this nonlinear mistake. In a beamsplitter, if a birefringent phenomenon exists in the beamsplitter film or glass, i.e., its refractive index differs for light of different PDs, then when linearly polarized light passes through the beamsplitter, its PD may change, resulting in frequency aliasing. Nonlinear errors are introduced by frequency aliasing, which alters the location and form of the interference fringes. Table 1 lists the primary sources of nonlinear errors.
Table 1Main source of nonlinear error
Dual-frequency laser | Source of error | Cause of occurrence | Error type |
Laser | Frequency aliasing | The polarization direction is not orthogonal | First-order error (generally 10-20 nm high quality up to several nanometers) |
Elliptic polarization of polarized light | |||
Spectrophotometer | Birefringent phase shift | ||
Polarizing spectroscope | Orthogonal error | ||
Installation error | Second order error (less than 0.1 nm) | ||
Polarization aliasing | Polarization leakage | Twice through PBS can be ignored |
It can be assumed that all other factors (such as the light source, beam splitter, interferometer, etc.) are ideal when examining the relationship between the nonlinear error in the length measurement results and the fiber alignment error. This means that these factors do not affect the state of polarization of the light and do not introduce additional error. Two linearly polarized lights are assumed to be ideally orthogonal, i.e., . This means that the PDs of the reference and measurement signals are exactly perpendicular and have no deviation. The expressions for the reference and measurement signals are further simplified based on the above assumptions. Due to , both signals are polarized in the same direction with only a slight difference in frequency. Therefore, the reference signal is expressed as shown in Eq. (9):
The measurement signal is represented as shown in Eq. (10):
where, represents the Doppler shift produced by the moving mirror. The effect of temperature on fiber properties does include material thermal expansion and thermo-optic coefficient. When the temperature changes, the fiber material experiences thermal expansion or contraction due to the fact that most materials have the property of thermal expansion and contraction. When the temperature increases, the fiber material expands, resulting in an increase in the length of the fiber. On the other hand, the fiber’s length falls as a result of the fiber optic material contracting when the temperature drops. This thermal expansion of the material results in a change in the geometry and dimensions of the fiber, which affects its transmission performance and optical properties. The length change due to thermal expansion is shown in Eq. (11):
where, denotes the coefficient of thermal expansion and denotes the fiber length. The effective refractive index change due to thermo-optic effect is shown in Eq. (12):
where, 7×10⁻⁶. The total phase change due to temperature change is shown in Eq. (13):
When the temperature changes, the beat length of the BPF changes. This is because temperature changes cause thermal expansion and thermo-optic effects in the fiber material. Therefore, temperature changes can introduce a nonlinear error of period to the measurements.
4. Nonlinear errors in optical paths for simulation of length measurement modeling coupled with bias-preserving fiber
BPF Coupling for Length Measurement Modeling Simulation Optical Path Nonlinear Error Analysis by analyzing the performance of the light source and interferometer, the efficiency and stability of the fiber optic coupling, and the environmental control measures, the nonlinear error is reduced, and the accuracy and stability of the length measurement system is improved.
4.1. Stability analysis of DFLI
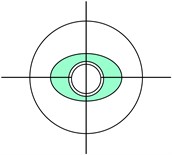
To evaluate the stability of the optical performance of the BPF after multiple plugging and unplugging, the experiment used fixed DFLs and a fixed fiber connector, as well as a spot analyzer to build the optical path. The optical fiber was plugged and unplugged several times on the fixed connector, and after adjusting the collimation, the spot was detected and the coordinates of the spot center were recorded by the spot analyzer two meters away from the fiber connector, as shown in Fig. 6.
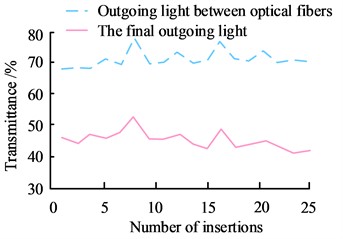
In comparison to the vertical direction, the offset of the spot in Fig. 6 is more noticeable in the horizontal direction. At a distance of 2 m, the offset reaches a maximum of 1 mm, which corresponds to an angular change of up to 1.8 seconds. When performing laser inspection, the power of the laser is usually chosen to be low. This is because the optical power decreases after going through a number of optical elements, which has an impact on the photodetector's ability to detect the spot and further reduces measurement accuracy. To analyze the performance of the BPF more intuitively, the study used an optical power meter to measure the optical power of the light exiting the DFLs, the exiting optical power between the two BPFs, and the final exiting optical power of the BPFs, respectively. This setup is to understand more precisely the power attenuation of the BPF during the transmission process. During the experiment, several plugging and unplugging operations were performed on the BPFs, and the outgoing optical power at three different positions was recorded, as shown in Fig. 7.
Fig. 6Directional stability of the outgoing light of polarization-maintaining fiber
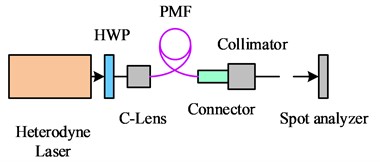
a) Experimental photogram
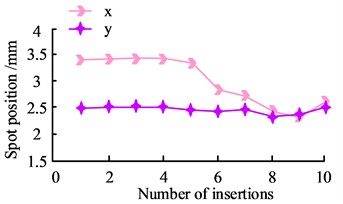
b) Insertion and removal times and spot center position
Fig. 7The power of the outgoing light at different positions
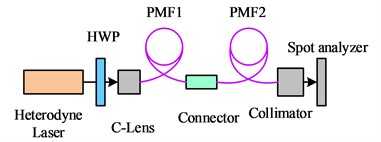
a) Experimental photogram
b) Insertion and removal times and spot center position
Fig. 8Dual-frequency laser stability
a) Experimental photogram
b) Dual-frequency laser power change
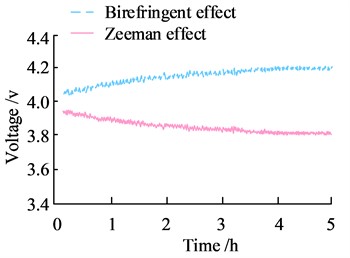
In Fig. 7, the transmittance of the single fiber to the outgoing light from the DFLs is 66 % on average, while the transmittance of the dual fiber to the outgoing light from the DFLs is 44 % on average. Since the two BPFs used in the experiment have the same parameters, it can be inferred that the main reason for the attenuation of the outgoing optical power of the first BPF being larger than that of the second one is the loss when the laser is coupled to the fiber. In order to investigate the power stability of DFLss, as illustrated in Fig. 8, the power stability and polarization stability of two different types of DFLss coupled with BPFs are examined through experiment design and optical path construction.
In Fig. 8, the variation range of the optical power of the Seeman effect-based DFLs over a four-hour period is 2.9 %, while the variation range of the birefringent principle-based DFLs is 3.2 %. This indicates that the power stability of the Seeman effect DFLs is slightly better than that of the birefringent DFLs. The total power ratio of the output of the Seeman effect DFLs to the birefringent DFLs is 3.5:4. This indicates that the total power magnitude of the birefringent DFLs is higher.
4.2. Laser polarization and DFLI performance analysis
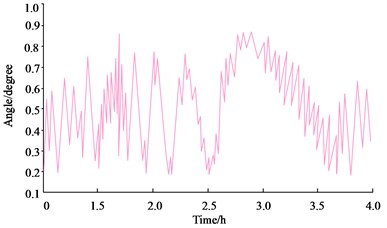
To assess the polarization stability of the light source, the study took the optical power of detectors D2 and D3 for three consecutive hours after the optical path was stabilized. The variation of the vibration angle of the polarization state was obtained by calculation. The comparison between the conventional He-Ne DFLs based on the Seeman effect and the DFLs based on the birefringence effect in terms of polarization angle variation is shown in Fig. 9.
In Fig. 9, the polarization angle variation of the DFLs based on the Seeman effect is in the range of ±0.35°, while that of the DFLs based on the birefringence principle is in the range of ±0.28°. The smaller the polarization angle oscillation, the smaller the frequency mixing phenomenon, thus improving the accuracy of the measurement. In real-world applications, the impact of an external force on the BPF must be taken into account to guarantee measurement accuracy. And the influence of the pressure change and the change in the direction of the force on the BPF birefringence is shown in Fig. 10.
Fig. 9Polarization angle change of dual frequency laser
a) Zeeman effect
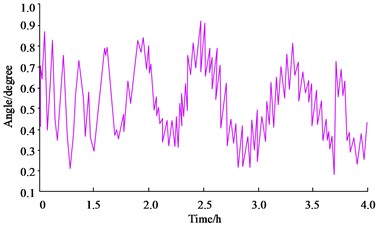
b) Birefringent effect
Fig. 10Influence of pressure and force direction on birefringence of polarization-maintaining fiber
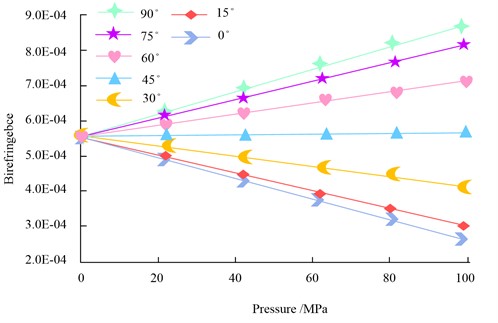
In Fig. 10, different force directions and slow-axis angles lead to different degrees of birefringence effect, and this change affects the transmission characteristics of light in the BPF, which in turn affects the accuracy of the measurement results. In order to verify the effectiveness of the geometric error identification method for CNC machine tools based on dual-frequency laser interferometer, and compare with existing methods, a high-precision dual-frequency laser interferometer is used as the main measurement tool, equipped with necessary optical and mechanical accessories, including mirrors, beam splitters, photodetectors, polarization-maintaining fibers, etc. Select a representative CNC machine tool as the experimental object to ensure that the machine tool type covers the applicable scope of the study. The experiments were conducted in a controlled environment to reduce the impact of environmental factors such as temperature, humidity and vibration on the measurement results. The measurement process is described in detail, including the emission of the laser beam, transmission through the working area of the CNC machine, reflection, and the capture of interference fringes. The experimental Settings of other geometric error identification methods, including reflector method, infrared camera method, frequency domain analysis method, theoretical model method, trajectory method, closed-loop measurement method and linear regression method, were compared in the experiment. Additionally, as Table 2 illustrates, the comparison indices are normalized.
Table 2Comparison of geometric error identification methods of different CNC machine tools
Methods | Measurement accuracy | Measuring range | Ease of operation | Real time | Reliability | Cost | Applicability |
Dual-frequency laser interferometer method | 0.91 | 0.87 | 0.93 | 0.77 | 0.94 | 0.85 | 0.97 |
The reflector method | 0.82 | 0.79 | 0.88 | 0.75 | 0.86 | 0.66 | 0.91 |
Infrared camera method | 0.73 | 0.72 | 0.83 | 0.63 | 0.83 | 0.73 | 0.87 |
Frequency domain analysis | 0.69 | 0.69 | 0.81 | 0.58 | 0.78 | 0.69 | 0.84 |
Theoretical model method | 0.74 | 0.77 | 0.76 | 0.63 | 0.72 | 0.95 | 0.79 |
Locus method | 0.81 | 0.78 | 0.74 | 0.61 | 0.84 | 0.92 | 0.81 |
Closed-loop measurement method | 0.88 | 0.77 | 0.85 | 0.72 | 0.75 | 0.76 | 0.83 |
Linear regression method | 0.73 | 0.69 | 0.83 | 0.75 | 0.71 | 0.85 | 0.88 |
In Table 2, the measurement accuracy, measurement range, ease of operation, reliability, cost, and applicability of the DFLI-based GE identification method for CNCM are 0.91, 0.87, 0.93, 0.77, 0.94, 0.85, and 0.97, respectively, which is a better overall performance than several other methods. At last, the statistical indexes of uncertainty, sensitivity and confidence interval are verified by experiments. Measurement uncertainty refers to the measurement that is different from the real value due to various factors in the measurement process. Sensitivity refers to the ability of a measurement system to respond to small changes in the physical quantity being measured. A confidence interval is the probability that the measured value falls within a certain interval at a certain confidence level. The experiment uses a high-precision dual-frequency laser interferometer as the main measurement tool, equipped with the necessary optical and mechanical accessories, such as mirrors, beam splitters, photodetectors, etc. The experiments were conducted in a controlled environment to reduce the impact of environmental factors such as temperature, humidity and vibration on the measurement results. Firstly, the dual-frequency laser interferometer is calibrated to ensure its measurement accuracy. Then, through a series of standardized tests, data on the geometric errors of CNC machine tools are collected. During this process, measurements are recorded and uncertainty, sensitivity, and confidence intervals are calculated. Statistical software is used to analyze the collected data and calculate the measurement uncertainty and sensitivity. Determine 95 % confidence intervals for measurement accuracy and measurement range based on measurement data. Through accurate experimental design and data analysis, the final results are shown in Table 3.
Table 3Measurement uncertainty, sensitivity and confidence interval statistics
Index name | Measured value | Units | Uncertainty (95 % confidence level) | Sensitivity (response variation) | Confidence interval (95 %) |
Measurement uncertainty | – | μm | ±0.5 | – | – |
sensitivity | 1.2 | μm/mV | / | 0.01 mV | – |
Confidence interval (accuracy) | 0.91 | / | ±0.03 | – | 0.88-0.94 |
Confidence interval | 0.87 | / | ±0.04 | – | 0.83-0.90 |
In Table 3, the measurement uncertainty is ±0.5 microns, which reflects the maximum possible deviation between the measured value and the true value at the 95 % confidence level, indicating that the measurement method proposed in this study has high accuracy and reliability. The sensitivity analysis revealed that the system has a 0.01-micron response to an input change of 1 millivolt, which further demonstrates the high responsiveness of the measurement system and its ability to accurately capture small size changes. In addition, 95 % confidence intervals for measurement accuracy and range were 0.88 to 0.94 and 0.83 to 0.90, respectively, indicating that the measurements were statistically robust.
5. Conclusions
The study proposes an efficient identification method based on DFLI for the problem of GE identification of CNCM, which utilizes the high-precision measurement capability of DFLI to achieve efficient and accurate identification of GE of CNCM by optimizing the measurement paths and data processing methods. The experimental results show that the proposed method can measure the geometric error of CNCM with high precision by using DFLI technology. The measurement uncertainty reaches ±0.5 micron, the sensitivity is 1.2 μm/mV, and the response threshold is 0.01 mV. The proposed method is superior to the prior art in terms of measurement accuracy, measurement range, operability, reliability, cost and applicability. The 95 % confidence interval of measurement accuracy is 0.88 to 0.94, and the 95 % confidence interval of measurement range is 0.83 to 0.90. The study optimizes the configuration of DFLI system, improves the stability and measurement accuracy of the system, simplifies the operation process and reduces the dependence on operator skills. The research results provide reliable data support for the precision adjustment and optimization of CNC machine tools, and help to improve the machining accuracy and stability of machine tools, and then improve product quality and production efficiency. Despite the remarkable results achieved in this study, there is still room for further optimization and improvement. The algorithm can be further optimized in the future to improve the speed and accuracy of data processing. Explore more cost-effective solutions to make high-precision measurement technology more widely available. Combine this approach with other intelligent technologies such as machine learning and the Internet of Things to enable a more automated and intelligent manufacturing process.
References
-
L. Zhang, X. Li, and J. Liu, “Detection of acoustically induced interface waves using a dual-frequency sinusoidal phase modulating laser interferometer and a normalized PGC-Arctan demodulation algorithm,” Journal of Vibration Engineering and Technologies, Vol. 11, No. 3, pp. 1197–1209, Jul. 2022, https://doi.org/10.1007/s42417-022-00635-4
-
P. Jin, Y. Cui, J. Su, H. Lu, and K. Peng, “Continuously tunable CW single-frequency Nd:YAP/LBO laser with dual-wavelength output,” Chinese Optics Letters, Vol. 21, No. 2, p. 021403, Jan. 2023, https://doi.org/10.3788/col202321.021403
-
Z. Lin, W. Tian, D. Zhang, W. Gao, and L. Wang, “A mapping model between the workpiece geometric tolerance and the end pose error of CNC machine tool considering structure distortion of cutting process system,” Advances in Mechanical Engineering, Vol. 13, No. 3, p. 168781402110047, Mar. 2021, https://doi.org/10.1177/16878140211004771
-
X. Zeng, B. Zhang, G. Xiao, J. Liu, and H. Zhao, “Frequency difference stabilization in Y-shaped cavity dual-frequency laser with the aid of precision passive control,” Optical Engineering, Vol. 60, No. 3, pp. 1–9, Mar. 2021, https://doi.org/10.1117/1.oe.60.3.034107
-
H. Gui, J. Liu, C. Ma, M. Li, and S. Wang, “Mist-edge-fog-cloud computing system for geometric and thermal error prediction and compensation of worm gear machine tools based on ONT-GCN spatial-temporal model,” Mechanical Systems and Signal Processing, Vol. 184, No. 1, p. 109682, Feb. 2023, https://doi.org/10.1016/j.ymssp.2022.109682
-
Y. Ou et al., “A quasi-distributed fiber magnetic field sensor based on frequency-shifted interferometry fiber cavity ringdown technique,” Optics and Laser Technology, Vol. 146, No. 1, p. 107607, Feb. 2022, https://doi.org/10.1016/j.optlastec.2021.107607
-
Z. Wang, D. Wang, S. Yu, X. Li, and H. Dong, “A reconfigurable mechanism model for error identification in the double ball bar tests of machine tools,” International Journal of Machine Tools and Manufacture, Vol. 165, No. 1, p. 103737, Jun. 2021, https://doi.org/10.1016/j.ijmachtools.2021.103737
-
S. Yan, “Dual-frequency shift leads to chaos and beating in an erbium-doped fiber laser,” in ITM Web of Conferences, Vol. 47, No. 2, p. 03004, Jun. 2022, https://doi.org/10.1051/itmconf/20224703004
-
H. B. Harja, A. Nurbaniah, N. S. B. Muhadi, and A. Noviandi, “Straightness geometric error assessment for CNC milling machine,” Key Engineering Materials, Vol. 939, No. 1, pp. 39–46, Jan. 2023, https://doi.org/10.4028/p-a8n75m
-
L. Yan, Y. Li, J. Feng, and K. Zhang, “Low noise continuous‐wave single‐frequency dual wavelength lasers at 671 and 1342 nm,” Microwave and Optical Technology Letters, Vol. 63, No. 8, pp. 2085–2089, May 2021, https://doi.org/10.1002/mop.32891
-
J. Liu, “Fault detection method of CNC machine tool based on wavelet transform,” Parallel Processing Letters, Vol. 32, No. 1n02, pp. 1–15, Oct. 2021, https://doi.org/10.1142/s0129626421410012
-
C. Li et al., “A dual‐stopband FSS using knitted and strong‐coupled structures with excellent angular stability and polarisation insensitivity,” IET Microwaves, Antennas and Propagation, Vol. 16, No. 9, pp. 567–573, Jun. 2022, https://doi.org/10.1049/mia2.12264
-
B. Dken, H. G. Ko, A. B. Ko, and M. Altan, “Dual-band frequency selective surface design for GSM shielding applications,” Journal of Aeronautics and Space Technologies, Vol. 14, No. 1, pp. 1–7, 2021.
-
Y. Jin and T. Yang, “Enhanced vibration suppression and energy harvesting in fluid-conveying pipes,” Applied Mathematics and Mechanics, Vol. 44, No. 9, pp. 1487–1496, Jul. 2023, https://doi.org/10.1007/s10483-023-3022-8
-
F. Jiang et al., “Design of frequency-difference stabilizing system for two-cavity dual-frequency Nd:YAG laser using quadrature-demodulated Pound-Drever-Hall method,” Optical Engineering, Vol. 61, No. 4, pp. 1–13, Apr. 2022, https://doi.org/10.1117/1.oe.61.4.046109
-
T. Xie et al., “A flexibly frequency switchable active mode-locking optoelectronic oscillator with supermode noise suppression,” Optics and Laser Technology, Vol. 163, No. 1, p. 109354, Aug. 2023, https://doi.org/10.1016/j.optlastec.2023.109354
-
Z. Sun, Y. Xu, and W. Fang, “Distributed multiple vibrations detection with high frequency response assisted by dual NLL sources,” Optical Fiber Technology, Vol. 73, p. 103074, Oct. 2022, https://doi.org/10.1016/j.yofte.2022.103074
-
W. Pan, J. Boyle, M. Ramlan, C. Dun, M. Ismail, and K. Hakoda, “Material plastic properties characterization using a generic algorithm and finite element method modelling of the plane-strain small punch test,” in SPT Conference, 2010.
-
B. T. H. T. Baharudin, K. P. Ng, S. Sulaiman, R. Samin, and M. S. Ismail, “Temperature distribution of micro milling process due to uncut chip thickness,” Advanced Materials Research, Vol. 939, pp. 214–221, May 2014, https://doi.org/10.4028/www.scientific.net/amr.939.214
-
M. S. Ismail, B. T. H. T. Baharudin, and K. K. B. Hon, “Analytical model prediction: micro-cutting tool forces with the effect of friction on machining titanium alloy (Ti-6Al-4V),” International Journal of Industrial and Manufacturing Engineering, Vol. 6, No. 8, pp. 1656–1660, Aug. 2012, https://doi.org/10.5281/zenodo.1058429
-
D. Zhang, A. Polamarasetty, M. O. Shahid, B. Krishnaswamy, and C. Ma, “Passive mechanical vibration processor for wireless vibration sensing,” arXiv:2305.10687, Jan. 2023, https://doi.org/10.48550/arxiv.2305.10687
-
A. Wellendorf, P. Tichelmann, and J. Uhl, “Performance analysis of a dynamic test bench based on a linear direct drive,” Archives of Advanced Engineering Science, Vol. 1, No. 1, pp. 55–62, Jun. 2023, https://doi.org/10.47852/bonviewaaes3202902
-
X. Y. Li, J. Z. Fu, and J. Q. Li, “Key technologies research for impellers machining based on NX,” Applied Mechanics and Materials, Vol. 101-102, pp. 1031–1034, Sep. 2011, https://doi.org/10.4028/www.scientific.net/amm.101-102.1031
-
X. Y. Li, S. Tong, G. Sheng, and P. He, “Application of VERICUT in the experimental teaching of five axis NC machining,” Laboratory Science, Vol. 19, No. 2, pp. 139–141, 2016.
-
N. Picqué and T. W. Hänsch, “Interferometry with optical frequency combs,” Photoniques, Vol. 113, No. 113, pp. 38–42, May 2022, https://doi.org/10.1051/photon/202111338
-
R. Liang, Z. Wang, W. Chen, and W. Ye, “Accuracy improvement for RLLLR five-axis machine tools: A posture and position compensation method for geometric errors,” Journal of Manufacturing Processes, Vol. 71, pp. 724–733, Nov. 2021, https://doi.org/10.1016/j.jmapro.2021.09.037
About this article

The research is supported by the “Fourteenth Five Year Plan” Teaching Reform Project of Ordinary Undergraduate Universities in Zhejiang Province (No. jg20220681); The Ministry of Education’s Project of Cooperative Education of Production and Learning (No. 202101133002, No. 221004082121309, No. 221003941101409).
The datasets generated during and/or analyzed during the current study are available from the corresponding author on reasonable request.
Xianyi Li provided the concept and wrote this manuscript. Xiaoying Liu prepared the figures and tables, revised this manuscript. Both authors reviewed, discussed, and agreed this manuscript and approved this submission.
The authors declare that they have no conflict of interest.
