Abstract
In the article, under field conditions (on the lane of a city road for public transport), using modeling and traffic flow analysis methods, the formation of ruts on an asphalt concrete pavement is studied. The maximum total rut depth on the road section under consideration reaches 110 mm. 715 buses and 25 trucks pass along a separate lane of the road per day, the relative rutting impact of which is from 5.68 to 16.41 compared to the design vehicle. The design of the road pavement on the experimental section with a total thickness of 48 cm is too weak for the actual traffic flow, which was the main reason for the premature failure of the road due to unacceptable rut sizes on the asphalt concrete pavement.
Highlights
- Graphs have been constructed for the increase in rut depth on the asphalt concrete pavement during transport facilities passages.
- The relative rutting effects of the transport facilities are determined.
- Rutting on road asphalt concrete pavements is a complex physical and mechanical phenomenon that requires in-depth comprehensive research.
1. Introduction
Road pavement structures are designed so that during their entire service life defects and destruction do not exceed permissible values [1]-[3]. The main types of destruction of flexible road pavements are rutting [4], fatigue [5], [6] and low-temperature [7]-[10] cracking. As many years of experience have shown, in regions with a sharply continental climate, ruts and low-temperature cracks in asphalt concrete pavement can appear in the first years of road operation. At the same time, compared to low-temperature cracks, eliminating ruts on an asphalt concrete pavement is much more difficult and usually leads to premature destruction of the asphalt concrete pavement and even the entire pavement structure [11].
The problem of rutting turned out to be especially relevant for large cities in regions with hot climates, in which roads with flexible pavement structures (especially separate lanes for public transport) are exposed to loads with increased characteristics.
In this work, based on an integrated approach, rutting on an asphalt concrete pavement of a highway in Almaty (Kazakhstan) is studied.
2. Experimental section
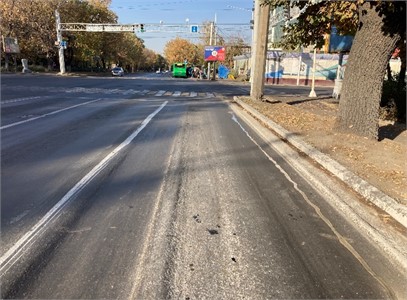
For a detailed study of characteristics of rutting on asphalt concrete pavement, a section of the city road located on Tole Bi Street before the intersection with Seifullin Avenue (direction: western) was selected. The general view of the section is presented in Fig. 1.
By opening, the following pavement structure was installed on the experimental site: layer 1 – fine-grained dense asphalt concrete, type B, 8 cm; layer 2 – fine-grained dense asphalt concrete, type B, 2 cm; layer 3 – coarse-grained porous asphalt concrete, 3 cm; layer 4 – fine-grained dense asphalt concrete, type B, 4 cm; layer 5 – coarse-grained porous asphalt concrete, 5 cm; layer 6 – crushed stone treated with bitumen, 7 cm; layer 7 – a mixture of sand and gravel, 19 cm. The total thickness of the road pavement structure is 48 cm.
The top layer of the soil base, 42 cm thick, is a mixture of sandy loam and gravel; the soil of the lower layer is sandy loam.
Fig. 1General view of the experimental section
3. Geometric characteristics of rut
To measure the rut depth on the experimental section, a lane allocated for public transport (separate lane) was selected, which has a deep rut.
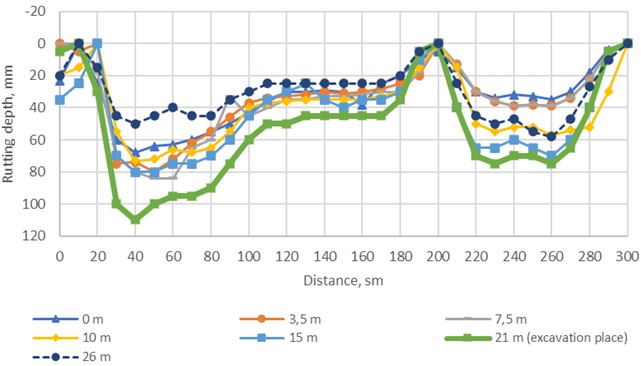
The rut depth was measured on lines located on the surface of the asphalt concrete pavement at different distances (0; 3.5; 7.5; 10; 15; 21 and 26 m) from the intersection (from the stop line). These lines are parallel and perpendicular to the direction of movement. On each of these lines, the rut depth was measured every 10 cm within the lane.
Graphs of the distribution of rut depth on the surface of the asphalt concrete pavement, constructed from the measured data, are presented in Fig. 2. As can be seen from the figure, on the road section under consideration, the distribution of ruts along the width of the traffic lane is complex: 1) the geometric characteristics of rutting at different distances from the intersection are different; 2) at different distances, the greatest rut depth is fixed on different (inner or outer) runways; 3) the geometry of rutting within the runways, in sections between them and behind them at different distances is also different. All these facts show that the process of rutting is complex. Even on a small section of the road (the length of the section is 26 m), at its different points the rutting process rate is different. The maximum rut depths of 100 mm and 110 mm occur on the outer runway at a distance of 21 m from the intersection. Statistical calculations have established that 73 % and 95 % of the measured rut depths are less than 50 mm and 74 mm, respectively.
Fig. 2Graphs of rut depth distribution on the asphalt concrete pavement surface at different distances
4. Traffic intensity and composition
In the considered section the intensity and composition of traffic flow was measured using the NEOLINE G-TECH X76 digital video recorder. The measurement results were analyzed by the Traffic Flow software.
Information on the intensity and composition of traffic on the city road on which the experimental section is located is presented in Table 1. As can be seen from this table, on the section the total intensity in the western, eastern and both directions is 22,641, 19,586 and 42,227 cars/day respectively. In the traffic flow, cars and trucks, public transport (buses and trolleybuses) and motorcycles account for 93.83 %, 0.15 %, 3.43 % and 2.59 %, respectively.
Table 1Traffic intensity and composition
Type of transport | Traffic intensity, units/day | ||
Western direction | Eastern direction | In both directions | |
Cars | 21 232 | 18 388 | 39 620 |
Trucks | 25 | 39 | 64 |
Public transport | 715 | 734 | 1 449 |
Motorsycles | 669 | 425 | 1 094 |
Total | 22 641 | 19 586 | 42 227 |
The measurement results also showed that only buses and trolleybuses move in the separate lanes. The traffic intensity of buses and trolleybuses in the western and eastern directions is almost the same: 715 and 734 units/day, respectively. Daily distributions of the intensity of the public transport (buses and trolleybuses) on the separate lanes are presented in Fig. 3.
Fig. 3Intensity of public transport on the separated lines
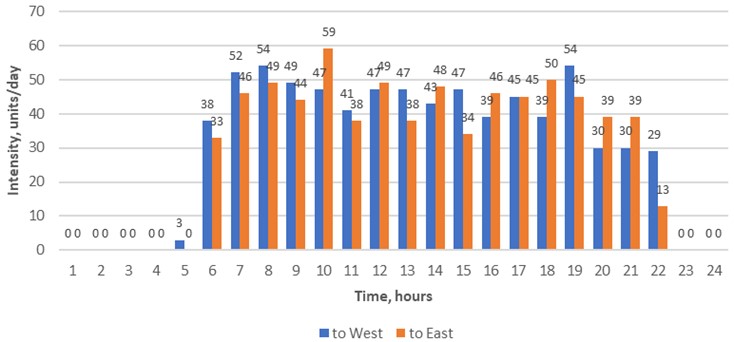
The total intensity of traffic flow and public transport is maximum and almost stable on average during the daytime. This road does not experience a significant increase in traffic volume during peak hours. On this road public transport is represented by buses of the brands Zhongtong LCK61254GAN, Golden Dragon XML6125CN, Golden Dragon XML6185J13C, Youtong ZK6118HGA, Youtong Z6108HGH (China), SamAuto LE60 (Uzbekistan) and an electric transport.
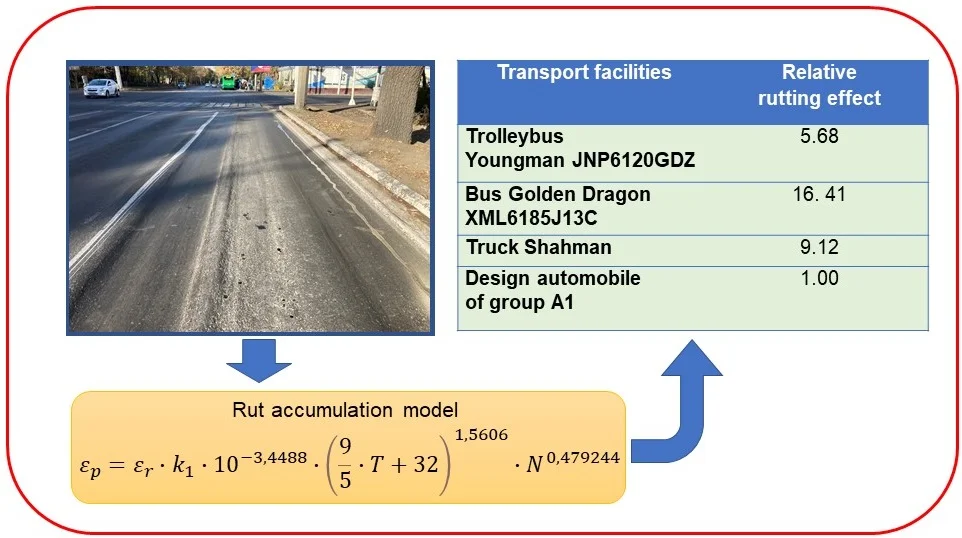
5. Assessment of rutting effects of transport facilities
An important indicator in the study of rutting in layers of road pavements is the rutting effect of individual transport facilities. To assess the rutting effect of them on the asphalt concrete pavement at the selected experimental section, the NCHRP model [12] was used:
where – plastic strain, mm/mm; – elastic strain, mm/mm; – temperature, °C; – number of ESALs (equivalent single axle load); – factor, depending on layer thickness and point position.
To calculate the values of elastic strain in the asphalt concrete pavement under axial loads, the solution of A. K. Privarnikov [13] for a layered elastic medium was used, which was successfully applied in our early works [14], [15] in calculating the components of the displacement vector, strain and stress tensors at points of road pavement structures.
The values of elasticity modulus of the layers materials of the road pavement and soils are assigned according to the regulatory document SP RK 3.03-104-2014* [16]. The values of Poisson’s ratio of the asphalt concrete and crushed stone treated with bitumen were calculated according to the Guide [12]. The value of Poisson’s ratio of the natural base soils are determined according to the SP RK 3.03-104-2014* [16].
As is known, the elastic moduli of asphalt concretes and a crushed stone treated with a bitumen depend on temperature. The estimated temperature values of the road pavement layers from these materials are established using measurement data from the temperature and moisture monitoring system on the section of the “Almaty-Bishkek” highway, located at the 57th kilometer, and the recommendations of the regulatory document R RK 218-96-2013 [17].
Graphs of the dependence of the rut depth on the number of passes of the calculated axles for three typical types of transport and the calculated vehicle, constructed based on the calculation results, are shown in Fig 4. This figure clearly shows that the rate of accumulation of plastic deformations strongly depends on the type of transport: 1) all considered transport types in terms of rutting effects are much significant compared to the design vehicle of group A1; 2) the most destructive is the Golden Dragon brand bus; 3) the relative destructive impact of “significant” modes of transport increases greatly with the increase in the number of their passages.
By setting the permissible value equal to 20 mm, from the graphs in Fig. 4, one can determine the maximum number of passages for the considered modes of transport (Table 2).
In the regulatory document on the design of road pavement structures in Kazakhstan [16], the impacts of all types of vehicles are reduced to the equivalent number of passages of a design vehicle of one of two groups (A1 and A2) with axial loads of 100 kN and 130 kN, respectively.
Fig. 4Graphs of the dependence of the rut depth on the number of passes of the design axes
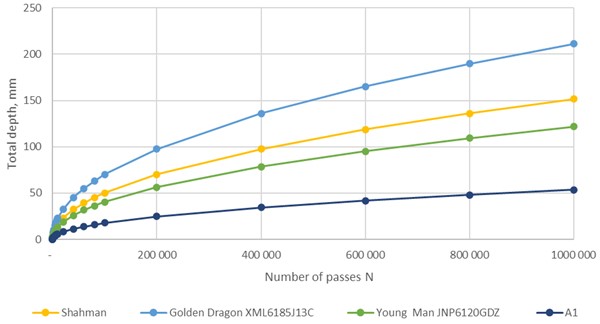
In this work, to perform a comparative assessment of the degree of rutting (destructive) impact of the considered modes of transport, a design automobile of group was selected. Therefore, Fig. 4 and Table 2 contain the corresponding graph and numerical characteristics for the design automobile of group .
From Table 2 it can be seen that the Golden Dragon bus has the greatest rutting effect (RRE = 16.41); trolleybus of the Youngman brand and truck of the Shahman brand have RRE, equal to 5.68 and 9.12, respectively.
Table 2Maximum number of passages and relative rutting effects of transport facilities
Type of transport | Brand of transport facilities | Allowable number of passes | Relative rutting effect (RRE) |
Trolleybus | Youngman JNP6120GDZ | 23 100 | 5.68 |
Bus | Golden Dragon XML6185J13C | 8 000 | 16. 41 |
Truck | Shahman | 14 400 | 9.12 |
Design automobile of group А1 | 131 300 | 1.00 | |
6. Conclusions
1) The maximum total rut depth on the road section under consideration reaches 110 mm.
2) In the traffic flow in the considered (western) direction (22,641 units/day), cars and trucks, public transport (trolleybuses and buses) and motorcycles account for 93.78 %, 0.11 %, 3.16 % and 2.95 % respectively. In this direction, only buses and electric transport move along a separate lane with an intensity of 715 units/day.
3) Relative (in comparison with the design automobile of group A1) rutting (destructive) effect (RRE) of a Golden Dragon bus, a Youngman trolleybus and a Shahman truck are equal to 16.41; 5.68 and 9.12 respectively. Their maximum number of passages (up to a rut depth of 20 mm) is in the range from 8 000 to 23 100.
4) The actual pavement structure on the experimental section with a total thickness of 48 cm, consisting of a two-layer asphalt concrete pavement (10 cm), old asphalt concrete of different compositions (12 cm), crushed stone treated with bitumen (7 cm) and a mixture of sand and gravel (19 cm), is excessively weak for actual traffic flow, which was the main reason for the premature destruction of the road due to unacceptable rut sizes on the asphalt concrete surface.
References
-
N. N. Ivanov et al., Design and Calculation of Flexible Pavement. (in Russian), Moscow: Transport, 1973, https://doi.org/10.1088/1757-899x/1159/1/012024/pdf
-
E. J. Yoder and M. W. Witczak, Principles of Pavement Design. New Jersey: John Willey & Sons, 2008, https://doi.org/10.1002/9780470172919
-
Y. H. Huang, Pavement Analysis and Design. New Jersey: Pearson Education, 2004.
-
A. K. Singh and J. P. Sahoo, “Rutting prediction models for flexible pavement structures: A review of historical and recent developments,” Journal of Traffic and Transportation Engineering (English Edition), Vol. 8, No. 3, pp. 315–338, Jun. 2021, https://doi.org/10.1016/j.jtte.2021.04.003
-
B. Teltayev, “A new failure criterion for asphalt mixtures under fatigue loading,” International Journal of Pavement Research and Technology, Vol. 8, No. 4, pp. 276–282, Jul. 2015, https://doi.org/10.6135/ijprt.org.tw/2015.8(4).276
-
Molenaar and A. A. A., “Prediction of fatigue cracking in asphalt pavements,” Transportation Research Record: Journal of the Transportation Research Board, Vol. 2001, No. 1, pp. 155–162, Jan. 2007, https://doi.org/10.3141/2001-17
-
B. Teltayev, “Evaluation of low temperature cracking indicators of hot mix asphalt pavement,” International Journal of Pavement Research and Technology, Vol. 7, No. 5, pp. 343–351, 2014, https://doi.org/10.6135/ijprt.org.tw/2014.7(5).343
-
B. Teltayev and B. Radovskiy, “Low temperature cracking problem for asphalt pavements in Kazakhstan,” RILEM Bookseries, Vol. 13, pp. 139–144, May 2016, https://doi.org/10.1007/978-94-024-0867-6_20
-
B. Teltayev and B. Radovskiy, “Predicting thermal cracking of asphalt pavements from bitumen and mix properties,” Road Materials and Pavement Design, Vol. 19, No. 8, pp. 1832–1847, Nov. 2018, https://doi.org/10.1080/14680629.2017.1350598
-
M. Guo, X. Yao, and X. Du, “Low temperature cracking behavior of asphalt binders and mixtures: A review,” Journal of Road Engineering, Vol. 3, No. 4, pp. 350–369, Dec. 2023, https://doi.org/10.1016/j.jreng.2023.11.001
-
A. H. Albayati, “A review of rutting in asphalt concrete pavement,” Open Engineering, Vol. 13, No. 1, pp. 1–26, Jun. 2023, https://doi.org/10.1515/eng-2022-0463
-
“Guide for mechanistic-empirical design of new and rehabilitated pavement structures,” Final report, Part 3, Design analysis, Design of new and reconstructed flexible pavements. National cooperative highway research program, Transportation research board, National research council, 2004.
-
A. K. Privarnikov, “Spatial deformation of a multilayer base,” in Stability and Strength of Structural Elements, 1973.
-
B. Teltayev and K. Aitbayev, “Modeling of temperature field in flexible pavement,” Indian Geotechnical Journal, Vol. 45, No. 4, pp. 371–377, Jul. 2014, https://doi.org/10.1007/s40098-014-0122-6
-
B. Teltayev, J. Liu, and E. Suppes, “Distribution of temperature, moisture, stress and strain in the highway,” Magazine of Civil Engineering, Vol. 83, No. 7, pp. 102–113, Jan. 2018, https://doi.org/10.18720/mce.83.10
-
“Design of flexible pavements,” SP RK 3.03-104-2014*, Astana, 2019.
-
“Zoning of the Kazakhstan territory according to the estimated temperatures of asphalt concrete pavements,” R RK 2018-96-2013, Astana, 2013.
About this article

The authors have not disclosed any funding.
The datasets generated during and/or analyzed during the current study are available from the corresponding author on reasonable request.
The authors declare that they have no conflict of interest.
