Abstract
Numerical simulation was carried out on the transmission loss of the split-stream rushing exhaust muffler, and the accuracy of the simulation method was verified through experiments. Taking the transmission loss as the response value, the experiment was designed by using Box-Behnken module of Design Expert software. A mathematical regression model of transmission loss with experiment factors was established by using the Box-Behnken experimental design scheme, the experiment factors include the diameter of the interior pipe, the shape of the rushing hole, the center distance of the rushing hole, the cone angle of the interior pipe as well as the number of rushing holes, and the mathematical regression model's significance was tested. The response curvatures of second order interaction to the transmission loss by different variables were obtained and the interaction relationships among variables were analyzed. The results showed that the diameter of the interior pipe and the center distance of the rushing hole are the main factors that affect the transmission loss. The transmission loss increases with the increase of the diameter of the interior pipe. When the diameter of the interior pipe is between 70 mm and 80 mm, the transmission loss firstly increases and then decreases with the center distance of the rushing hole changes from to . When the diameter of the interior pipe is between 80 mm and 90 mm, the transmission loss decreases with the center distance of the rushing hole changes from to . The effect of the rushing hole shape on transmission loss is not significant. The transmission loss increases with the increase of the number of rushing holes, but the increase of transmission loss is not significant with the number of rushing holes changes from 4 to 6 groups. Taking the transmission loss as the optimization index, the better experimental condition was obtained. Compared to the not optimized muffler of the sample engine, the average transmission loss of the optimized muffler is increased by 48.70 % when the frequency is 0-1000 Hz, the average insertion loss of the optimized muffler is increased by 7.4 %. At inlet air velocity of 40 m/s, the pressure loss is reduced by 56.8 %.
Highlights
- A mathematical regression model of transmission loss of the split-stream rushing exhaust muffler for diesel engine was established by using the Box-Behnken experimental design scheme.
- The response curvatures of second order interaction to the transmission loss by different variables were obtained and the interaction relationships among variables were analyzed.
- Taking the transmission loss as the optimization index, the better experimental conditions were obtained.
- The transmission loss of the optimized muffler and the not optimized muffler were analyzed comparatively. Compared to the not optimized muffler, the average transmission loss is raised by 48.70%.
- The acoustic performance and aerodynamic performance of the optimized muffler and the not optimized muffler were analyzed comparatively.Compared to the not optimized muffler,the average insertion loss is raised by 7.4% and the pressure loss is reduced by 56.8% when the inlet speed is 40 m/s.
1. Introduction
The internal combustion engine is still the main power machine nowadays, which is not only applied in vehicles, ships, small aircraft etc., but also in engineering machinery, agricultural machinery and mobile power station facilities [1]. The diesel engine, owing to its strong driven performance, has become the main power equipment for vehicles, engineering machinery and agricultural machinery etc., especially the high-power diesel engine is being widely used in large-scale agricultural machinery such as high-powered tractors and combine harvesters. However, its severe noise pollution has a tremendous impact on the surrounding environment and operators, so it is very important to control the noise of diesel engines. In the noise sources of the diesel engine or the vehicles powered by diesel engine, the exhaust noise is the dominant compared to the other noise sources, such as the component vibration noise, inlet-air noise and so on, using mufflers is the most direct and effective way in controlling the exhaust noise of diesel engines [2-4]. Transmission loss is an important index to assess the acoustic performance of the muffler [5].
Improving the transmission loss of mufflers is one of the main goals of designing and improving mufflers. The transmission loss is closely related to the structure of the muffler. Scholars at home and abroad have studied the influence of structural parameters on the transmission loss of typical mufflers such as plenum chamber, micro perforated muffler, Helmholtz resonator, etc. [6-9]. Scholars established a mathematical model for transmission loss and optimized it using the Green’s function dependent transfer matrix method, the Particle Swarm Optimization, etc. [10-11].
The author's research group had proposed a new principle of split-stream rushing, which primarily reduces the internal airflow velocity of mufflers. The split-stream rushing exhaust muffler was designed based on this principle, the muffler can effectively improve aerodynamic performance while also considering acoustic performance. In the preliminary research, theoretical calculations, numerical simulations, and experimental verification were carried out on the new type of muffler [12-17], confirming the feasibility and superiority of the muffler.
The previous research mainly focused on two aspects: first, the study on the variation law of air flow velocity inside the muffler, and second, the study on the influence laws of the muffler's structural parameters on pressure loss and airflow regeneration noise.
Suhe et al. [18]. established a differential equation for the movement of a single gas micro cluster during the process of rushing airflow inside the split-stream rushing exhaust muffler, the velocity expression of the gas micro cluster was obtained by solving the differential equation. An analysis was carried out on the velocity of gas micro clusters during the rushing process, the results show that after two airflow streams collided at a certain velocity, the longitudinal velocity near the rushing surface rapidly decreased to zero. Zhang Yong’an et al. [19]. studied the pressure loss at different inlet airflow velocities, the results show that at different inlet airflow velocities, the pressure loss of the new muffler is reduced by more than 20 % compared to the traditional muffler.
Suhe et al. [20]. studied the influence of the shape and position of the rushing holes on the pressure loss and transmission loss of the split-stream rushing exhaust muffler. They found that rectangular rushing holes with an average center distance had good comprehensive performance. Zhang Haijun et al. [21-22]. used multivariate statistical methods to establish mathematical models for pressure loss and air flow regeneration noise inside the split-stream rushing exhaust muffler, the influence laws of structural parameters on pressure loss and airflow regeneration noise were obtained, that providing a theoretical basis for the optimization design of muffler.
To optimize the structure of the muffler, it is necessary to comprehensively consider three performance evaluation indicators: transmission loss, air flow regeneration noise, and pressure loss. Therefore, it is crucial to establish a transmission loss model for the new type of muffler [23-24]. The studies of the transmission loss of typical mufflers have important reference value for the establishment of the transmission loss model of the split stream rushing exhaust muffler.
In this work, a single-cylinder diesel engine CG25 (Cylinder diameter: 115 mm, 1 h power: 15.7 kW, rated revolution: 2200 r/min) produced by Jiangsu Changgong Power Machinery Co., Ltd. in China was taken as the prototype. A split-stream rushing exhaust muffler was designed based on the prototype. Firstly, the transmission loss of the muffler was simulated by using acoustic module of Virtual.Lab software, and the accuracy of the simulation method was verified through experiments. Secondly, the transmission loss experiment was designed by using Box-Behnken module of Design Expert 13.0 software, and statistical analysis was carried out on the experimental data to establish a mathematical model for the transmission loss. Finally, the model was then used to analyze the effect of the muffler's structural parameters on the transmission loss. The research results will provide a valuable reference for the design and theoretical optimization of the split-stream rushing exhaust muffler.
2. Working principle of the split-stream rushing exhaust muffler and transmission loss calculation
2.1. Working principle of the split-stream rushing exhaust muffler
Fig. 1 is a schematic diagram of the split-stream rushing principle of the muffler, in which the arrows indicate the airflow directions. When the airflow flows in from the inlet, it enters the annular cavity and is guided by a conical surface, and then flows into the interior chamber from the two pairs of rushing holes A and C, and B and D (the shape and size of the rushing holes are same, but the phase difference of the two holes position in each group is 180). At this time, the airflows at the two holes A and B has the same speed but opposite direction, so as the two holes C and D. When the two flow branches are met and rushed at the center of the interior chamber, the velocity of the airflow will be reduced due to the interaction between the mass points of the airflow. In addition, since the interior chamber itself is an expansion chamber, the sound waves enter the interior chamber from the four opposing holes A, B, C, and D, where the noise attenuation occurred. Therefore, this new principle of muffler also has the function of noise reduction while reducing the airflow speed.
Fig. 1Schematic diagram of the split-stream rushing principle of the muffler

2.2. Transmission loss calculation
The transmission loss is defined as the difference between the incident sound power level at the inlet of the muffler and the transmitted sound power level at the outlet. The transmission loss calculation formula can be expressed as:
where is transmission loss, is incident sound power level, is transmitted sound power level, is incident sound power, is transmitted sound power, is incident sound pressure level, is transmitted sound pressure level.
3. Experimental verification of transmission loss
The experimental system of the transmission loss of muffler includes a noise signal generator, a speaker, a power amplifier, a muffler, a B&K's 2250 hand-held noise analyzer and four 4189 microphones. The noise signal generator on the experimental system was started, and the transmission loss of muffler was tested by the two-load method.
3.1. Principle of two-load method
Fig. 2 is a schematic diagram of two-load method, in which the outlet boundary conditions are set to two different outlet impedances, one is the outlet opening and the other is the outlet full silencer. The method is to obtain two sets of equations by changing the outlet impedance boundary conditions without changing the position of the sound source, and then solve the quadrupole parameters to obtain the transmission loss. The two-load method is simpler because it does not need to change the position of the sound source, but only needs to change the impedance of the outlet.
In Fig. 2, is the upstream incident sound pressure level, is the reflected sound pressure level, is the downstream transmitted sound pressure level, and is the reflected sound pressure level. According to the transmission matrix formula of the muffler, the sound pressure on both sides of the muffler satisfies the following relationship:
where , , and are the quadrupole parameters of the transmission matrix. The transmission loss is defined as the ratio of sound pressure level of the incident and transmitted sound waves, and therefore is required to be zero in Eq. (2).
The transmission loss can be expressed as:
From Eq. (3), it is shown that to obtain the transmission loss, needs to be obtained. It is difficult to realize the non-reflecting end of the muffler by general experimental conditions, therefore, it is necessary to use the two-load method to list two equations, by solving the two equations to obtain , so as to obtain the transmission loss of the muffler.
Fig. 2Schematic diagram of two-load method

a) Outlet opening

b) Outlet full silencer
The equations can be given through Fig. 2(a):
The equations can be given through Fig. 2(b):
By combining Eq. (4) and Eq. (5), and eliminating , and , the expression for can be obtained as follows:
Four microphones were divided into two groups, one group was arranged upstream of the muffler and the other group was arranged downstream of the muffler to separate the incident wave and reflected wave. Using the sound pressure values measured by four microphones and by changing the outlet load, the sound pressure values of two groups of different incident and reflected waves can be obtained. The sound pressure value are inserted into Eq. (6), can be obtained, and the transmission loss of the muffler can be obtained.
The main purpose of the four-microphone method is to decompose the incident and reflected waves. Taking Fig. 2(b) as an example, the sound pressure of four measuring points be , , and , the distance between two microphones is and respectively, the distance between microphones 2 and the muffler is , the distance between microphone 3 and the muffler is . Take the inlet of the muffler as the coordinate origin, and the left direction as the positive direction. The equation can be obtained:
where is the wave number which was equal to /, is angular frequency, is sound velocity.
The upstream incident wave can be separated by microphones 1 and microphones 2:
The upstream reflection :
Similarly, if the outlet of the muffler is the coordinate origin and the direction to the right is positive, the downstream sound pressure equation can be obtained:
Downstream transmitted sound waves can be separated by microphones 3 and microphones 4:
The downstream end of the reflected acoustic wave :
Taking the signal measured by microphone 1 as the reference signal, (1, 2, 3, 4) represents the self-spectrum and cross-spectrum between the signal of microphone and the signal of first microphone, is the conjugate complex of the Fourier spectrum of the first microphone signal. Two sides of the Eq. (8), Eq. (9), Eq. (10), and Eq. (11) are multiplied by the conjugate complex of microphone 1, and then they turn into:
The test results under two different load conditions are inserted into Eq. (12), can be obtained as:
Finally, the transmission loss of the muffler can be calculated by inserting Eq. (14) into Eq. (3).
3.2. Numerical simulation
A split-stream rushing exhaust muffler was selected from the existing mufflers of our research group as the transmission loss experimental object, its size is as follows: diameter of the interior pipe is 70 mm, the shape of the rushing hole is rectangle (the rectangle's width is 45.2 mm and the height is 10 mm), the center distance of the rushing hole is 126 mm, the cone angle of the interior pipe is 90° and the number of rushing holes are 2 groups. The muffler is defined as the non-optimized muffler.
3.2.1. Muffler mesh for numerical calculation
The three-dimensional geometric model of the non-optimized muffler was built by using SolidWorks software, the solid model of the fluid region was generated by using Hyper Mesh, and the surface meshes were generated by using triangles, the mesh scale of 0.5 mm-2.0 mm, a growth rate of 1.23 %, a maximum deviation of 0.1 mm, and a maximum characteristic angle of 15°, the number of mesh nodes was 171068, the number of surface meshes was 197936. After completing the surface meshes, the tetra mesh was used to mesh it into fluid meshes, the number of fluid meshes was 1407447. The meshing diagrams are shown as in Fig.3.
Fig. 3Meshing diagrams of the non-optimized muffler

3.2.2. Numerical calculation method for transmission loss
The fluid meshes were imported into the acoustic module of LMS Virtual. Lab software, and the material property was defined as air, the sound velocity is 340 m/s, and the density is 1.225 kg/m3. The unit vibration velocity at the inlet end of the muffler was defined as –1 m/s, indicating that the airflow flows into the muffler from the inlet end. The export end was defined as the boundary of full sound absorption properties, the acoustic impedance is:
where is acoustic impedance, is acoustic admittance, is air density, and is sound velocity.
Bringing and into Eq. (15), it can be obtained 1.225 kg/m3×340 m/s = 416.5 kg/m2s).
3.3. Verification results
3.3.1. Testing equipment of transmission loss
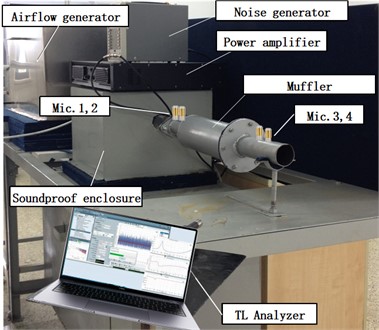
Fig. 4 is a site picture of the muffler transmission loss testing, the experimental platform was built based on the two-load method, which was located in the center of the laboratory, with the center of the muffler at a distance of 1.1 m from the ground and a distance of more than 4.2 m from the surrounding walls of the laboratory. The experimental platform consists of airflow generator, noise generator, power amplifier, muffler, microphone, soundproof enclosure, and TL analyzer. The sound source signal was generated by the noise generator and driven by the power amplifier. Four microphones were installed on circular pipes at the inlet and outlet of the muffler.
Fig. 4Test site of transmission loss
3.3.2. Comparison between numerical calculation and experimental of transmission loss
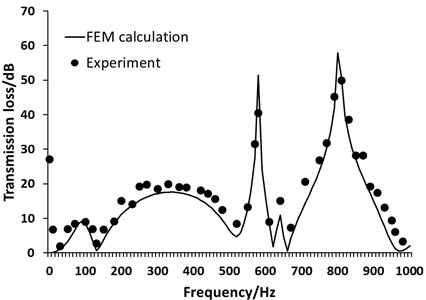
The comparison between the numerical calculation of transmission loss and the experimental results is shown as in Fig. 5. It can be seen that the numerical calculated value is good agreement with the experimental value, showing that the numerical calculation results are effective and accurate, it can provide a basis for the subsequent calculation of the transmission loss based on Box-Behnken response surface experiment.
Fig. 5Comparison of FEM calculation and test of transmission loss
4. Experimental design and results
4.1. Experiment object
According to the main parameters of the prototype and the principle that all the airflow section areas through the muffler are not lower than its inlet area, the main structural dimensions of the new muffler are designed, as shown in Fig. 6. The specific dimensions are as follows: 42 mm, 70 mm-90 mm, 100 mm, 50 mm, 638 mm, 95 mm, 100 mm, 518 mm, the cone angle of the outer pipe: = 90°, the cone angle of the interior pipe: 30°-90°, the total flow section area of the two groups of rushing hole: 1808 mm2, the center distance of the rushing hole: , 5 mm, and the wall thickness of the muffler is 1.5 mm.
Fig. 6Schematic diagram of the split-stream rushing exhaust muffler

4.2. Experimental design
4.2.1. Experimental method
The experiment was designed by using the Box-Behnken module of Design Expert 13.0 software, the Box-Behnken response surface design method is a mathematical statistical method for solving multivariate problems, and it is commonly used to find the optimal experimental conditions when there is a multivariate nonlinear relationship between factors and response values [25].
4.2.2. Experimental factors and factor levels
The noise energy at the exhaust outlet of the single cylinder diesel engine is mainly concentrated below 1000 Hz [5], so the average transmission loss in the frequency band of 0-1000 Hz was taken as the experimental index. The experimental factors are the diameter of interior pipe (A), the shape of rushing hole (B), the center distance of rushing hole (C), the cone angle of interior pipe (D), the number of rushing holes (E). The experimental factors and levels are shown as in Table 1.
Table 1Factors and levels of experiments
Parameter | Factor | Level | ||
–1 | 0 | 1 | ||
Diameter of the interior pipe (mm) | A | 70 | 80 | 90 |
Shape of the rushing hole | B | Circle | Ellipse | Rectangle |
Center distance of the rushing hole | C | |||
Cone angle of the interior pipe (°) | D | 30 | 60 | 90 |
Number of rushing holes (group) | E | 2 | 4 | 6 |
The levels of factors B and C were selected based on reference [22]. At the condition that the cross-sectional area of the rushing hole remains unchanged, circular, elliptical, and rectangular were selected as experimental factor levels for factor B. The rushing holes are arranged in the direction of parallel to the central axis of the muffler, so the shape of the rushing hole gradually changes from a circular shape to a rectangular shape, the shapes of rushing hole is shown as in Fig. 7. According to the length of the inner pipe and the shape of rushing hole, , and were selected as three levels for factor C. The indicates that the distance between the two groups of rushing hole is the closest, and the distance between the neighboring sides of the two holes is 2 mm. The indicates that the distance between the two groups of rushing holes is the farthest, located at the extreme positions of the two ends of the inner pipe. The is the average value of the and , the corresponding structure is shown as in Fig. 8. The levels of factor E were selected based on reference [26], with three selected levels: 2, 4, and 6.
Fig. 7Shapes of the rushing hole of the muffler

a) The circle shape

b) The ellipse shape

c) The rectangle shape
Fig. 8Muffler construction with different center distances of rushing hole

a) The distance of

b) The distance of

c) The distance of
4.2.3. Experimental scheme and results
The experimental scheme and results of Box-Behnken response surface are shown as in Table 2. 46 experiments are needed to complete the evaluation of the effects of experimental factors and their interaction on transmission loss.
Table 2Experimental scheme and results
Trail No. | Transmission loss (dB) | Trail No. | Factor | Transmission loss (dB) | |||||||||
A | B | C | D | E | A | B | C | D | E | ||||
1 | –1 | –1 | 0 | 0 | 0 | 12.307 | 24 | 0 | 1 | 1 | 0 | 0 | 6.592 |
2 | 1 | –1 | 0 | 0 | 0 | 18.911 | 25 | –1 | 0 | 0 | –1 | 0 | 13.904 |
3 | –1 | 1 | 0 | 0 | 0 | 12.504 | 26 | 1 | 0 | 0 | –1 | 0 | 20.574 |
4 | 1 | 1 | 0 | 0 | 0 | 18.824 | 27 | –1 | 0 | 0 | 1 | 0 | 11.476 |
5 | 0 | 0 | –1 | –1 | 0 | 16.294 | 28 | 1 | 0 | 0 | 1 | 0 | 15.407 |
6 | 0 | 0 | 1 | –1 | 0 | 11.463 | 29 | 0 | 0 | –1 | 0 | –1 | 13.448 |
7 | 0 | 0 | –1 | 1 | 0 | 11.389 | 30 | 0 | 0 | 1 | 0 | –1 | 7.164 |
8 | 0 | 0 | 1 | 1 | 0 | 7.951 | 31 | 0 | 0 | –1 | 0 | 1 | 13.246 |
9 | 0 | –1 | 0 | 0 | –1 | 12.995 | 32 | 0 | 0 | 1 | 0 | 1 | 6.721 |
10 | 0 | 1 | 0 | 0 | –1 | 12.390 | 33 | –1 | 0 | 0 | 0 | –1 | 11.886 |
11 | 0 | –1 | 0 | 0 | 1 | 14.274 | 34 | 1 | 0 | 0 | 0 | –1 | 17.656 |
12 | 0 | 1 | 0 | 0 | 1 | 14.203 | 35 | –1 | 0 | 0 | 0 | 1 | 12.410 |
13 | –1 | 0 | –1 | 0 | 0 | 12.720 | 36 | 1 | 0 | 0 | 0 | 1 | 19.156 |
14 | 1 | 0 | –1 | 0 | 0 | 18.009 | 37 | 0 | –1 | 0 | –1 | 0 | 15.546 |
15 | –1 | 0 | 1 | 0 | 0 | 7.217 | 38 | 0 | 1 | 0 | –1 | 0 | 15.390 |
16 | 1 | 0 | 1 | 0 | 0 | 7.186 | 39 | 0 | –1 | 0 | 1 | 0 | 11.697 |
17 | 0 | 0 | 0 | –1 | –1 | 15.134 | 40 | 0 | 1 | 0 | 1 | 0 | 11.862 |
18 | 0 | 0 | 0 | 1 | -1 | 11.114 | 41 | 0 | 0 | 0 | 0 | 0 | 13.738 |
19 | 0 | 0 | 0 | –1 | 1 | 15.641 | 42 | 0 | 0 | 0 | 0 | 0 | 13.738 |
20 | 0 | 0 | 0 | 1 | 1 | 11.991 | 43 | 0 | 0 | 0 | 0 | 0 | 13.738 |
21 | 0 | –1 | –1 | 0 | 0 | 13.002 | 44 | 0 | 0 | 0 | 0 | 0 | 13.738 |
22 | 0 | 1 | –1 | 0 | 0 | 13.557 | 45 | 0 | 0 | 0 | 0 | 0 | 13.738 |
23 | 0 | –1 | 1 | 0 | 0 | 6.668 | 46 | 0 | 0 | 0 | 0 | 0 | 13.738 |
5. Analysis of the experimental results
5.1. Regression analysis and modeling
The analysis of Box Behnken response surface experiment results includes regression analysis and response surface analysis.
5.1.1. Selection of the response model
Multiple models were applied to model the experimental data, and the model analysis results are shown as in Table 3, Table 4 and Table 5.
Table 3Variance analysis for applied fitting models
Model | Sum of squares | Degree of freedom | Mean square | ||
Mean | 7886.42 | 1 | 7886.42 | ||
Linear | 329.71 | 5 | 65.94 | 13.61 | < 0.0001 |
2FI | 9.94 | 10 | 0.99 | 0.16 | 0.9977 |
Quadratic | 155.3 | 5 | 31.06 | 27.13 | < 0.0001 |
Cubic | 19.8 | 15 | 1.32 | 1.5 | 0.2635 |
Residual | 8.83 | 10 | 0.88 | ||
Total | 8410 | 46 | 182.83 |
Table 4R2comprehensive analysis
Model | Standard error | adjusted | predicted | PRESS | |
Linear | 2.2 | 0.6297 | 0.5834 | 0.493 | 265.46 |
2FI | 2.48 | 0.6487 | 0.4731 | 0.0428 | 501.15 |
Quadratic | 1.07 | 0.9453 | 0.9016 | 0.8813 | 114.49 |
Cubic | 0.94 | 0.9831 | 0.9241 | –0.079 | 564.95 |
Table 5Parameter estimation of model equation
Factor | Coefficient estimate | Degree of freedom | Standard error | 95 % Confidence level | VIF | |
Low | High | |||||
Intercept | 13.74 | 1 | 0.44 | 12.84 | 14.64 | – |
A | 2.58 | 1 | 0.27 | 2.03 | 3.13 | 1 |
B | –4.94×10⁻³ | 1 | 0.27 | –0.56 | 0.55 | 1 |
C | –3.17 | 1 | 0.27 | –3.72 | –2.62 | 1 |
D | –1.94 | 1 | 0.27 | –2.49 | –1.39 | 1 |
E | 0.37 | 1 | 0.27 | –0.19 | 0.92 | 1 |
AB | –0.071 | 1 | 0.54 | –1.17 | 1.03 | 1 |
AC | –1.33 | 1 | 0.54 | –2.43 | –0.23 | 1 |
AD | –0.68 | 1 | 0.54 | –1.79 | 0.42 | 1 |
AE | 0.24 | 1 | 0.54 | –0.86 | 1.35 | 1 |
BC | –0.16 | 1 | 0.54 | –1.26 | 0.94 | 1 |
BD | 0.08 | 1 | 0.54 | –1.02 | 1.18 | 1 |
BE | 0.13 | 1 | 0.54 | –0.97 | 1.24 | 1 |
CD | 0.35 | 1 | 0.54 | –0.75 | 1.45 | 1 |
CE | –0.06 | 1 | 0.54 | –1.16 | 1.04 | 1 |
DE | 0.093 | 1 | 0.54 | –1.01 | 1.19 | 1 |
A2 | 1.48 | 1 | 0.36 | 0.73 | 2.23 | 1.2 |
B2 | –0.14 | 1 | 0.36 | –0.89 | 0.61 | 1.2 |
C2 | –3.31 | 1 | 0.36 | –4.06 | –2.57 | 1.2 |
D2 | 0.37 | 1 | 0.36 | –0.38 | 1.12 | 1.2 |
E2 | –0.25 | 1 | 0.36 | –0.99 | 0.5 | 1.2 |
According to the results of the analysis of variance of various models in Table 3, the linear model, the 2FI model, the quadratic equation model, and the cubic equation model can fit the transmission loss model, but the -values of the 2FI model and the cubic equation model are greater than 0.05, indicating that the fittings of the models are not significant. In terms of -value, the linear model and quadratic equation model have better fitting effects. Table 4 shows the comprehensive analysis of for various models that can fit the transmission loss model. It can be seen that the value of by quadratic model is greater than 0.9, but by linear model is less than 0.9, also by quadratic model the adjusted value and the predicted value are relatively close to each other, showing that the result by the quadratic equation model has higher correlation with the experiment, and the model is more accurate and better than by the linear model. Based on the above analysis, the quadratic model was selected as the transmission loss response model.
The confidence analysis of the quadratic model and its influencing factors in the model are shown as in Table 5. The estimated parameters in the table are the averaged values of lower and upper values of the parameters in the 95 % of confidence interval. The impact of each parameter on the response value can be inferred from the absolute values of the estimated parameters, the result is: C>A>D>E>B (linear terms), AB>AC>AD>CD>AE>BC>BE>DE>BD>CE (interaction terms of different factors), A2>C2>D2>E2>B2(quadric terms). At the same time, the positive and negative values of the estimated parameters can also indicate the affecting direction on the response value, B, C, D, AB, AC, AD, BC, CE, B2, C2, E2 are positive effects, and the other parameters are negative effects.
The final mathematical model of transmission loss by encoded values is: TL=13.74+2.58A-0.005B-3.17C-1.94D+0.37E-0.071AB-1.33AC-0.68AD+0.24AE-0.16BC+0.08BD+0.13BE+ 0.35CD-0.06CE+0.093DE+1.48A2-0.14B2-3.31C2+0.37D2-0.25E2.
5.1.2. Model verification
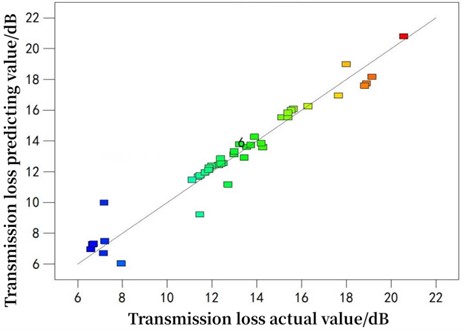
Although the conformity degree of each model has been compared during the selection of the response models, the comparisons of value and value are relatively abstract, so the selected model still needs to be verified in other ways. The internally studentized residuals are used to do the comparison for actual value and predicting value, the result is shown as in Fig. 9. The distribution of points in the figure is a straight line, indicating the reliability of the model's prediction.
Fig. 9Comparison of predicted and actual transmission loss
5.2. Analysis on influencing factors of transmission loss
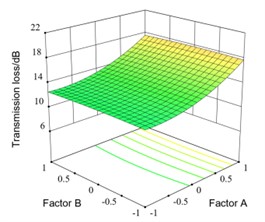
In this work, the influence of the second-order interaction of the experimental factors on the transmission loss is analyzed by 3D graphs, the results are shown as in Fig. 10. In each graph, except for the two analyzed factors, the other factors have a certain value, which are the corresponding values to the 0 level of each factor in the Box-Behnken experiment, the values are as follows: 80 mm, "ellipse", , 60° and 4 groups.
The interaction response surface between factor A and factor B is shown as in Fig. 10(a). It can be seen that when A is constant, the transmission loss remains basically unchanged with the B changes from circular to rectangular. When B is constant, the transmission loss increases with the increase of A. When B is rectangular and A increases from 70 mm to 90 mm, the transmission loss increases from 12.57 dB to 17.58 dB, increased by 5.01 dB and the increasing trend is significant.
The interaction response surface between factor A and factor C is shown as in Fig. 10(b). It can be seen that when C is constant, the transmission loss firstly decreases slowly and then increases rapidly with the increase of A. When C is and A increases from 70 mm to 90 mm, the transmission loss decreases from 12.64 dB to 12.62 dB and then increases to 17.80 dB. When A is between 70 mm and 80 mm, the transmission loss firstly increases and then decreases with factor C changes from to . When A is 70 mm and C increases from to , the transmission loss increases from 11.17 dB to 12.64 dB and then decreases to 7.49 dB. When A is between 80 mm and 90 mm, the transmission loss decreases with factor C changes from to and the decreasing trend of transmission loss between and is smaller than that between and .
The interaction response surface between factor A and factor D is shown as in Fig. 10(c). It can be seen that when A is constant, the transmission loss decreases with the increase of D. When A is 90 mm and D increases from 30° to 90°, the transmission loss decreases from 20.45 dB to 14.35 dB, decreased by 6.10 dB and the decreasing trend is significant. When D is constant, the transmission loss increases as the increase of A. When D is 90° and A increases from 70 mm to 90 mm, the transmission loss increases from 14.35 dB to 20.45 dB, increased by 6.10 dB and the increasing trend is significant.
The interaction response surface between factor A and factor E is shown as in Fig. 10(d). It can be seen that when A is between 75 mm and 90 mm, the transmission loss increases with the increase of E. However, the changes of transmission loss are not significant with E changes from 4 to 6 groups. For example, when A is 80mm, when E is 2, 4, and 6, the transmission loss is 16.94 dB, 17.80 dB, and 18.16 dB respectively. When A is between 75 mm and 90 mm, the transmission loss firstly increases and then decreases with increases of E. For example, when A is 70 mm, the transmission loss increases from 12.26 dB to 12.64 dB and then decreases to 12.52 dB with the number of counter holes increases.
The interaction response surface between factor B and factor C is shown as in Fig. 10(e). It can be seen that when C is constant, the transmission loss remains basically unchanged when factor B changes from circular to rectangular. When B is constant, the transmission loss firstly increases and then decreases when C changes from to , but the overall trend is decreasing. When B is rectangular and C changes from to , the transmission loss increases from 13.62 dB to 14.39 dB and then decreases to 6.96 dB.
The interaction response surface between factor B and factor D is shown as in Fig. 10(f). It can be seen that when D is constant, the transmission loss remains basically unchanged when factor B changes from circular to rectangular. When B is constant, the transmission loss decreases when D changes from 30° to 90°. When B is rectangular and D changes from 30° to 90°, the transmission loss decreases from 15.87 dB to 12.17 dB.
The interaction response surface between factor B and factor E is shown in as Fig. 10(g). It can be seen that the transmission loss remains basically unchanged with the changes of B. The transmission loss increases with the increase of E, but the changes of transmission loss are not significant with E changes from 4 to 6 groups
The interaction response surface between factor C and factor D is shown in Fig. 10(h). It can be seen that when C is constant, the transmission loss decreases with D changes from 30° to 90°. When C is and D changes from 30° to 90°, the transmission loss decreases from 16.29 dB to 11.75 dB, decreased by 4.54 dB. When D is constant, the transmission loss firstly increases and then decreases when C changes from to . When D is 30° and C changes from to , the transmission loss increases from 16.29 dB to 16.98 dB and then decreases to 9.36 dB.
The interaction response surface between factor C and factor E is shown as in Fig. 10(i). It can be seen that when C is constant, the transmission loss remains basically unchanged with E increases. When E is constant, the transmission loss increases firstly and then decreases with C changes from to . When E is 2 groups, the transmission loss increases from 12.92 dB to 13.84 dB and then decreases to 6.70 dB with C changes from to .
Fig. 10Interaction response surface of different factors
a) Interaction response surface between factor A and factor B
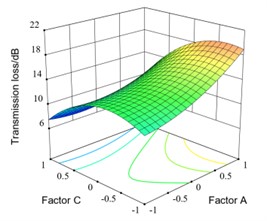
b) Interaction response surface between factor A and factor C
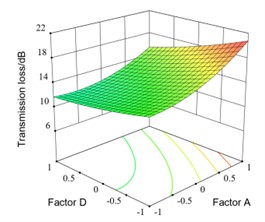
c) Interaction response surface between factor A and factor D
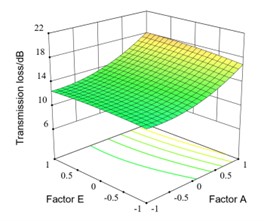
d) Interaction response surface between factor A and factor E
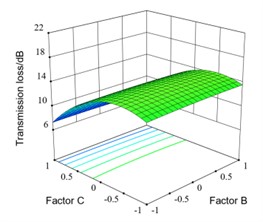
e) Interaction response surface between factor B and factor C
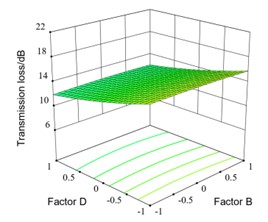
f) Interaction response surface between factor B and factor D
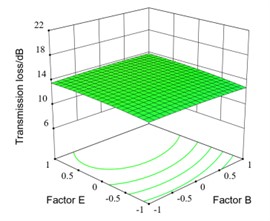
g) Interaction response surface between factor B and factor E
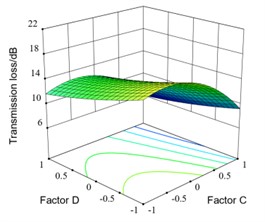
h) Interaction response surface between factor C and factor D
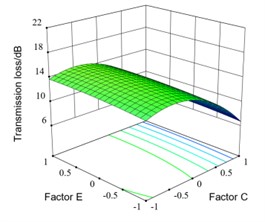
i) Interaction response surface between factor C and factor E
j) Interaction response surface between factor D and factor E
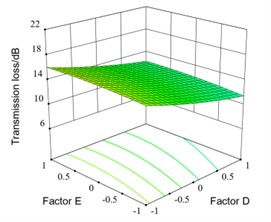
The interaction response surface between factor D and factor E is shown as in Fig. 10(j). It can be seen that when E is constant, the transmission loss decreases with D changes from 30°to 90°. When D is constant, the transmission loss increases with the increase of E, but the increase of transmission loss is not significant with E changes from 4 to 6 groups.
5.3. Optimization of experimental scheme and result verification
Based on the analysis of experimental results and regression model, the transmission loss was taken as the optimization index for optimization calculation, and the optimized results are shown as in Table 6. According to the fact, the better experimental scheme was obtained by rounding the parameters, the better experimental scheme is: 90 mm, “rectangle”, , 30° and 4. The transmission loss calculated by the model is 21.97 dB.
Table 6Optimization schemes of transmission loss
Serial No. | Factor | Expectations | ||||
A | B | C | D | E | ||
1 | 89.97 | 1.00 | 0.00 | 30.35 | 4.52 | 100 % |
2 | 89.99 | 1.00 | 0.00 | 30.11 | 4.38 | 100 % |
3 | 90.00 | 1.00 | 0.00 | 30.11 | 4.30 | 100 % |
4 | 89.97 | 1.00 | 0.00 | 30.31 | 4.66 | 100 % |
5 | 89.88 | 1.00 | 0.00 | 30.04 | 4.53 | 100 % |
6 | 89.98 | 1.00 | 0.00 | 30.45 | 4.50 | 100 % |
Since the better experimental scheme is not included in Box Behnken experiments, the accuracy of the mathematical model needs to be further verified. The method in section 3.2.1 was used to divide mesh, the number of mesh nodes was 131204, the number of surface meshes was 216410, the number of fluid meshes was 1220705. The meshing diagrams are shown as in Fig. 11. The method in section 3.2.2 was used to calculate the transmission loss of optimized scheme, the average transmission loss of the better scheme is 20.52 dB. Compared with the calculated value of the transmission loss model, the difference is 1.45 dB, the relative error is 6.65 %, showing that the transmission loss model is accurate and reliable, and the model can predict the average transmission loss of the split-stream rushing exhaust muffler.
Fig. 11Meshing diagrams of the optimized muffler

Fig. 12Comparison of transmission loss of non-optimized and optimized muffler
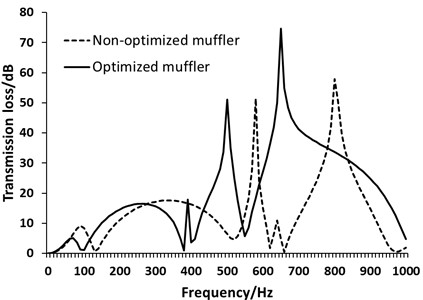
The comparison of the transmission loss curves of the non-optimized and optimized muffler is shown as in Fig. 12. It can be seen that the transmission loss of the optimized muffler is much better than that before. The average transmission loss of the non-optimized muffler in the 0-1000 Hz frequency band is 13.80 dB, but the optimized muffler is 20.52 dB, raised by 48.70 %.
6. Performance verifications for the muffler
In order to verify the superior performance of the optimized muffler, the acoustic performance and aerodynamic performance between the optimized muffler and the not optimized muffler of the diesel engine were tested and compared. Based on the above orthogonal test results, a solid muffler with a wall thickness of 1.5 mm was fabricated by Q235 carbon steel. The optimized muffler's silencing volume was ensured to be identical with the not optimized muffler of CG25 single-cylinder diesel engine.
6.1. Test of acoustic performance
The insertion loss was selected as the appraisal parameter, and a B&K 2250 handheld noise test analyzer was used for the tests and carried out on a self-made test bench according to the national standard for insertion loss [18]. The experiment was carried out on the CG25 single cylinder diesel engine. The test point is located at the 45 direction with the muffler axis and 1.0 m away from the muffler outlet. The test of insertion loss is divided into two parts. First, the straight tube with the same length as the muffler is tested to measure its 1/3 octave sound pressure level at the measuring point. Then, the 1/3 octave sound pressure level of the muffler at the measuring point is tested, and the insertion loss of the muffler is the subtraction of the two. Fig. 13 is a site picture of the muffler insertion loss testing.
Fig. 13Photo of the muffler insertion loss test site
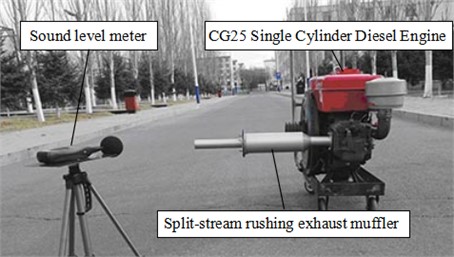
Fig. 14 shows the comparison result. It can be seen that the noise attenuation for the two mufflers in the frequency less than 125 Hz is almost zero, and even the insertion loss in some frequency bands has a negative value, this is attributed to the structure of the muffler, indicating that the muffler does not work in noise reduction in this frequency band, but regenerative noise is generated.
At frequency of 125 Hz, 160 Hz, 315 Hz, 400 Hz, 500 Hz, 630 Hz, 1250 Hz and 1600 Hz, the insertion loss of the optimized muffler is greater than the not optimized muffler. The average insertion loss of the optimized muffler in the all frequency band is greater than that of the not optimized muffler. The average insertion loss of the optimized muffler is 4.35 dB, while the average insertion loss of not optimized muffler is 4.05 dB, raised by 7.4 %.
6.2. Test of aerodynamic performance
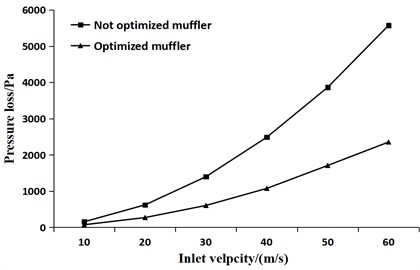
The pressure loss was used to appraise the aerodynamic performance of the muffler. According to the national standard for pressure loss test [18], the total pressure at the inlet and outlet for the optimized muffler and the not optimized muffler was separately measured, thus, the difference between its inlet and outlet was the pressure loss for each muffler. The test was performed on a self-made test bench at six different inlet speeds. Fig. 15 shows the pressure loss curves of the optimized muffler and the not optimized muffler. As it is seen from Fig. 15, the overall trend of the two curves is the same, increasing parabolically with speed. The pressure loss of the optimized muffler is slightly lower than that of the not optimized muffler. When the inlet velocity is 40 m/s, compared with the pressure loss of 2486.7 Pa for the not optimized muffler, the pressure loss of the optimized muffler is 1073.9 Pa, reduced by 56.8 %.
Fig. 14Comparison of insertion loss for mufflers
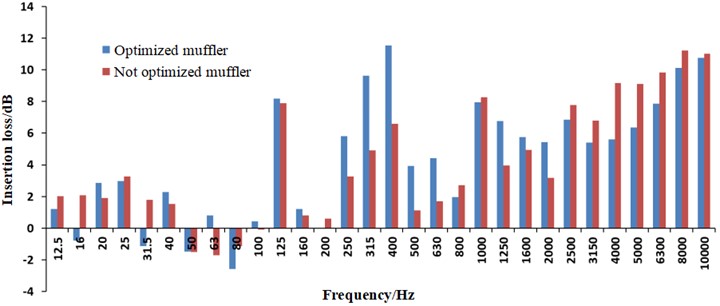
Fig. 15Comparison of muffler pressure loss
7. Conclusions
1) Box-Behnken module of Design Expert software was used to design the transmission loss experiment of the split-stream rushing exhaust muffler. Regression analysis method was used to establish the mathematical model of transmission loss. The accuracy of the mathematical model was verified through significance testing and validation experiments, indicating that the model can predict the transmission loss of the split-stream rushing exhaust muffler.
2) The significance of single factors, second-order interaction of different factors, and quadratic term of factors on response values was analyzed through model equation parameter estimation. the result is: C>A>D>E>B (linear terms), AB>AC>AD>CD>AE>BC>BE>DE>BD>CE (interaction terms of different factors), A2>C2>D2>E2>B2(quadratic terms). Indicating that the center distance of the rushing hole and the diameter of the interior pipe are the main influencing factors of the transmission loss of the split-stream rushing exhaust muffler.
3) The influence of experimental factors interaction on response values was analyzed through three-dimensional surface graph. The results show that the diameter of the interior pipe and the center distance of the rushing hole are the main factors that affect the transmission loss. The transmission loss increases with the increase of the diameter of the interior pipe. When the diameter of the interior pipe is between 70 mm and 80 mm, the transmission loss firstly increases and then decreases with the center distance of the rushing hole changes from to . When the diameter of the interior pipe is between 80 mm and 90 mm, the transmission loss decreases with the center distance of the rushing hole changes from to . When the diameter of the interior pipe is constant, the transmission loss decreases with the cone angle of the interior pipe changes from 30° to 90°. The effect of the rushing hole shape on transmission loss is not significant. The transmission loss increases with the increase of the number of rushing holes, but the increase of transmission loss is not significant with the number of rushing holes changes from 4 to 6 groups.
4) Taking the transmission loss as the optimization index, the better experimental conditions were obtained. The result is that when the diameter of the interior pipe is 90 mm, the shape of the rushing hole is “rectangle”, the center distance of the rushing hole is , the cone angle of the interior pipe is 30° and the number of rushing holes are 4 groups, the transmission loss is the largest.
5) The transmission loss of the optimized muffler and the not optimized muffler were analyzed comparatively. The results show that the average transmission loss of the optimized muffler in the 0-1000 Hz frequency band is 20.52 dB, compared to the not optimized muffler, the average transmission loss is raised by 48.70 %.
6) The acoustic performance and aerodynamic performance of the optimized muffler and the not optimized muffler were analyzed comparatively. The results show that the average insertion loss of the optimized muffler is raised by 7.4 %; compared to the not optimized muffler, the pressure loss is reduced by 56.8 % when the inlet speed is 40 m/s.
References
-
W. Wang et al., “Combustion control strategy of active jet ignition of natural gas engine,” (in Chinese), Automotive Engineering, Vol. 44, No. 12, pp. 1919–1925, 2022, https://doi.org/10.19562/j.chinasae.qcgc.2022.12.013
-
X. Z. Xie, “Noise optimization design on the exhaust muffler of a special vehicle based on the improved genetic algorithm,” Journal of Vibroengineering, Vol. 17, No. 8, pp. 4625–4639, 2015.
-
X.-L. Xie, F. Gao, X.-Y. Huang, C. Huang, and J. Li, “Numerical optimization of flow noises for mufflers based on the improved BP neural network,” Journal of Vibroengineering, Vol. 18, No. 4, pp. 2626–2640, Jun. 2016, https://doi.org/10.21595/jve.2016.16671
-
H. J. Zhang, “Study on pressure loss model of expansion chamber exhaust muffler for diesel,” (in Chinese), Internal Combustion Engine and Accessories, Vol. 2023, No. 7, pp. 29–31, 2023, https://doi.org/10.19475/j.cnki.issn1674-957x.2023.07.037
-
M. V. Kulkarni and R. B. Ingle, “Validation of set up for experimental analysis of reactive muffler for the determination of transmission loss: Part 1,” Noise and Vibration Worldwide, Vol. 49, No. 6, pp. 237–240, Jul. 2018, https://doi.org/10.1177/0957456518781857
-
S. Das et al., “A novel design for muffler chambers by incorporating baffle plate,” Applied Acoustics, Vol. 197, p. 108888, Aug. 2022, https://doi.org/10.1016/j.apacoust.2022.108888
-
A. Y. Ismail, J. Kim, S.-M. Chang, and B. Koo, “Sound transmission loss of a Helmholtz Resonator-based acoustic metasurface,” Applied Acoustics, Vol. 188, p. 108569, Jan. 2022, https://doi.org/10.1016/j.apacoust.2021.108569
-
Y. Suwei, H. Jiuxiao, and Z. Haichao, “Performance of micro-perforated muffler with flexible back cavity for water filled pipelines,” Applied Acoustics, Vol. 225, p. 110192, Nov. 2024, https://doi.org/10.1016/j.apacoust.2024.110192
-
R. Li, Y. Zhou, C. Wei, and Y. Mi, “Analysis of coupling effect between chambers of reactive muffler,” Applied Acoustics, Vol. 191, No. 5, p. 108679, Mar. 2022, https://doi.org/10.1016/j.apacoust.2022.108679
-
B. Ng, K. W. Cheng, C. K. Lee, and S. W. T. Tsang, “Parametric study of acoustic windows using a Green’s Function transfer matrix method,” Applied Acoustics, Vol. 193, No. 5, p. 108743, May 2022, https://doi.org/10.1016/j.apacoust.2022.108743
-
A. M. Shaaban, C. Anitescu, E. Atroshchenko, and T. Rabczuk, “An isogeometric Burton-Miller method for the transmission loss optimization with application to mufflers with internal extended tubes,” Applied Acoustics, Vol. 185, p. 108410, Jan. 2022, https://doi.org/10.1016/j.apacoust.2021.108410
-
Y. Zhang, P. Wu, Y. Ma, H. Su, and J. Xue, “Analysis on acoustic performance and flow field in the split-stream rushing muffler unit,” Journal of Sound and Vibration, Vol. 430, pp. 185–195, Sep. 2018, https://doi.org/10.1016/j.jsv.2018.04.025
-
H. Su, “Study on airflow velocity of split-stream-rushing exhaust muffler unit for diesel engine,” (in Chinese), Inner Mongolia Agricultural University, Hohhot, China, 2017.
-
P. Wu, “Development of a diesel engine muffler using a mixture of out-of-phase split exhaust streams,” Noise Control Engineering Journal, Vol. 58, No. 6, pp. 621–626, Jan. 2010, https://doi.org/10.3397/1.3502423
-
H. Su et al., “Simulation and experiment on acoustic characteristics of out-of-phase and split-stream-rushing muffler for diesel engine,” (in Chinese), Chinese Internal Combustion Engine Engineering, Vol. 36, No. 4, pp. 66–70, 2015, https://doi.org/10.13949/j.cnki.nrjgc.2015.04.013
-
H. Su et al., “Simulation of airflow characteristics of a new type of split flow gas opposed exhaust muffler,” (in Chinese), Journal of Internal Combustion Engine, Vol. 36, No. 2, pp. 159–165, 2018, https://doi.org/10.16236/j.cnki.nrjxb.201802021
-
L. M. Huo et al., “Analysis of internal flow field and regeneration noise in the split-stream-rushing muffler,” (in Chinese), Noise and Vibration Control, Vol. 39, No. 2, pp. 215–221, 2019, https://doi.org/10.3969/j.issn.1006-1355.2019.02.041
-
H. Su, P. Wu, J. Xue, Y. Zhang, and H. Zhang, “Analysis of flow field characteristics and structure optimization of the split-stream rushing muffler for diesel engine,” Noise Control Engineering Journal, Vol. 68, No. 1, pp. 101–111, Jan. 2020, https://doi.org/10.3397/1/37688
-
Y. A. Zhang et al., “Noise reduction and pressure loss of a split-stream rushing silencing structure,” (in Chinese), Journal of Internal Combustion Engine, Vol. 39, No. 1, pp. 88–95, 2021, https://doi.org/10.16236/j.cnki.nrjxb.202101012
-
H. Su et al., “Effects of rushing hole on pressure loss of the split-stream-rushing muffler unit,” (in Chinese), Journal of Internal Combustion Engine, Vol. 35, No. 2, pp. 178–184, 2017, https://doi.org/10.16236/j.cnki.nrjxb.201702026
-
H. J. Zhang et al., “Noise model of airflow regeneration in exhaust muffler with split-flow gas hedging,” (in Chinese), Vibration and Shock, Vol. 40, No. 9, pp. 63–70, 2021, https://doi.org/10.13465/j.cnki.jvs.2021.09.009
-
H. J. Zhang et al., “Model study on pressure loss of the split-streamrushing exhaust muffler,” (in Chinese), Journal of Internal Combustion Engine, Vol. 88, No. 5, pp. 433–440, 2020, https://doi.org/10.16236/j.cnki.nrjxb.202005056
-
C. J. Wu, X. J. Wang, and H. B. Tang, “Transmission loss prediction on a single-inlet/double-outlet cylindrical expansion-chamber muffler by using the modal meshing approach,” Applied Acoustics, Vol. 69, No. 2, pp. 173–178, Feb. 2008, https://doi.org/10.1016/j.apacoust.2006.06.011
-
W. H. Tan and Z. M. Ripin, “Analysis of exhaust muffler with micro-perforated panel,” Journal of Vibroengineering, Vol. 15, No. 2, pp. 558–573, 2013.
-
N. Jalal and M. Zidi, “Influence of experimental conditions on visco-hyperelastic properties of skeletal muscle tissue using a Box-Behnken design,” Journal of Biomechanics, Vol. 85, pp. 204–209, Mar. 2019, https://doi.org/10.1016/j.jbiomech.2019.01.020
-
H. J. Zhang, “Model study and structure optimization of the split-stream-rushing exhaust muffler unit,” (in Chinese), Inner Mongolia Agricultural University, Hohhot, China, 2020.
About this article
This work was financially supported by the Huzhou Natural Science Foundation (2023YZ01), The Special Project for High level Talents at Huzhou Vocational and Technical College (2022GY14), The Inner Mongolia Natural Science Foundation Project (2023MS05022), and the Key Laboratory of New Energy Electric Drive Technology of Huzhou.
The datasets generated during and/or analyzed during the current study are available from the corresponding author on reasonable request.
Haijun Zhang has written this paper, the experiment was conducted by He Su.
The authors declare that they have no conflict of interest.
