Abstract
Aimed at the large noise of tail pipe, the method of fluid dynamics was firstly applied to analyze the inner flow field of the exhaust muffler. According to the result, the large noise of tail pipe was mainly caused by air flow regeneration noise, and the vice muffler was not the major component for generating airflow noise. The largest pressure of the whole muffler system was at the outlet end of main mufflers. The largest flow velocity was in the connection pipe between main mufflers and vice mufflers. Secondly, boundary element model of transmission loss for the muffler was established to compare and analyze it with the experimental. The experimental and computational value of transmission loss for the muffler has a good consistency in both change trend and numerical value, and the computational model was reliable. Finally, GA-BP neural network algorithm was used to optimize the acoustic performance of the muffler. Airflow noises of the tail pipe were effectively reduced through optimizing the inner structure of the muffler.
1. Introduction
Installing a muffler into a pipe was an effective method for reducing the upstream noise of exhaust system. Evaluation on the performance of the pipe muffler mainly adopted three indexes, namely acoustic performance, aerodynamic performance and structural performance [1]. Aerodynamic performance which reflected the airflow resistance of the muffler was usually represented by the pressure difference between the inlet and outlet of the muffler. The acoustic performance of the muffler is often represented by transmission loss. The structural performance of the muffler refers to the structural characteristics of the muffler like installation dimension and mechanical strength. Transmission loss which was only related to the structure is not affected by source characteristics and the radiation characteristics of tail pipe [2].
At present, a lot of studies about acoustic performance of the muffler have been conducted. Wang [3] adopted ANSYS to compute the transmission loss of the reactive muffler, obtained high computation accuracy within the range of low frequency and failed to conduct on an analysis in high frequency. Ge [4] analyzed the acoustic performance of the perforated tube structure and obtained a satisfactory result. Selamet [5] took advantage of 2D model to establish the theoretical model of transmission loss of the perforated muffler, obtained resonance frequencies and qualitatively analyzed the influence of muffler parameters on resonance frequencies. Meng [6] obtained resonance frequencies through solving the air flow regeneration noise of the resonance muffler, but lacked of the experimental verification. Luo [7] used finite element method to compute the transmission loss of the perforated muffler, analyzed and summarized the influence of the structural parameters on resonance frequencies. Ji [8] made use of boundary element method (BEM) to compare and analyze the transmission loss of single-cavity and dual-cavity muffler and found that double-pole expansion cavity formed by baffles improved the acoustic performance in medium frequency. Meng [9] applied finite element method to analyze the influence of the baffle’s position on the transmission loss of complex two-stage expansion muffler and found that the baffle’s position had a very small influence on the transmission loss in low and medium frequency and had a great influence on the transmission loss in high frequency. Lee [10] employed acoustic topology based on finite element method to optimize and analyze the transmission loss of the target frequency and found that transmission loss would be increased when the baffle was added to the coaxial expansion cavity muffler. Denia [12] analyzed the acoustic performance of dissipative muffler with extension structure at the inlet and outlet and obtained the correction formula which considered the coupling effect of holes. The computational result was consistent with the experimental result.
In the mentioned analysis, numerical simulation, experiments or theories were simply used to study the transmission loss of the muffler, but optimization algorithm was not applied to conduct optimization design for the muffler. This paper firstly used CFD to numerically compute the inner flow field of the muffler, combined with BEM to compute the sound pressure level (SPL) of the muffler. Finally, the mixed algorithm based on genetic algorithm and neural network was adopted to optimize the acoustic performance of the muffler.
2. Analysis of exhaust noise
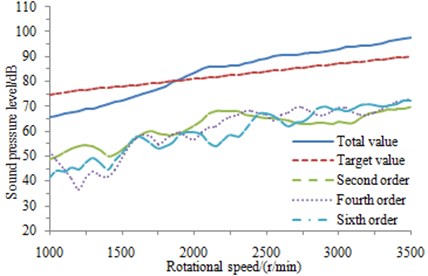
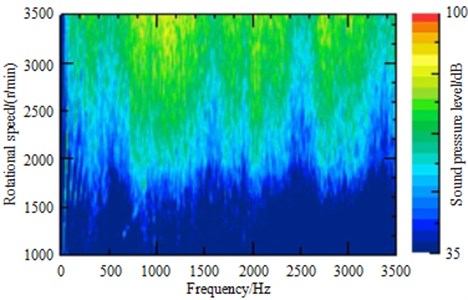
To save costs and realize platform, the original exhaust muffler was used. The noise of the exhaust orifice of the vehicle was tested. It was found that under full throttle acceleration of the third gear, the total sound pressure level (SPL) of the exhaust orifice noise above the rotating speed of 2000 r/min was higher than the design target 4 dB-6 dB, and the design and development target of the automobile cannot be reached, as shown in Fig. 1. It could be seen that the total SPL was higher than the order curve 10 dB, thus indicating that the order noise is not the main reason for the problem. As shown from Fig. 2 of the exhaust orifice noise spectrum, the airflow noise was presented obviously, with the main frequencies ranging from 800 Hz to 1500 Hz. To find the cause of the problem, it was necessary to analyze acoustic characteristics of the original exhaust muffler, and investigate whether big exhaust orifice noise was caused by the insufficient sound elimination of the muffler during the problematic frequency band.
Fig. 1Total SPL and order diagram of exhaust orifice noise
3. Acoustic characteristics of the perforated plates
Sound absorption material was filled into the muffler to improve its acoustic performance. The complex impedance and wave number would be obtained by the empirical formula or experiments [13-15]. The long fiber glass cotton was used as sound absorption material. The complex impedance z and wave number k could be obtained by a lot of experiments, as shown in Eq. (1) and (2):
wherein, σ is the flow resistance of the material. za represents the characteristic impedance of the air, and ka means the number of waves in the air. The packing density of the material is 100 kg/m3, and the flow resistance is 4896 Rayls/m.
Fig. 2Exhaust orifice noise spectrum
The related coefficient in the equation was obtained by the experimental fitting. In addition, experiments also verified that sound absorption in reference [16] had a better sound absorption performance. As a result, this sound absorption material was selected as the filled material in the muffler.
The length, hole diameter and perforation rate were set as the optimization variable in this paper. As shown in Eq. (1) and Eq. (2), sound absorption performance of the filled material in the muffler was only related to flow resistivity, characteristic impedance, wave number and density. It was not related to the length, hole diameter and perforation rate. As a result, when the muffler was optimized from structures and shapes, sound absorption performance of the filled material would be not changed.
The complex velocity and complex density of the material can be obtained by the following formula:
The 3D finite element method was employed to calculate acoustic characteristics of a muffler with the perforated structure. Very fine grids were required for an accurate description of sound field distribution of perforations, and a very large workload would be caused. Acoustic impedance was used to represent the sound pressure and particle vibration velocity on both sides of the perforated surface so as to obtain accurate results, thus greatly reducing the workload. Under different perforation rates, correction coefficients of acoustic thickness for the perforated plates were proposed by Kang [17]. And an acoustic thickness correction expression was given for the perforated plate with the perforation rate less than 40 %, thickness smaller than 0.002 m and hole diameter lower than 0.005 m based on results. Without sound absorption materials, the expression can be shown as follows:
wherein, ρa means the air density, and ca is the sound velocity. t represents the plate thickness, and dh expresses the perforated diameter. φ is the perforation rate. i is an imaginary number, and ka represents the number of waves. α is the acoustic thickness correction expression of the perforated plate.
With sound absorption materials, the characteristic impedance expression of the perforated plate is changed into the following formula [18]:
As shown in Eq. (7), when there was sound absorption material filled into the muffler. ka was the wave number. t was the thickness of the perforated plate. dn was the hole diameter. φ was the perforation rate. The perforated plate had a serious impact on the acoustic performance of the muffler. When the muffler was optimized, the hole diameter and perforation rate were set as the design variable. The change of the hole diameter and perforation rate would change the characteristic impedance of the perforated plate. As a result, the performance of the perforated plate was considered when the muffler was optimized.
4. Numerical computation of flow field for mufflers
Two-level sound elimination was performed by the analyzed and calculated exhaust muffler. The diagram of the main and vice muffler structures was shown in Fig. 3. The vice muffler was in two-chamber structure, whose inner diameter of main pipe was 61 mm and wall thickness was 1.7 mm. The inner diameter of connecting pipe for Helmholtz resonator in the first chamber was 31 mm, and long fiber glass cotton was filled in the chamber with the packing density of 100 kg/m3. The main muffler was in four-chamber structure, whose inner diameter of inlet and outlet pipe was 56.1 mm, inner diameter of reflux pipe was 54.6 mm, and pipe thicknesses were 1.5 mm. A perforated section with diameter of 3.6 mm and 106 perforations was made in the second chamber of the inlet tube, which was 50mm away from the first baffle. And a section with diameter of 3.6 mm and 291 perforations was made in the third chamber, which was 40 mm away from the second baffle. A perforated section with diameter of 3.5 mm and 252 perforations was made in the second chamber of the outlet tube. And a section with diameter of 3.6 mm and 88 perforations was made in the second chamber of the reflux pipe. 260 holes with the diameter of 3 mm were made on both the first and second baffle, while 54 holes were punched on the third baffle. Long fiber glass cotton is filled in the second chamber with the packing density of 100 kg/m3.
Fig. 3Diagram of muffler structures
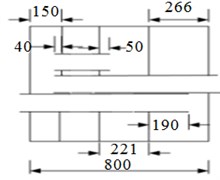
a) Structure of main muffler
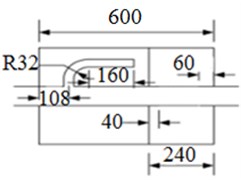
b) Structure of vice muffler
4.1. Boundary conditions
1) Inlet: The exhaust mass flow 0.171 kg/s measured at the engine bench was regarded as the inlet boundary condition, and the temperature was set to 500 °C;
2) Outlet: It was set to be a pressure boundary outlet, and an absolute pressure was a standard atmospheric pressure;
3) Wall: It was set to the boundary condition of adiabatic and frictionless no-slip wall;
4) Porous media zone: Part of sound absorption materials was set to porous media area in laminar flow, and their viscosity drag coefficients were same in three directions.
4.2. Analysis of results
Fig. 4 was the contour of flow field distribution of the muffler system. As can be seen from the figure, the largest pressure of the whole muffler system was at the outlet end of main mufflers and the largest flow velocity was in the connection pipe of main mufflers and vice mufflers. When fluid entered into the muffler system from the vice muffler, a small part of fluid firstly flowed from Helmholtz resonator and then touched the baffle. As the baffle had holes, a part of fluid would enter into the second cavity of vice mufflers. The remaining fluid circulated and flowed in the first cavity and transformed into heat energy. Fluid entering into the second cavity also circulated, flowed and transformed into heat energy to reduce the noise. Most of fluid in the internal of vice mufflers directly entered into the main muffler from the connection pipe. The main muffler had four cavities, each of which had similar effect with that of vice mufflers and mainly formed a closed space to reduce the noise. In addition, three pipes of main mufflers had some holes whose diameter was very small. Due to large resistance, fluid was greatly reduced when it flowed from holes.
Fig. 4Flow filed distribution of the muffler

a) Pressure distribution

b) Velocity distribution

c) Distribution of turbulence kinetic energy
Axial section computation results of inlet and outlet pipes for main mufflers and vice mufflers can be found in Figs. 5-7, respectively. As shown in Fig. 5, the pressure of vice mufflers was uniformly distributed in the whole structure. Two closed spaces were used to reduce airflow noises. Airflow velocity would not increase suddenly in the vice muffler. In the straight pipe, the flow velocity of airflow was relatively large and there was no obviously local turbulence. The vice muffler was mainly composed of a Helmholtz resonator and a straight pipe with simple structure. Therefore, the vice muffler would not cause large air flow regeneration noises. The vice muffler only had two cavities and there was no hole on the straight pipe. Therefore, the vice muffler had weaker ability in reducing the noise than the main muffler. As displayed from the axial sectional calculation result of main muffler inlet pipe in Fig. 6, excessive pressure was found in the fourth chamber, maximum airflow velocity was presented in the inlet pipe, and greater velocity was also found in the reflux tube. Airflow was primarily flowed from the perforated segment of the inlet pipe in the third chamber, and obvious efflux was appeared in the perforation of the third baffle; also higher turbulent kinetic energy was shown in the perforated segment of the third chamber and perforation of the third baffle of the inlet tube, which were thereby the main production positions of the flow-regenerated noise. In axial sectional calculation result of main muffler outlet pipe in Fig. 7, airflow velocity of the outlet pipe was too high and needed to be reduced.
Fig. 5Analysis result of the vice muffler

a) Pressure distribution
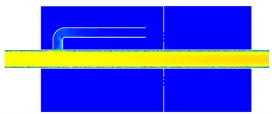
b) Velocity distribution
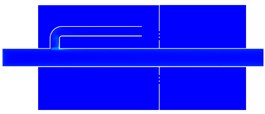
c) Distribution of turbulence kinetic energy
As determined from the above analysis, greater flow-regenerated noise would not be caused by the vice muffler, which was resulted from the main muffler at main positions of perforated segment of the inlet tube and perforation of the third baffle; meanwhile, the diameters of inlet and outlet pipes and reflux tube were too small and needed to be enlarged to decline the flow velocity.
Fig. 6Analysis result of the main muffler inlet pipe
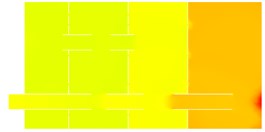
a) Pressure distribution
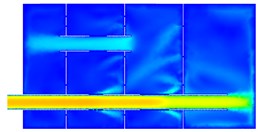
b) Velocity distribution
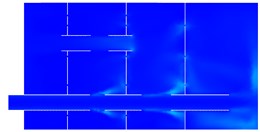
c) Distribution of turbulence kinetic energy
Fig. 7Analysis result of the main muffler outlet pipe
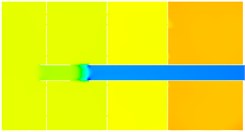
a) Pressure distribution
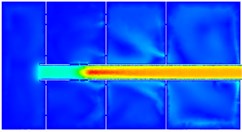
b) Velocity distribution
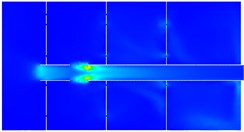
c) Distribution of turbulence kinetic energy
5. Numerical computation and experimental verification of flow noises for mufflers
5.1. Boundary element model
The computational software Virtual.Lab was adopted in this paper. For the numerical computation of transmission loss of mufflers, a unit vibration velocity was usually defined at the inlet end of the muffler and sound absorption property was defined at the outlet end of the muffler. However, the computational result could not reflect the practical condition because the exciting source applied by automobile engine to the muffler was sound pressure rather than vibration velocity when the muffler was connected with automobile engine. Therefore, a sound source was defined at the inlet of the muffler and sound absorption property was defined at the outlet when the transmission loss was computed in this paper.
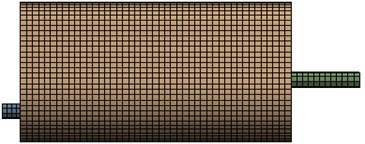
This paper adopted boundary element model to compute the transmission loss of the muffler. According to the geometric model of the muffler, its surface mesh was extracted to establish the boundary element model of main mufflers and vice mufflers, as shown in Fig. 8 and Fig. 9. When the boundary element model of mufflers was established, it was necessary to guarantee that a wavelength contained 6 element lengths at least. Otherwise, the computational result would not be reliable. Finally, the boundary element model of main muffler had 986 elements while the boundary element model of vice muffler had 637 elements.
Fig. 8Boundary element model of vice mufflers
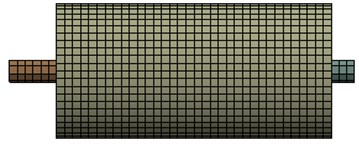
Fig. 9Boundary element model of main mufflers
5.2. Analysis of computational results
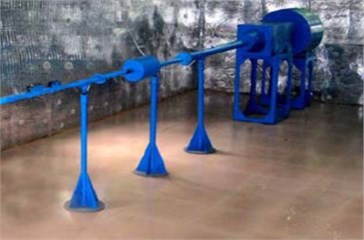
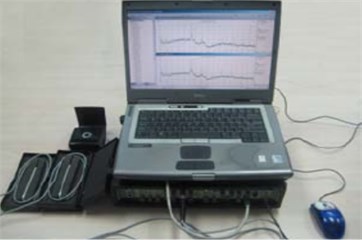
As shown in Fig. 3, the inner structure of the muffler was very complex. The reliability of acoustic model had to be verified through experiments. Muffler experiment was conducted in a semi-anechoic chamber in order to avoid the influence of environmental noises on the experimental result. Microphone of 4938 type produced by B&K Company was applied and PULSE system was used as a test system. Main mufflers and vice mufflers were then assembled into a system. At the place which was 1000 mm away from the inlet of vice mufflers, a white noise was applied as sound source. A pipe was set at the outlet end of main mufflers and extended by 800 mm. The end of the pipe was sealed by sound absorption material to prevent the sound from being propagated through the muffler. The sample frequency of the test was 5000 Hz. Each test was conducted three times to get an average value and avoid the influence of accidental error.
Fig. 10Transmission loss experiment of the muffler
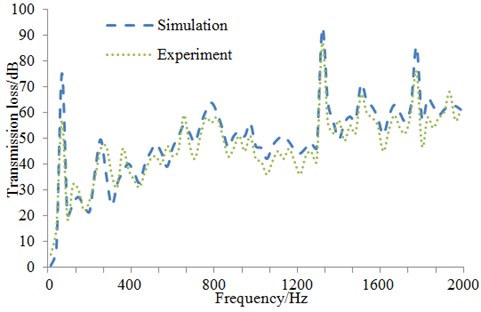
A comparison was made between the experimental and computational result of transmission loss of the muffler, as shown in Fig. 11. As can be seen from Fig. 11, they were consistent with each other and basically kept the same in terms of numerical value and change trend. In addition, the computational result was slightly more than the experimental value in the whole frequency domain. The reason was as follows. The outlet end of the muffler was set as full sound absorption property when the numerical simulation was conducted so that sound could not transmit through the outlet end. In the experiment, however, the outlet end was only sealed by sound absorption material which could not completely absorb the sound propagated from the muffler. A part of sound would transmit through sound absorption material and another part of sound would be reflected by sound absorption material to increase the experimental sound pressure of the outlet end and reduce the transmission loss. However, it was feasible to use BEM to predict the transmission loss of the muffler as a whole.
Fig. 11Comparison of transmission loss between experiment and simulation
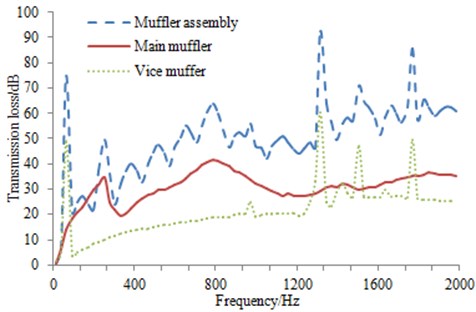
Boundary element model could be used to further obtain transmission loss of main mufflers, vice mufflers and the assembly, as shown in Fig. 12. As seen from Fig. 12, the vice muffler had lower sound elimination. Resonance frequency of Helmholtz resonator was 65 Hz. And it had a very narrow resonance band and limited sound elimination performance in the actual work process. The main muffler showed higher sound elimination in the whole band and insufficient elimination at frequencies below 160 Hz. As displayed from the result of the muffler assembly, the sound elimination of the exhaust muffler system reached over 20 dB in the whole band, even reached 40 dB especially at frequencies over 600 Hz, thus meeting the sound elimination requirements for an exhaust muffler.
As presented from the transmission loss result of the exhaust muffler, the sound elimination concerning the exhaust orifice noise reached 40 dB at frequency band of 800 Hz-1500 Hz, which met the sound elimination performance of the exhaust system. However, apparent airflow sound was still existed in the exhaust orifice, which was, in our judgment, resulted from the flow noise caused by the unreasonable exhaust muffler design.
Fig. 12Transmission loss of main and vice mufflers and the muffler assembly
6. Structural optimization of main muffler
6.1. Selection of optimization algorithm
For the exhaust muffler of engines, different muffler structures and parameters obviously had different influences on reducing the noise. Due to the complex work process of the muffler, how to theoretically compute and design the inner structure of the muffler has been a topic which was constantly discussed. This paper took the minimum mass and noises of the exhaust muffler as the optimization objective, which belonged to a multi-objective optimization problem [19-22]. However, noises as the multivariate function of structural parameters had not mathematical explicit expressions. Neural network [23-26] optimized by genetic algorithm in this paper was used to conduct optimization design for the muffler, which has not been reported yet. There were several advantages for using neural network and genetic algorithm to optimize the noise of the muffler.
Neural network toolbox was one of many toolboxes integrated into MATLAB. Network designers could use training programs related to neural network in the toolbox according to their requirements, free themselves from the tedious programming and concentrate on thinking about and solving problems to improve efficiency. If deterministic algorithm was adopted, programming would be a very difficult work. Furthermore, studies on the transmission loss of the muffler had not adopted deterministic algorithm at present.
With strong adaptability, neural network was a real multi-input and multi-output system. As a result, it was very applicable to multi-objective optimization problems. As we all know, an important factor which determined the performance of neural network was the quality of training samples. Though neural network had certain ability of learning from noise (training samples contained some wrong samples or samples lacked of some values) samples, noises would certainly influence the final result for other deterministic algorithms.
Neural network could reduce modeling or need no modeling at all and found out implicit information through observing samples. Neural network could determine learning principle after learning. This principle was not affected by people. In this way, modeling and data analysis were unnecessary. In addition, the good performance could still be obtained when the specific characteristics of signals were unknown. The nonlinearity of neural network could deal with nonlinear problems. The fact showed that a three-layer neural network could approximate any continuous nonlinear function. Neural network could also realize real-time processing and computation. As neuron could deal with high-dimensional parallel problems, it could realize the real-time processing and computation of high-dimensional data. Therefore, neural network had obvious advantages in handling nonlinear problems. The optimization problem of the muffler was a nonlinear problem. In this case, using neural network had obvious advantages.
BP neural network algorithm based on gradient descent method usually had some problems like local minimum and the dependence of the computational result on initial weights. In addition, the initial weights and thresholds of neural network were selected at great random. Especially regarding the complex problem of noise prediction with large variables and multiple samples, it was very difficult to distribute its initial value in a better local solution space. To overcome the disadvantage, genetic algorithm which was good at global search was applied to make improvements and establish GA-BP neural network. GA algorithm had the following several advantages when it was applied in BP neural network.
Compared with the traditional algorithm, GA had the following advantages. 1) GA processed codes. Therefore, it hardly limited the characteristic of objects. The objects could be continuous variables, discrete variables and various data structures. Traditional optimization algorithms usually used the actual value of variables to conduct optimization design. However, GA directly took the code [27, 28] rather than the value of variables as the operation objectives so that the concept of chromosomes could be used for the process of optimization. Especially for some optimization problems which had no numerical concept, but only owned the concept of code, encoded types showed its unique advantage. 2) GA had a good performance of global search through assessing multiple points in design space. Traditional optimization algorithms usually started the iterative search process of the optimal solution from an initial point of solution space. A single search point could not provide much search information, which led to low search efficiency and sometimes made the search process fall into the local optimal solution. GA started to search the optimal solution from the population rather than single individual. Selection, crossover and mutation operation was conducted on populations, which generated a new population. The information of many individuals was contained in populations. As a result, some unnecessary points could be avoided. Therefore, more points were really searched. 3) GA only needed the value of objective functions to conduct on genetic operation. Derivatives or other information were unnecessary. Traditional optimization algorithms needed the value of objective functions and some other information like the derivative of objective functions to determine the search direction. However, GA could determine the further search direction and range through adopting the fitness value transformed by the objective functions. Regarding many objective functions whose derivatives could not be obtained, using GA would be very convenient because it avoided the barrier of functional derivation. 4) GA adopted probability search technology, while many traditional optimization algorithms usually used deterministic search methods. There were certain transfer method and relationship from one search point to another. Due to the certainty, we could not obtain the optimal point forever, which limited the application range of algorithms. GA belonged to a probability search technology, whose selection, crossover and mutation operation were conducted in a probabilistic, increasing the flexibility of its search process. Due to the probability characteristic, some individuals with low fitness would be generated in populations. With the evolution, new populations would always generate more excellent individuals. Compared with some other algorithms, the robustness of GA would reduce the influence of parameters on the search effect as much as possible.
Based on the above factors, it was very necessary to use GA-BP neural network algorithm to conduct on the multi-objective optimization for the muffler in this paper. GA-BP neural network firstly applied genetic algorithm to optimize the initial weight distribution and obtained a better search space in solution space and finally adopted BP algorithm to search the optimal solution in the small solution space.
Fig. 13Three-layer neural network structure
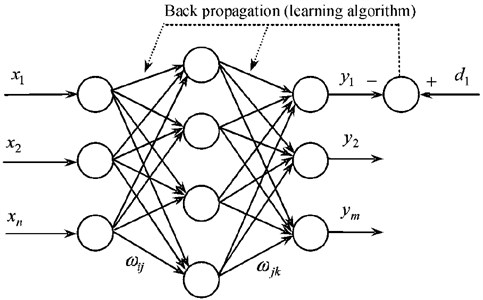
The error precision of BP neural network was related to the layer size and node size. The larger the size of layers and nodes was, the higher the error precision of network would be. Meanwhile, the network would be more complex and the training time would be also long. From the perspective of network training, changing the node size of neurons was easier than changing the layer size of network. In other words, the node size of neurons in the hidden layer instead of the size of hidden layer would like to be increased when the error precision was the same. Additionally, the ability of simulating any complex nonlinear problems would be possessed as long as there were enough neuron nodes of hidden layer. Meanwhile, theories had showed that S-type hidden layer with a deviation and BP network with a linear output layer can approximate any rational function. Based on the above principle, the hidden layer of BP network in this paper selected one layer to constitute a three-layer neural network, as shown in Fig. 13. Its activation function was S-type function. After repeated experiments, the node size of neurons in the hidden layer was selected as 90. According to actual problems, the node size of neurons in the input and output layer were 20 and 4, respectively. Activation function in the output layer was linear function. When network training process adopted self-adaptive learning rate, the initial learning rate could be relatively small and set as 0.02. The error precision of network training was 0.005.
Fig. 14Optimization process of improved neural network
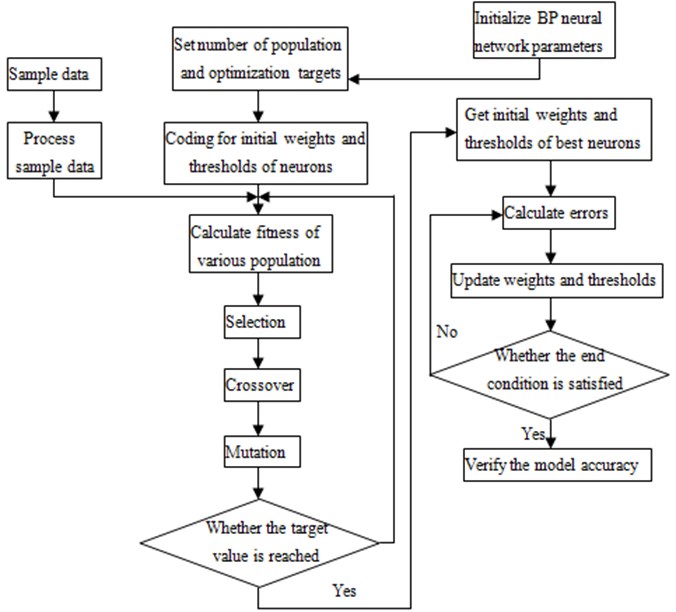
As can be seen from Fig. 14, the specific optimization process of this improved neural network model was shown as follows:
1) Read the stored data;
2) Carry out the normalization processing for data;
3) Set the number of hidden layer;
4) Initialize the evolution times, population size, crossover and mutation probabilities;
5) Conduct real number encoding for populations, and set error between the predicted data and expected data as the fitness function;
6) Circulate the selection, crossover, mutation and calculation fitness until the evolution times is reached, so as to acquire the best initial weights and thresholds;
7) Construct BP neural network through obtained best initial weights and thresholds;
8) Train BP neural network by using the training data;
9) Test neural network through the application of test data and carry out the anti-normalization processing for the predicted data;
10) Analyze error between the predicted data and expected data.
6.2. Verification and analysis of optimization results
A main muffler not only had a lighter mass, but also needed to ensure the minimum SPL at the outlet end, which was a multi-objective optimization problem. The GA-BP neural network proposed in the paper was very superior in terms of solving multi-objective optimization problems. Not only parallel computing could be conducted by it, but the computational accuracy could be improved. What’s more critical, all optimization processes were carried out on the commercial software MATLAB, which integrated GA modules and neural network modules. Therefore, the simple preparation of an intermediate program, instead of the reprogramming to combine the two algorithms, will allow the GA algorithm to be integrated into the neural network model, thus saving resources and time. The mathematical model of the main muffler was shown below:
40mm≤t1≤60mm,
40mm≤t2≤60mm,
0mm≤t3≤150mm,
1mm≤d≤4.5mm,
10%≤r≤30%,
wherein, m is the total mass of the muffler, ¯SPL represents the average SPL at the outlet end of the muffler, t1 means the diameter at the inlet end of the muffler, t2 indicates the diameter at the outlet end of the muffler, t3 means the length of the perforation section in the second cavity, d represents the diameter hole in the perforation section, and r is perforation rate.
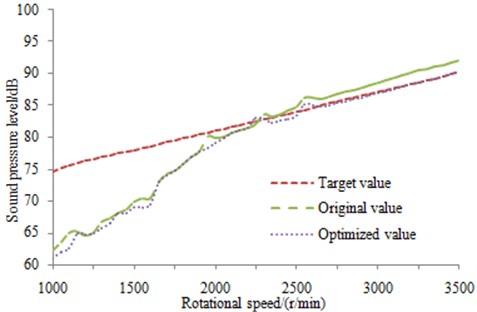
The improved neural network model above was employed to conduct the optimization design for the muffler. In the process, 1500 sets of datawere used to build the network and 300 sets of data were applied to test the network as the experimental data. The optimized parameters were compared with those before optimization as shown in Table 1. The optimized parameters were utilized to remodel and manufacture the main muffler, thus allowing it to be combined with the original vice muffler. The SPL at the outlet end was tested and compared with the original result, as shown in Fig. 15. It was indicated that the optimized SPL was significantly improved in the whole frequency band, and the effectiveness of the optimization strategies and algorithms were verified.
Fig. 15SPL comparison at the outlet before and after optimization
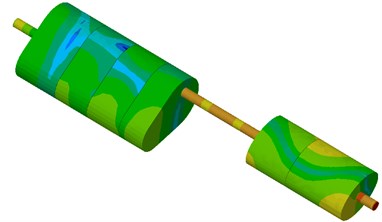
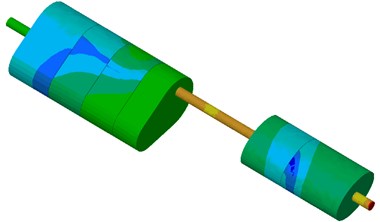
The contour of sound pressure of the muffler at the same frequency was extracted before and after optimization, as shown in Fig. 16. As can be seen from the figure, the contour of sound pressure distribution of the whole system was obviously improved after optimizing the muffler, especially at the inlet and center of vice mufflers. The contour of sound pressure at the outlet end of main mufflers was also improved to some extent. Sound pressure at the center of main mufflers was increased to a certain degree. This paper aimed to optimize the average SPL of the muffler instead of taking SPL of all frequency points as the objective, which certainly resulted in an increase of SPL at several frequency points.
Table 1Comparison of parameters before and after optimization
Parameters | Original value | Optimized value |
Inlet diameter t1 (mm) | 54 | 50 mm |
Outlet diameter t2 (mm) | 54 | 48 mm |
Length of the perforation section t3 (mm) | 110 | 115 mm |
Hole diameter d (mm) | 3.5 | 3.2 mm |
Perforation rate r | 20 % | 23 % |
Total mass m(kg) | 5.2 | 4.8 |
Mean SPL ¯SPL (dB) | 80.3 | 78 |
Fig. 16Comparison of contour for muffler system before and after optimization
a) Un-optimized muffler system
b) Optimized muffler system
7. Conclusions
1) Exhaust muffler could meet the requirements of exhaust noises. The large noise of tail pipe was mainly caused by air flow regeneration noises. The vice muffler was not the major component which generated airflow noises.
2) The largest pressure of the whole muffler system was at the outlet end of main mufflers and the largest flow velocity was in the connection pipe of main mufflers and vice mufflers. The muffler mainly reduced the noise through the transformation of airflow into heat energy in a closed space.
3) The computational model of transmission loss of the muffler was established to conduct on comparing it with the experiment. Results showed that the experimental and computational value of transmission loss of the muffler had a good consistent in both change trend and numerical value, and the computational model was reliable.
4) It was necessary to use GA-BP neural network algorithm to optimize the acoustic performance of the muffler. The noise of tail pipe was effectively reduced through optimizing the inner structure of the muffler.
References
-
Sun H. O., Cao S. D., Zhang W. P. Resistance characteristics of marine exhaust muffler. Journal of Harbin Engineering University, Vol. 23, Issue 6, 2005, p. 27-30.
-
Munjal M. L. Acoustics of Ducts and Mufflers. Wiley-Interscience, New York, 1987.
-
Wang Y. Q., Lu S. L. Application of ANSYS software in analyzing reactive muffler. Journal of Jiangsu University (Natural Science Edition), Vol. 24, Issue 3, 2003, p. 53-56.
-
Ge Y. S., Zhang H. B., Song Y. R. An analysis on 3D acoustic performance of automotive exhaust muffler. Automotive Engineering, Vol. 28, Issue 1, 2006, p. 51-55.
-
Selamet A., Xu M. B., Lee I. J. Analytical approach for sound attenuation in perforated dissipative silencers with inlet/outlet extension. Journal of Acoustical Society of America, Vol. 117, Issue 4, 2005, p. 2078-2089.
-
Meng X., Lu S. L., Liu H. G. Numerical analysis of resonant frequency of resonant muffler. Journal of Chongqing Jiaotong University (Natural Science), Vol. 31, Issue 5, 2012, p. 1081-1085.
-
Luo H., Deng H. T., Dong H. L. Numerical analysis of muffler characteristic for resonator and perforated clapboard in muffler. Machinery Design and Manufacture, 2008, p. 124-126.
-
Ji Z. L. Acoustic attenuation performance calculation and analysis of straight-through perforated tube silencers. Journal of Harbin Engineering University, Vol. 26, Issue 3, 2005, p. 302-306.
-
Meng X. H., Jin T. Numerical analysis of acoustic characteristic of muffler with complicated structure and structural optimization. Journal of Vibration Engineering, Vol. 20, Issue 1, 2007, p. 97-100.
-
Lee J. W., Kim Y. Y. Topology optimization of muffler internal partitions for improving acoustical attenuation performance. International Journal for Numerical Methods in Engineering, Vol. 80, Issue 4, 2009, p. 455-477.
-
Xu L., Liu Z. S., Bi R. Numerical analysis on acoustic and resistance performance of cross-flow perforated tube silencers. Journal of Yanshan University, Vol. 34, Issue 4, 2010, p. 301-306.
-
Denia F. D., Selamet A., Fuenmayor F. J. Acoustic attenuation performance of perforated dissipative mufflers with empty inlet/outlet extensions. Journal of Sound and Vibration, Vol. 302, 2007, p. 1000-1017.
-
Delany M. E., Bazley E. N. Acoustical properties of fibrous absorbent materials. Applied Acoustics, Vol. 3, 1970, p. 105-116.
-
Utsuno H., Tanaka T. Transfer function method for measuring characteristic impendence and propagation constant of porous materials. Journal of the Acoustical Society of America, Vol. 86, 1989, p. 637-643.
-
Wei W., Yang X. L., Shen P. Y. Holes detection in anisotropic sensornets: Topological methods. International Journal of Distributed Sensor Networks, Vol. 21, Issue 9, 2012, p. 3216-3229.
-
Ji Z. L. Acoustic attenuation performance prediction and analysis of perforated tube dissipative silencers. Journal of Vibration Engineering, Vol. 18, Issue 4, 2005, p. 453-457.
-
Kang Z. X., Ji Z. L. The acoustic thickness correction of perforated plate. ACTA Acoustic, Vol. 33, Issue 4, 2008, p. 327-333.
-
Kirby R., Cummings A. The impedance of perforated plates subjected to grazing gas flow and backed by porous media. Journal of Sound and Vibration, Vol. 217, Issue 4, 1998, p. 619-636.
-
Lin Q. Z., Zhu Q. L., Huang P. Z., Chen J. Y., Ming Z., Yu J. P. A novel hybrid multi-objective immune algorithm with adaptive differential evolution. Computers and Operations Research, Vol. 65, 2015, p. 95-111.
-
Zhu Z., Xiao J., Li J. Q., et al. Global path planning of wheeled robots using multi-objective memetic algorithms. Integrated Computer-Aided Engineering, Vol. 22, Issue 4, 2015, p. 387-404.
-
Chen J., Lin Q., Shen L. L. An immune-inspired evolution strategy for constrained optimization problems. International Journal on Artificial Intelligence Tools, Vol. 20, Issue 3, 2011, p. 549-561.
-
Lin Q. Z., Chen J. Y. A novel micro-population immune multiobjective optimization algorithm. Computers and Operations Research, Vol. 40, Issue 6, 2013, p. 1590-1601.
-
Wei W., Xu Q., Wang L. GI/Geom/1 queue based on communication model for mesh networks. International Journal of Communication Systems, Vol. 27, Issue 11, 2014, p. 3013-3029.
-
Du Z. H., Zhu Y. Y., Liu W. X. Combining quantum-behaved PSO and K2 algorithm for enhance gene network construction. Current Bioinformatics, Vol. 8, 2013.
-
Yan Q., Yu F. R., Gong Q., Li J. Software-defined networking (SDN) and distributed denial of service (DDoS) attacks in cloud computing environments: a survey, some research issues, and challenges. IEEE Communications Survey and Tutorials, Vol. 18, Issue 1, 2016, p. 602-622.
-
Li J. Q., He S. Q., And Ming Z. An intelligent wireless sensor networks system with multiple servers communication. International Journal of Distributed Sensor Networks, Vol. 7, 2015, p. 1-9.
-
Wong K. W., Lin Q. Z., Chen J. Y. Error detection in arithmetic coding with artificial markers. Computers and Mathematics with Applications, Vol. 62, Issue 1, 2011, p. 359-366.
-
Wei W., Fan X., Song H. Imperfect information dynamic stackelberg game based resource allocation using hidden Markov for cloud computing. IEEE Transactions on Services Computing, DOI 10.1109/TSC.2016.2528246, 2016.
Cited by
About this article
The project was supported by the National Natural Science Foundation of China (No. 51275019).
Xiaolin Xie has written this paper, Feng Gao proposed the idea, the experiment was conducted by Xiaoyuan Huang, the translation of this paper was completed by Chuan Huang, and Jie Li was as a leader and submitted this paper to Journals.

