Abstract
With the continuous increase of vehicular traffic, the safety caused by bridge crack damage is becoming increasingly prominent. Bridge crack analysis and measurement are of great significance for promoting road traffic safety. However, existing bridge crack image segmentation methods have shortcomings in processing image detail features, resulting in the inability to better measure the actual size of bridge cracks. Therefore, to further optimize the calculation method, a bridge crack image segmentation method based on improved SOLOv2 is designed to achieve more accurate bridge image segmentation. Based on the image segmentation results and combined with the skeleton data extraction method, a bridge crack calculation method is designed. From the results, the segmentation accuracy for crack images was 92.05 % and 93.57 %, respectively. The average mIoU of AM-SOLOv2 method was 0.75, significantly lower than commonly used crack image segmentation methods. In addition, the mIoU value variation amplitude of the AM-SOLOv2 method was relatively smaller. The crack length and width errors were within 0.05 mm and 0.06 mm, significantly lower than the comparison method. It indicates that this method can achieve more accurate crack image segmentation and calculation. This is beneficial for a deeper understanding of the performance degradation and crack damage evolution of bridge structures, thereby improving bridge design and construction technology.
1. Introduction
As an important transportation infrastructure, bridge safety is closely linked to the safety of people's lives and property [1]. In recent years, the traffic load has been continuously increasing. Meanwhile, due to the combined effects of various natural and human factors, many bridges have suffered various damages, with bridge cracks being the most significant, seriously affecting traffic safety. Cracks, as one of the important indicators for evaluating road surface quality, directly affect driving safety and the service life of bridges [2-3]. Therefore, the research on bridge damage not only helps to identify potential problems, but also ensures people’s travel safety. Meanwhile, it can provide a basis for empirical research in disciplines such as structural engineering and civil engineering, and promote the development of relevant theories [4-5]. Due to the small size and complex distribution of cracks, there are many difficulties in actual measurement. With the continuous development of bridge engineering technology, the crack size research has received widespread attention. Various advanced measurement technologies, such as image processing based crack recognition and measurement technology, laser scanning technology, 3D reconstruction technology, etc., are used for bridge crack size measurement, providing important data support for bridge safety assessment and maintenance. The Segmenting Objects by Locations (SOLOv2) model is mainly applied in instance segmentation, which has been widely applied in fields such as robot vision, augmented reality, and virtual reality. It is a target segmentation technique based on instance segmentation, which can accurately segment targets in the image in real time. Therefore, the study adopts SOLOv2 as the basic model for crack segmentation. Based on its advantages such as precise segmentation ability, efficient processing speed, model adaptability, and continuous optimization, SOLOv2 has become an ideal choice for crack segmentation tasks. However, the detailed analysis for bridge crack images is insufficient. The information extraction ability in crack images is weak, which leads to relatively high calculation errors in cracks. Image segmentation technology is widely used in various types of image information processing, which has good processing capabilities for image segmentation [6]. Therefore, the SOLOv2 is used to segment bridge crack images. Then the Attention Mechanism (AM) is introduced to optimize the SOLOv2 method. It is expected to further optimize bridge crack measurement through this method, providing support for subsequent bridge repair and improvement in bridge construction. The innovative of the research is as follows. Based on the SOLOv2 network structure, this study innovatively introduces AM to optimize the feature extraction and bridge crack calculation, thereby improving the feature extraction effect and calculation accuracy of bridge cracks.
This study consists of four parts. The first part summarizes existing research on image segmentation and bridge damage. The second part constructs a bridge crack image segmentation and crack calculation method based on improved SOLOv2. The third part conducts experimental analysis on the proposed method to verify the effectiveness in practical applications. The fourth part summarizes the research content and points out future research directions.
2. Related works
Image segmentation can further optimize image detail analysis and extraction, reducing the impact of various complex factors on image information. Many scholars have analyzed and applied it from multiple perspectives. For example, to better measure the phenotype of mature soybeans, Li S. et al. performed instance segmentation on soybean images to locate and measure the length and width of target objects. The results showed that this method could effectively measure the relevant data characteristics of soybean crops, reduce labor intensity, and improve efficiency [7]. Zheng C. et al. designed a visual algorithm based on RGB images for fruit instance segmentation and picking point localization. The algorithm successfully completed the expected task, which had strong robustness in various lighting and complex backgrounds [8]. Jiang F. et al. proposed a three-stage automatic segmentation framework for sandstone images. Firstly, the input sandstone image was pre-segmented into mineral super-pixels. Then instance independent features were extracted. Finally, a new weighted fuzzy clustering algorithm was developed to cluster mineral super-pixels into different categories to generate complete minerals. The experimental results demonstrated the effectiveness of this method, which was significantly better than existing segmentation methods [9]. Bai H. et al. applied an instance segmentation network based on You Only Look Once version 3 (YOLOv3) and Full Convolutional Network (FCN) to segment all movable nanowires in AFM images. Compared with existing methods, it was less affected by image complexity, proving that the algorithm had good robustness [10]. On the basis of Mask R-CNN instance segmentation, Meng R. et al. used instance segmentation masks to hide private information in each object region, achieving background free information hiding for foreground objects. This method improved the efficiency of receiver information extraction, which had higher security and robustness and further optimized privacy protection [11].
The diagnosis research of bridge damage has a direct impact on the safe operation of bridges. In recent years, intelligent structural damage diagnosis algorithms based on machine learning have achieved great success. Xiao H. et al. proposed a bridge diagnosis algorithm based on deep learning. It automatically extracted advanced features from the original signal to meet any damage diagnosis target without any time-consuming denoising preprocessing. The results indicated that this method was an ideal and effective method for diagnosing damage to bridge structures [12]. Fu D. Z. et al. used an impact overload simulation device and structural finite element software ANSYS/AUTODYN to study the impact indicators of bridge damage. It could effectively analyze the influencing factors of bridge damage [13]. Zhang P. et al. proposed a degradation and mechanism assessment method based on self centered for bridge pier systems, and innovatively defined two damage modes: namely elastic damage and brittle damage. A new damage index for SC bridge pier system was proposed, which could reasonably reflect key mechanical properties. It could accurately evaluate the damage state [14]. Liu J. et al. introduced a hierarchical semantic segmentation framework based on computer vision technology to monitor the health status of bridges. This framework imposed hierarchical semantic relationships between component categories and damage types. The results showed that this method was significantly superior to existing baseline methods [15]. Xiao L. et al. developed a crack mesh detection method based on Convolutional Neural Network (CNN). Each grid was fed into a CNN for detection. This method could avoid fracture phenomena in crack identification, and obtain crack information through pixel scanning and calculation [16].
In summary, image segmentation technology has been widely applied, which has achieved certain research results in various fields such as industrial and agricultural production. Meanwhile, many researchers have conducted relatively in-depth analysis on the impact and evaluation of bridge damage from various perspectives. However, there are relatively few researches on analyzing the actual size of bridge cracks using bridge damage feature images. Meanwhile, due to the constantly changing working environment (load, temperature, and noise) in practical bridge applications, the performance of structural damage analysis methods is seriously affected. Therefore, based on the instance segmentation method, the image of bridge cracks is segmented. Then it is used to calculate the size of bridge cracks, hoping to provide useful guidance for the management and maintenance of bridge safety.
2.1. Bridge crack segmentation and measurement method based on SOLOv2
General image segmentation includes semantic segmentation, instance segmentation and panoramic segmentation. Instance segmentation models generally include image input, segmentation processing, and result output. To better achieve image segmentation, the SOLOv2 network is used to segment bridge crack images. Then, the AM is introduced to improve the results of SOLOv2 network, to further optimize the performance of bridge image segmentation. Finally, the actual size is calculated based on the segmentation results of SOLOv2 images.
2.2. Construction of segmentation model based on improved SOLOv2 algorithm
The role of bridges in transportation infrastructure construction is becoming increasingly prominent, which also poses higher requirements for bridge inspection and maintenance. Image case segmentation is helpful to better analyze the specific changes of crack damage. Case segmentation includes object detection and semantic segmentation, which can segment images at pixel. The SOLOv2 instance segmentation method is used to analyze bridge crack damage. SOLO is a classic instance segmentation network structure that directly implements instance segmentation. The core idea is to re-segment the entity segmentation task into two simultaneous sub-tasks, namely classification estimation and instance mask generation. Masking is a process that adopts a selected image or object to mask the entire or partial image being processed to control the area or process of image processing. This occlusion mechanism allows researchers to accurately focus on and process areas of interest, ignoring irrelevant parts. In crack recognition, masks can effectively extract the area where the crack is located, while shielding the background noise of the crack image, thereby extracting key information such as the specific shape, length, and width of the crack. Although masks play an important role in crack identification, they also have some limitations. The design of masks depends on specific crack characteristics and scenarios. If the image quality to be processed is poor, such as noise, blur, or uneven lighting, the mask may not be able to effectively extract crack areas or shield background noise. In addition, for cracks with complex branches, intersections, or fractures, a single mask may be difficult to accurately describe their morphology and characteristics. The above shortcomings will affect the accuracy of crack identification. The integration of masks in deep learning is usually achieved by designing specific network structures and algorithms. AM is an important technique in deep learning, which allows the model to focus on important parts when processing input. By combining masks with AM, the model can consider the mask information when generating attention weights. In this way, the model can more accurately locate key areas and perform subsequent processing and analysis. The basic network structure is shown in Fig. 1.
Fig. 1Schematic diagram of SOLO structure
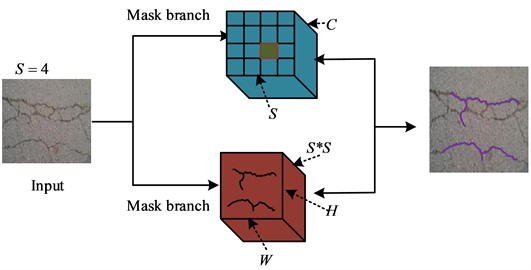
In Fig. 1, the SOLO network utilizes a fully convolutional network to divide the image into S×S grids and generate S2 center positions. Among them, C represents the number of categories. H and W represent the height and width of the feature map, respectively. The center coordinates of the input image are assigned to one of the cells. Then a feature map of H×S2×W is generated. When cracks appear on the surface of a bridge due to external forces, the concrete inside will generate corresponding stress, resulting in cracks. Therefore, the internal structure of concrete will undergo stress changes. The corresponding network size is S=4. Each position of a semantic type corresponds to a specific channel in the entity mask branch, which is used to generate a mask for the target object. After completing this operation, masks related to the semantic type and category form a corresponding mapping relationship. The loss function of SOLO is displayed in Eq. (1):
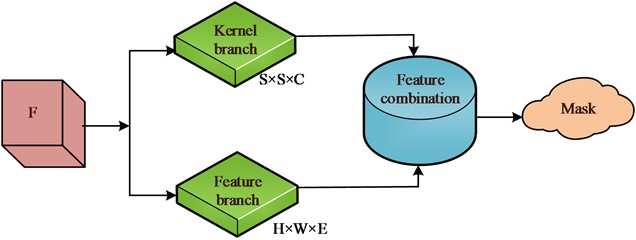
where, Lc refers to the traditional image focus loss, which is a loss function based on semantic type classification. Lmask is the loss function in the mask estimation process. SOLOv2 is developed based on the SOLO network, which incorporates dynamic mechanisms to optimize the network structure. The core idea is to transform the input image segmentation problem into a position classification problem, and assign a category to each pixel in the bridge input image based on the position and size of the instance to achieve the segmentation goal. The original mask branch is decomposed into two parallel branches, namely the mask kernel branch and the mask feature branch. The former is used for convolutional kernel learning, while the latter is used for feature learning. Finally, the output results of the two branches together obtain the final mask prediction [17]. The mask branch structure is shown in Fig. 2. Among them, D represents the number of parameters, and E represents the dimension of mask features.
In Fig. 2, each grid calculates the probability of the predicted category based on the output of the C-dimensional number of categories, providing a separate instance for each grid unit. The mask branch and classification branch perform parallel computation. Therefore, each grid unit needs to generate a corresponding instance mask. The resulting instance mask library is the number of networks. The SOLOv2 network dynamically optimizes mask branches to improve its performance. To further improve the accuracy of SOLOv2 in bridge crack segmentation, the AM is introduced to improve SOLOv2. The AM can effectively process data resources by filtering invalid information, thereby optimizing the quality and efficiency of the system in information processing. Specifically, the spatial AM is combined with the channel AM to optimize SOLOv2. Splitting and concatenating modules are used to construct multi-scale features of instance objects. Then spatial attention and channel attention are used to extract different scale features [18]. Among them, the former is used to calculate the spatial relationship between two pixels. The latter is applied to weight the feature information of each feature channel to extract features with different scales. In constructing multi-scale feature information, the input image is X, which is divided into multiple parts, represented as X={X|X1,X2,...,XS}. For each specific part, feature extraction is performed. The extracted multi-scale features are concatenated through concatenation operation, as shown in Eq. (2):
where, F represents the feature map. G refers to the size of the convolutional group. K refers to the size of the convolution kernel. Fi represents the sub feature map of F. Each segmentation part divides all common channels equally. The spatial information of each channel feature can be extracted in parallel on multiple feature scales. Each segmentation part uses multi-scale convolution kernels to generate spatial resolution and depth of different scales. The size of the convolution kernels is determined, as shown in Eq. (3):
Fig. 2Schematic diagram of mask branch structure
According to existing research, the group size is set to 1. The structure of the obtained splicing part is shown in Fig. 3.
Fig. 3Schematic diagram of feature stitching
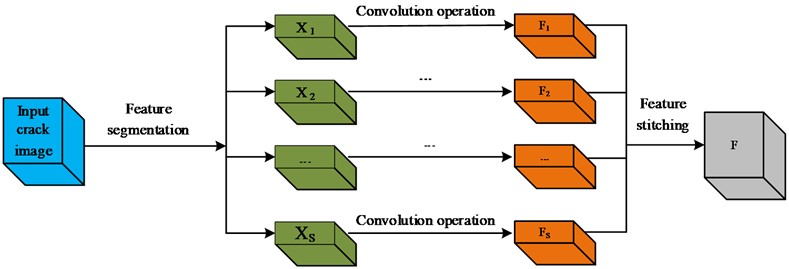
In Fig. 3, the input crack image is segmented into multiple different sub blocks, and each sub block is convolved to obtain the corresponding feature map, as shown in F1...Fs in the figure. Parallel extraction of spatial information for each channel feature on multiple feature scales yields the concatenation result. On the basis of the above process, attention weights are extracted for features at different scales. The weight calculation is shown in Eq. (4):
where, Wi represents attention weight. SE represents module calculation. The obtained attention weights are further concatenated to better ensure the attention information fusion, as shown in Eq. (5):
where, ⊕ represents the feature concatenation operation. The concatenated weights are normalized, as shown in Eq. (6):
The Softmax function is applied to calculate the normalized weight vector, which contains spatial position information and attention weights in channel attention. From this, the relationship between attention vectors and feature scales is obtained. Based on multi-scale attention vectors and corresponding scale features, the channel attention weight features are obtained, as shown in Eq. (7):
where, * represents the multiplication operation of the channel. Fi represents the sub features of F. The overall feature expression obtained based on the above operation is shown in Eq. (8):
After extracting features at different scales, the channel attention map and spatial attention map can be calculated. The channel attention branch is used to generate the optimal output feature. The obtained channel attention map is shown in Eq. (9):
where, cji represents the impact of the ith channel on the jth attention channel. The spatial attention branch is mainly used to generate spatial attention by utilizing the spatial relationships between different features. The spatial attention map is shown in Eq. (10):
where, F'i and Fij represent two new feature maps generated by different modified methods. N refers to the pixels in the image. sij refers to the impact of the i-th position on the j-th position. Based on the obtained channel attention map and spatial attention map, the channel dimension information is interacted and integrated with other network modules. The final multi-scale feature map output by the module is shown in Fig. 4.
Fig. 4Double attention feature extraction
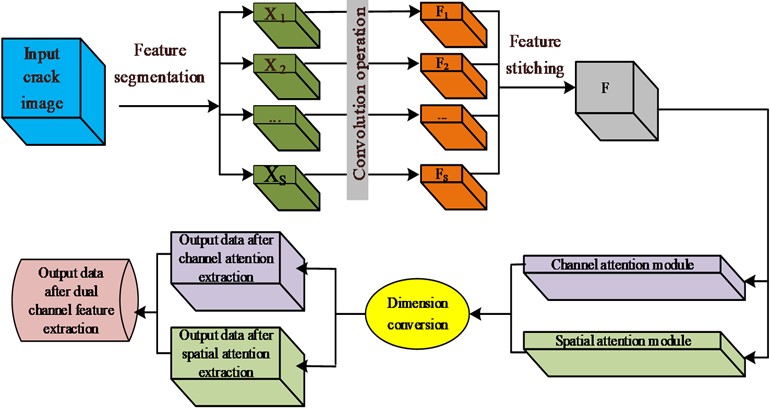
The double AM is an effective means to improve model performance in the field of deep learning by focusing on the input part of the module. It can better understand and use the feature information of spatial and channel dimensions, suppress irrelevant features, and identify targets. Meanwhile, the dual AM helps the model better cope with background interference, occlusion, and other issues, thereby improving the detection accuracy. Therefore, the dual attention method is beneficial. Therefore, the improved SOLOv2 image segmentation model based on AM can take into account more details and multi-feature crack information when segmenting bridge crack images.
2.3. Bridge crack measurement based on improved SOLOv2
Common bridge damages include cracks, potholes, and collapses. Cracks are one of the most common types of damage to bridge pavement, including longitudinal cracks, transverse cracks, and diagonal cracks. Most of them are due to the shrinkage or deformation of the pavement caused by temperature changes, resulting in cracks. Furthermore, it may be due to quality issues during construction and uneven quality of building materials, which seriously affect driving safety. Based on the improved SOLOv2 image instance segmentation model generated in the above research, pixel level crack mask images can be obtained. Then, the pixel level mask image of the crack is combined with the imaging pixel level resolution to calculate the actual size of the bridge crack [19]. Mask image mainly plays the role of occlusion and control in image processing. The selected image, shape, or object occludes the processed image (all or part) to control the image processing area. Skeleton images connect the edges of an image to form a refined line structure that represents the main shape features in the image. Therefore, there is a significant difference between the two. The skeleton extraction method is applied to process the bridge crack mask image obtained based on the improved SOLOv2 model. A binary image of the crack is obtained. There are significant differences between the bridge crack image and the background elements after the crack morphology segmentation. The pixels included in the crack feature value are calculated by the image pixel coordinate. Then the crack feature value is obtained by solving the size between the calibrated individual pixel points [20]. The skeleton extraction method utilizes the geometric features of an image to extract a connected region into a pixel size, providing visual results for cracks with a single pixel width. The segmented crack image is a discrete pixel matrix of p×q. The pixel position corresponding to the crack in the image is (x,y). Based on this, the central skeleton of the crack image is obtained, as shown in Eq. (11):
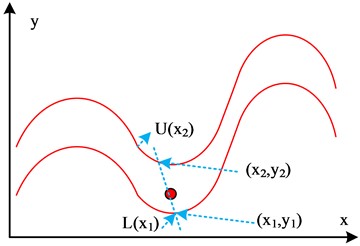
where, L(x1) represents the pixel coordinate point in the lower boundary of a crack where the grayscale value of the image changes from 0 to 255. U(x2) represents the pixel coordinate point in the upper boundary of a crack where the grayscale value of the image changes from 255 to 0. C(x) represents the center skeleton of the crack, and its position can be represented as L(x1)+U(x2). Based on the results of image skeletonization, the actual size of cracks is calculated. The relationship between actual cracks and pixel values is obtained using the proportion method. The conversion between the two is shown in Eq. (12):
where, ν refers to the actual parameter of the crack, (mm). k represents the scaling ratio of cracks in the bridge crack image, (mm/pixel). w represents the width of crack pixels, (pixel). The calibration method is used to calibrate the k value. The basic principle is to calculate the ratio between the actual size of the object and the size of the imaging pixel, as shown in Eq. (13):
where, L refers to the actual length of the measured object, (mm). l represents the pixel value marked in the image, (pixel). After obtaining the scaling ratio, the length and width can be calculated. In the skeleton image of bridge cracks, pixels with a grayscale value changing from 0 to 255 are the lower boundary pixels of the crack, represented by U(x) and L(x). In this skeleton image, the number of pixels is n. The intersection point between the normal and the upper boundary of the crack is (xi,yi), and the intersection point between the normal and the lower boundary is (xi+1,yi+1). The length of the crack between these two points is shown in Eq. (14):
where, LD represents the distance between two adjacent pixels. L represents the crack length. Generally speaking, the average width of cracks is one of the main indicators for measuring the health status of bridge facades. The average width of cracks is the ratio of the total crack pixels to the crack skeleton length, as shown in Eq. (15):
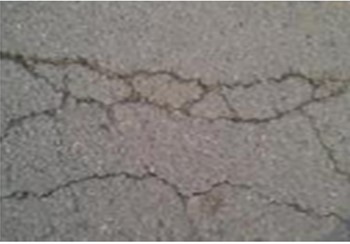
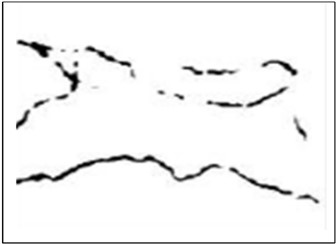
where, W refers to the average width of the crack. L refers to the crack length. N represents the total number of pixels in the crack area. The basic structure of the image crack is shown in Fig. 5. The two red lines in Fig. 5(c) represent the identified crack contours. When calculating, the boundary points of the central axis in the crack are determined, excess boundary points are removed, and then their width is refined to only one pixel. Then, the determined points are sequentially traversed to determine whether the pixel is a black pixel. The above is repeated until no pixels are marked for deletion. The refined skeleton image can be obtained, represented by the contour shown in Fig. 5(c).
Fig. 5(a) shows the crack image obtained by SOLOv2 segmentation. Fig. 5(b) is a schematic diagram of the crack image after skeleton extraction. Fig. 5(c) is a basic schematic diagram of crack calculation. This process clearly presents the bridge crack calculation.
Fig. 5Basic structure of image cracks
a) Crack image
b) Skeleton image
c) Crack calculation
3. Performance analysis of crack segmentation method based on SOLOv2
To verify the performance of the proposed SOLOv2 method based on double self AM, corresponding experiments are designed to analyze the method. Then it is compared with commonly used methods to verify its application effects in bridge crack image segmentation. Then, the designed bridge crack calculation method is used to calculate the size of sample cracks, further optimizing the crack damage calculation method.
3.1. Performance analysis of bridge image segmentation based on SOLOv2
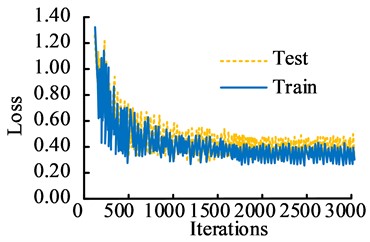
The experimental analysis is completed in the Windows 7 64 bit operating system. VS2015 is the development environment, developed in C++language. The CPU processor is Inter i3-3220, the running memory is 16GB, and the GPUiGeForce RTX2080Ti. The hardware experimental platform includes a lighting shooting platform experimental bench, a Basler acA2440-75umLET industrial area array camera, a flashing LED light array, and an industrial computer. The dataset used in the study includes the public crack dataset CRACK500 and CFD, as well as self captured bridge crack images. A total of 5246 bridge crack images were collected in the study. Among them, the CRACK500 dataset had a total of 3368 images, which have inconsistent sizes, including horizontal cracks, vertical cracks, and mesh cracks. The CFD contained a total of 118 images, all of which were 480X320 in size, including both horizontal and vertical cracks. After manual selection, removal, and other processing, 5000 images were obtained and divided into a training set and a validation set at a ratio of 7:3. At the same time, this dataset contained 2000 images with noisy environments. A total of 1760 crack images were collected independently, with varying sizes and three types of cracks. The learning rate had direct impacts on the convergence performance. Therefore, the study first verified the model performance with different learning rate. The TensorBoard in the visualized TensorFlow model was used to record the loss values under different learning rate conditions, as displayed in Fig. 6. In Fig. 6, in the testing set, when the current learning rates were 0.001, 0.002, and 0.004, the convergence values were 0.52, 0.31, and 0.15, respectively. The loss value of the research method converged first. The convergence effect was significantly better than the other two learning conditions. It demonstrated that the learning rate of the research method was 0.002.
Fig. 6Changes in loss values under different learning rates
a) The learning rate of 0.001
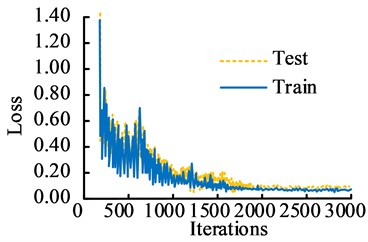
b) The learning rate of 0.002
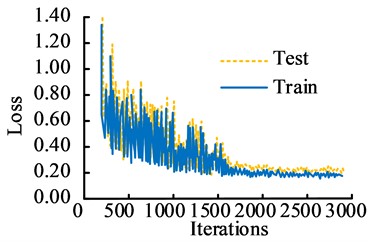
c) The learning rate of 0.004
The commonly used image segmentation methods include edge detection algorithm, YOLO-based image segmentation method, Region-based CNN (R-CNN), and FCN image segmentation methods. Then, the segmentation accuracy of this method in the training and testing sets was analyzed. Fig. 7 displays the results. In Fig. 7(a), the highest segmentation accuracy of YOLO, R-CNN, FCN, and AM-SOLOv2 were 80.35 %, 83.74 %, 87.21 %, and 92.05 %, respectively. In Fig. 7(b), the highest segmentation accuracy of YOLO, R-CNN, FCN, and AM-SOLOv2 were 84.24 %, 86.76 %, 89.31 %, and 93.57 %, respectively. This indicated that the proposed method has higher accuracy, which has better performance in the training and testing sets.
Fig. 7Accuracy comparison of different methods
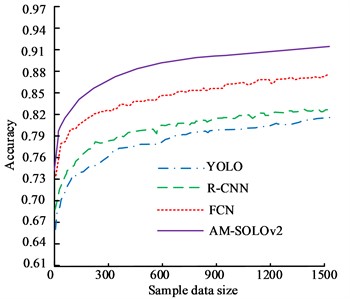
a) The training set
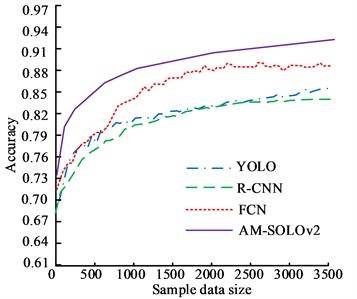
b) The testing set
To compare the performance of the proposed model more vividly, the confusion matrix of YOLO, R-CNN, FCN, and AM-SOLOv2 in the dataset were plotted using three different crack images. The test results are shown in Fig. 8. From Fig. 8, among the four recognition models, the YOLO model had the lowest recognition accuracy, with 2 recognition results above 80 points. Next was the R-CNN model. The three category recognition results of the FCN model were all above 80 points, and the recognition results of AM-SOLOv2 were above 90 points. Therefore, the AM-SOLOv2 still performed the best, which can completely and accurately identify the corresponding crack categories, with a recognition rate generally above 90 points. In summary, the test results once again validate the efficiency and feasibility of the proposed model.
Fig. 8Test results of confusion matrix for three recognition models
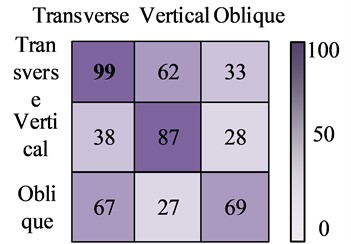
a) The YOLO
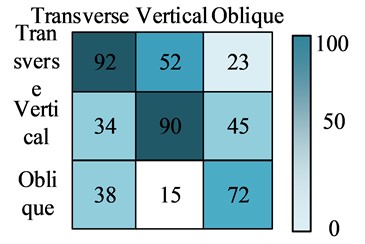
b) The R-CNN
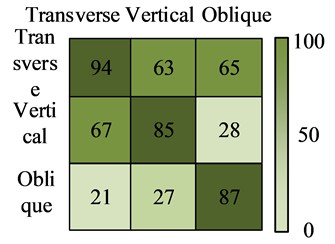
c) The FCN
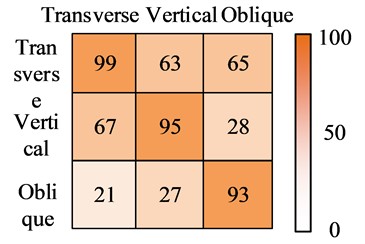
d) The AM-SOLOv2
Fig. 9Sensitivity and specificity analysis
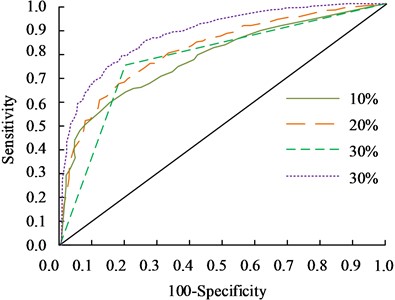
The specificity and sensitivity of the research method were analyzed. Te results are shown in Fig. 9. In Fig. 9, the sensitivity and specificity values of the YOLO were 0.769 and 0.792, and the sensitivity and specificity values the R-CNN were 0.815 and 0.834. For the FCN, the sensitivity and specificity values were 0.836 and 0.854. AM-SOLOv2's sensitivity and specificity values were 0.886 and 0.964, respectively. From this perspective, the research method has better performance and significantly higher recognition accuracy than its comparison methods.
The performance of different methods in bridge crack image segmentation was compared. The Intersection over Union (mIoU) of cracks obtained by different segmentation methods is shown in the Fig. 10. In Fig. 10, there was a significant difference in mIoU values among different methods. The average mIoU values for YOLO, R-CNN, FCN, and AM-SOLOv2 methods were 0.60, 0.59, 0.6.7, and 0.75. In addition, the mIoU value variation amplitude of the AM-SOLOv2 was relatively small. Overall, the mIoU value performance of the AM-SOLOv2 is significantly better than other comparison methods, which has more accurate image segmentation accuracy.
Fig. 10Comparison of mIoU for different methods
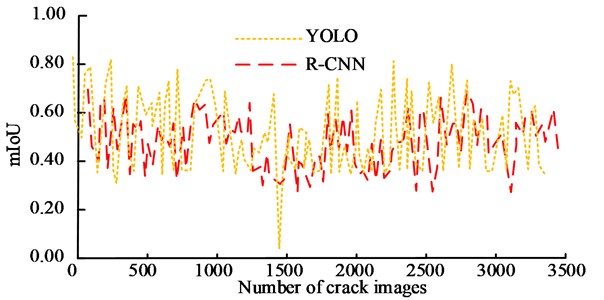
a) The YOLO and R-CNN
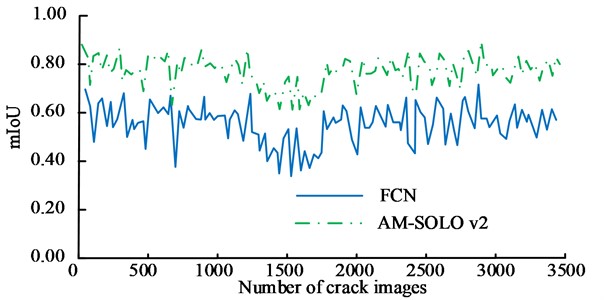
b) FCN and AM-SOLOv2
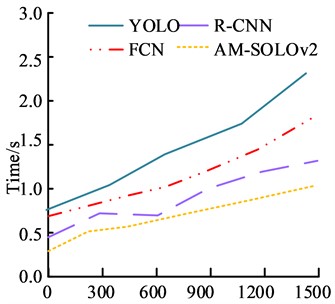
The time consumption of different methods during operation is shown in Fig. 11. In Fig. 11(a), the YOLO and R-CNN were 0.6 s and 0.8 s, respectively. In Fig. 11(b), the FCN and AM-SOLOv2 were 7.1 s and 8.3 s, respectively. The method proposed in the study has significantly lower time consumption during operation compared with its comparison methods, resulting in higher operational efficiency.
A noise free environment is a relatively ideal condition. Most of the time, the image acquisition process of bridge cracks contains various types of noise. Therefore, to further validate the performance of this method, the data images in this dataset were divided into noisy images and non noisy images for analysis. The segmentation performance of the two types of images was compared. The performance comparison of existing bridge crack image segmentation methods is displayed in Table 1. According to Table 1, the proposed method exhibited better Average Precision (AP), Mean Average Precision (MAP), and mIoU values in both noisy and non-noisy environments. When the image contained a noisy environment, the PA, MPA, and mIoU in the testing set were 0.801, 0.794, and 0.769, respectively. In a non-noisy environment, the PA, MPA, and mIoU in the test set were 0.859, 0.914, and 0.864. It can effectively overcome the interference of weak noise environment on image segmentation and achieve better image segmentation.
Fig. 11Running time of different methods
a) The training set
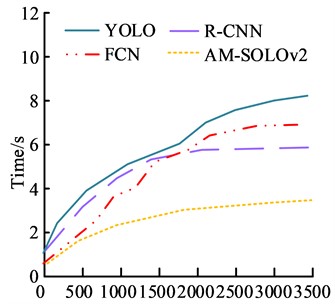
b) The testing set
Table 1Comparison of noisy and non-noisy datasets
Dataset | Segmentation method/evaluation indicators | Image without noise | Images with noise | ||||
PA | MPA | mIoU | PA | MPA | mIoU | ||
Training set | YOLO | 0.684 | 0.699 | 0.628 | 0.655 | 0.697 | 0.541 |
R-CNN | 0.707 | 0.713 | 0.685 | 0.657 | 0.704 | 0.597 | |
FCN | 0.739 | 0.778 | 0.707 | 0.758 | 0.764 | 0.721 | |
AM-SOLOv2 | 0.805 | 0.837 | 0.796 | 0.793 | 0.702 | 0.684 | |
Testing set | YOLO | 0.647 | 0.691 | 0.636 | 0.529 | 0.553 | 0.614 |
R-CNN | 0.659 | 0.697 | 0.669 | 0.587 | 0.642 | 0.618 | |
FCN | 0.819 | 0.821 | 0.762 | 0.659 | 0.756 | 0.741 | |
AM-SOLOv2 | 0.859 | 0.914 | 0.864 | 0.801 | 0.794 | 0.769 | |
The uncertainty of the accuracy of each model is shown in Fig. 12.
Fig. 12The uncertainty in model accuracy and confidence differences
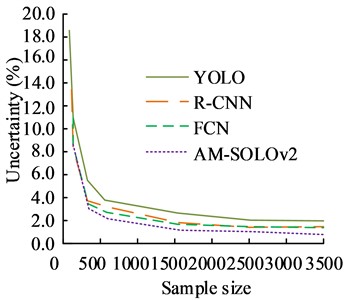
a) The uncertainty in model accuracy
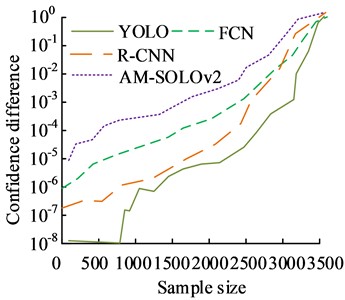
b) The confidence differences
From Fig. 12(a), the AM-SOLOv2 model had the lowest uncertainty of accuracy, which was basically stable at 1.5 %, while the uncertainties of YOLO, R-CNN, and FCN were stable at 3.6 %, 2.8 %, and 2.7 %, respectively. From this perspective, the uncertainty of the accuracy data obtained by the research design method is significantly lower than that of its comparison methods. The confidence differences of commonly used models are shown in Fig. 12(b). From Fig. 12(b), the AM-SOLOv2 model was more sensitive to data, and the data under this model reached the expected value earlier. Next were FCN, R-CNN, and YOLO, respectively. It indicates that the quality of the data obtained is better.
3.2. Performance analysis of bridge crack measurement based on improved SOLOv2 segmentation model
To verify the performance of the crack calculation method based on SOLOv2 image segmentation, it was used to calculate different types of bridge cracks. The Precision-Recall curve of the calculated results is displayed in Fig. 13. From Fig. 13, the PR values for longitudinal crack, transverse crack, and oblique crack were 0.40, 0.56, and 0.68, respectively. This result is better than the existing measurement results for different types of cracks.
Fig. 13Segmentation PR for different types of cracks
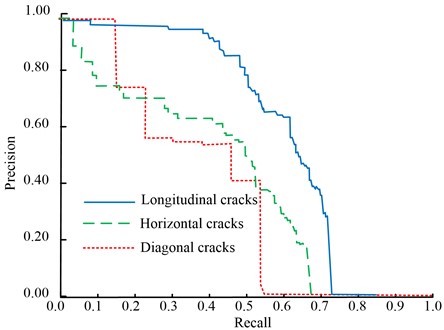
Table 2Crack errors under different calculation methods
Crack number | Width (mm) | Length (mm) | ||||||||
Actual value | The proposed method | Reference [16] | Actual value | The proposed method | Reference [16] | |||||
Calculation results | Error | Calculation results | Error | Calculation results | Error | Calculation results | Error | |||
1 | 1.25 | 1.29 | 0.04 | 1.20 | 0.05 | 85.23 | 85.27 | 0.04 | 85.15 | 0.08 |
2 | 2.01 | 2.00 | 0.01 | 2.10 | 0.09 | 131.47 | 131.50 | 0.03 | 131.42 | 0.05 |
3 | 1.67 | 1.64 | 0.03 | 1.69 | 0.03 | 54.66 | 54.61 | 0.05 | 54.59 | 0.07 |
4 | 0.98 | 1.03 | 0.05 | 1.08 | 0.10 | 267.33 | 267.29 | 0.04 | 267.42 | 0.09 |
5 | 1.65 | 1.068 | 0.03 | 1.57 | 0.08 | 108.29 | 108.31 | 0.02 | 108.40 | 0.09 |
6 | 1.99 | 1.97 | 0.02 | 1.94 | 0.05 | 157.36 | 157.40 | 0.06 | 157.25 | 0.11 |
7 | 2.36 | 2.341 | 0.05 | 2.43 | 0.07 | 168.02 | 168.06 | 0.04 | 168.14 | 0.12 |
8 | 2.09 | 2.0.7 | 0.02 | 2.15 | 0.06 | 64.74 | 64.71 | 0.03 | 64.69 | 0.05 |
9 | 1.43 | 1.40 | 0.03 | 1.51 | 0.08 | 294.06 | 294.03 | 0.03 | 294.16 | 0.10 |
10 | 1.87 | 1.91 | 0.04 | 1.93 | 0.06 | 185.73 | 185.78 | 0.05 | 185.68 | 0.05 |
11 | 2.76 | 2.78 | 0.02 | 2.73 | 0.03 | 201.55 | 201.52 | 0.03 | 201.47 | 0.08 |
12 | 2.34 | 2.39 | 0.05 | 2.27 | 0.07 | 134.89 | 134.87 | 0.02 | 134.83 | 0.06 |
13 | 1.96 | 1.93 | 0.03 | 2.05 | 0.09 | 79.63 | 79.61 | 0.02 | 79.58 | 0.05 |
14 | 1.54 | 1.56 | 0.02 | 1.49 | 0.05 | 157.46 | 157.42 | 0.04 | 157.41 | 0.05 |
15 | 1.22 | 1.26 | 0.04 | 1.18 | 0.04 | 194.33 | 194.29 | 0.04 | 194.39 | 0.06 |
A total of 15 crack images were randomly selected for experimental calculations. The proposed crack calculation method was compared with the crack calculation method used in reference [16]. The crack size error is shown in Table 2. In Table 2, the maximum error width was 0.05 mm, and the maximum error length was 0.06 mm. In the measurement results of the reference [16], the maximum error width was 0.09 mm and the maximum error length was 0.12 mm. According to the statistical results, the maximum error values of crack length and width calculated by the research method were 0.04 mm and 0.06 mm lower, respectively, indicating that the method more accurately measures the length and width of bridge cracks.
4. Discussion
This research designed a bridge crack image detection and calculation method based on SOLOv2. According to the analysis results, Hui T. et al. designed a corresponding detection method for crack image detection using Yolov4 tiny. However, experiments showed that the extraction ability of this method was weakened in noisy images [21]. By comparison, the average mIoU value of the method proposed in the study was 0.75, and the amplitude of mIoU value variation was relatively smaller. In the training and testing sets, the segmentation accuracy of AM-SOLOv2 was 92.05 % and 93.57 %, respectively. Especially in noisy images, the designed method in the testing set had the PA, MPA, and mIoU values of 0.801, 0.794, and 0.769, respectively. The method proposed in the study can effectively overcome the interference of weak noise environment on image segmentation and achieve better image segmentation. This is because the double AM used in the study can effectively suppress the impact of noise. In addition, compared with other methods, the designed algorithm has higher accuracy and efficiency in feature segmentation of bridge crack images. In terms of bridge crack calculation, the research method minimizes the error of crack calculation as much as possible. Compared with reference [16], the maximum error values of crack length and width calculated by the research method were 0.04 mm and 0.06 mm lower, respectively. It indicates that this method can more accurately measure the length and width of bridge cracks. The method proposed in the research is more accurate in processing crack image features before calculation, which can capture more effective detailed crack features to achieve more accurate crack size calculation.
5. Conclusions
To meet the current detection needs of bridge cracks, a bridge crack image segmentation model based on improved SOLOv2 was constructed. Based on the improved SOLOv2 crack image segmentation and skeleton data extraction method, a corresponding bridge crack calculation method was designed. From the experimental results, in the testing set and training set, the accuracy of this method was 92.05 % and 93.57 %, respectively. When the image contained a noisy environment, the PA, MPA, and mIoU of the research method were 0.801, 0.794, and 0.769, respectively. In a non-noisy environment, the PA, MPA, and mIoU of the research method were 0.859, 0.914, and 0.864. The maximum error width and length was 0.05 mm and 0.06 mm, which was 0.04 mm and 0.06 mm lower than the comparison method, respectively. Statistical indicator analysis showed that the data quality obtained by the research method was significantly higher than that of other comparison methods. In summary, the designed bridge crack image segmentation method can better achieve image feature segmentation, thereby obtaining more accurate bridge crack size, and providing effective data support for the management and maintenance of bridges in the later stage. However, there are still shortcomings in the research. Bridge cracks are complex and diverse, and there may be similar cracks in the same image. The proposed feature segmentation method lacks the ability to distinguish details in bridge crack images with high similarity. In future research, detailed feature differentiation can be applied to cracks with higher similarity to further optimize the accuracy of crack calculation.
References
-
D. Zhang, C. Wang, and Q. Fu, “Near-Shore ship segmentation based on I-Polar mask in remote sensing,” International Journal of Remote Sensing, Vol. 43, No. 9, pp. 3470–3489, May 2022, https://doi.org/10.1080/01431161.2022.2095878
-
M. J. Wenning, T. Piotrowski, J. Janzen, B. Nießing, and R. H. Schmitt, “Towards monitoring of a cricket production using instance segmentation,” Journal of Insects as Food and Feed, Vol. 8, No. 7, pp. 763–772, Jul. 2022, https://doi.org/10.3920/jiff2021.0165
-
L. Liu, J. Mi, Y. Zhang, and Y. Lei, “Damage detection of bridge structures under unknown seismic excitations using support vector machine based on transmissibility function and wavelet packet energy,” Smart Structures and Systems, Vol. 27, No. 2, pp. 257–266, Jan. 2021, https://doi.org/10.12989/sss.2021.27.2.257
-
H. R. Ahmadi, N. Mahdavi, and M. Bayat, “A new index based on short time Fourier transform for damage detection in bridge piers,” Computers and Concrete, Vol. 27, No. 5, pp. 447–455, Jan. 2021, https://doi.org/10.12989/cac.2021.27.5.447
-
S. Yoon, G.-H. Gwon, J.-H. Lee, and H.-J. Jung, “Three-dimensional image coordinate-based missing region of interest area detection and damage localization for bridge visual inspection using unmanned aerial vehicles,” Structural Health Monitoring, Vol. 20, No. 4, pp. 1462–1475, May 2020, https://doi.org/10.1177/1475921720918675
-
M. Hasanvand, “Machine learning methodology for identifying vehicles using image processing,” Artificial Intelligence and Applications, Vol. 1, No. 3, pp. 170–178, Jul. 2023, https://doi.org/10.47852/bonviewaia3202833
-
S. Li et al., “SPM-IS: An auto-algorithm to acquire a mature soybean phenotype based on instance segmentation,” The Crop Journal, Vol. 10, No. 5, pp. 1412–1423, Oct. 2022, https://doi.org/10.1016/j.cj.2021.05.014
-
C. Zheng et al., “A mango picking vision algorithm on instance segmentation and key point detection from RGB images in an open orchard,” Biosystems Engineering, Vol. 206, No. 6, pp. 32–54, Jun. 2021, https://doi.org/10.1016/j.biosystemseng.2021.03.012
-
F. Jiang, N. Li, and L. Zhou, “Grain segmentation of sandstone images based on convolutional neural networks and weighted fuzzy clustering,” IET Image Processing, Vol. 14, No. 14, pp. 3499–3507, Oct. 2020, https://doi.org/10.1049/iet-ipr.2019.1761
-
H. Bai and S. Wu, “Deep-learning-based nanowire detection in AFM images for automated nanomanipulation,” Nanotechnology and Precision Engineering, Vol. 4, No. 1, pp. 7–16, Mar. 2021, https://doi.org/10.1063/10.0003218
-
R. Meng, Q. Cui, Z. Zhou, C. Yuan, and X. Sun, “A novel steganography algorithm based on instance segmentation,” Computers, Materials and Continua, Vol. 62, No. 3, pp. 183–196, Jan. 2020, https://doi.org/10.32604/cmc.2020.05317
-
H. Xiao, W. Wang, L. Dong, and H. Ogai, “A novel bridge damage diagnosis algorithm based on deep learning with gray relational analysis for intelligent bridge monitoring system,” IEEJ Transactions on Electrical and Electronic Engineering, Vol. 16, No. 5, pp. 730–742, Apr. 2021, https://doi.org/10.1002/tee.23353
-
D. Z. Fu, R. Zhang, H. Liu, F. Li, Z. H. Du, and H. L. Ma, “Structural damage law of semiconductor bridge detonator under impact and overload environment,” Journal of Beijing Institute of Technology, Vol. 29, No. 2, pp. 190–194, 2020, https://doi.org/10.15918/j.jbit1004-0579.19117
-
P. Zhang, S. Li, Z. Liu, and D. Zhang, “Hysteretic behavior degeneration mechanism and damage evaluation of self-centering bridge pier system,” Engineering Structures, Vol. 270, No. 11, p. 114895, Nov. 2022, https://doi.org/10.1016/j.engstruct.2022.114895
-
J. Liu, Y. Wei, B. Chen, and H. Y. Noh, “A hierarchical semantic segmentation framework for computer vision-based bridge damage detection,” Smart Structures and Systems, Vol. 31, No. 4, pp. 325–334, Apr. 2023, https://doi.org/10.12989/sss.2023.31.4.325
-
L. Xiao, W. Li, J. Huyan, Z. Sun, and S. Tighe, “Crack grid detection and calculation based on convolutional neural network,” Canadian Journal of Civil Engineering, Vol. 48, No. 9, pp. 1192–1205, Sep. 2021, https://doi.org/10.1139/cjce-2020-0246
-
W. Lu, J. Dong, Y. Pan, G. Li, and J. Guo, “Damage identification of bridge structure model based on empirical mode decomposition algorithm and autoregressive integrated moving average procedure,” Archives of Civil Engineering, Vol. 68, No. 4, pp. 653–667, Sep. 2022, https://doi.org/10.24425/ace.2022.143060
-
B. Sun, T. Sun, Y. Zhang, and P. Jiao, “Urban traffic flow online prediction based on multi‐component attention mechanism,” IET Intelligent Transport Systems, Vol. 14, No. 10, pp. 1249–1258, Aug. 2020, https://doi.org/10.1049/iet-its.2020.0004
-
Y. Zheng, Z. Shao, Z. Gao, M. Deng, and X. Zhai, “Optimizing the online learners’ verbal intention classification efficiency based on the multi-head attention mechanism algorithm,” International Journal of Foundations of Computer Science, Vol. 33, No. 6n07, pp. 717–733, Sep. 2022, https://doi.org/10.1142/s0129054122420114
-
Y. Han, L. Feng, and J. Gao, “A new end-to-end framework based on non-local network structure and spatial attention mechanism for image rain removal,” International Journal of Computers and Applications, Vol. 44, No. 11, pp. 1083–1091, Nov. 2022, https://doi.org/10.1080/1206212x.2022.2112325
-
T. Hui, Y. Xu, and R. Jarhinbek, “Detail texture detection based on Yolov4‐tiny combined with attention mechanism and bicubic interpolation,” IET Image Processing, Vol. 15, No. 12, pp. 2736–2748, Apr. 2021, https://doi.org/10.1049/ipr2.12228
About this article

The research is supported by: Science and technology project of Department of Transportation of Jiangxi Province (2023H0020).
The datasets generated during and/or analyzed during the current study are available from the corresponding author on reasonable request.
Haiping Ding: conceptualization, methodology, writing-review and editing. Songying Wu: data curation, formal analysis, writing-original draft preparation.
The authors declare that they have no conflict of interest.
