Abstract
Thermocouple thermometers are widely used in laboratories and industry, the ice-water mixture is usually used as cold end compensation for thermocouple thermometer measurement. However, the ice-water mixture has disadvantages, such as complex manufacturing process, short use time, and unstable internal temperature field. The zero-temperature thermostat can replace the traditional ice water mixture to provide a stable temperature field environment. However, there is no suitable measurement method that can evaluate the zero-degree thermostat to meet the measurement requirements of thermocouple thermometer. Therefore, comparative experiments on temperature deviation, volatility, axial temperature field uniformity, radial temperature field uniformity, and load characteristics of the ice-water mixture and the zero-temperature thermostat are evaluated. In addition, the uncertainty of the zero-temperature thermostat and the ice water mixture is also proposed. The results reveal that the measurement results of temperature deviation, volatility, axial temperature field uniformity and load characteristic of the zero-temperature thermostat is smaller than that of the ice water mixture. Meanwhile, the uncertainty results also reveal that the zero-temperature thermostat is more stable than the ice water mixture. This study provides a comprehensive method for evaluating the performance of zero temperature thermostats, which can be used to verify the accuracy of the instrument and ensures the reliability of the thermocouple thermometers measurement, and promotes the development of zero temperature thermostat in temperature measurement field.
Highlights
- A method to evaluate the performance of a zero-degree thermostat
- Provides technical support and evaluation method for zero thermostats
- Measurement uncertainty is introduced to verify the reliability of the results
1. Introduction
Thermocouple thermometers are widely used for temperature measurement in laboratories or industrial sites. Because it has the advantages of high precision, fast response, large measuring range, high mechanical strength, long service life and easy installation, it is a commonly used high precision temperature measuring instrument [1-3]. According to the principle of thermocouple thermometer measurement, cold end compensation is required for temperature measurement during operation. This is not only an important factor limiting the maximum allowable error of high-precision thermocouple measurement, but also a major source of measured error [4-6]. In daily work, when measuring temperature precisely with a thermocouple, cold end compensation must be kept at a constant temperature. A dewar bottle containing a mixture of ice water is usually used to keep the temperature at 0 °C [7-9]. The method is very convenient and cheap. However, this method will cause a large error in the thermocouple measurement. The cold end compensation of the thermocouple will radiate heat with the external environment and the cold end compensation temperature cannot be kept constant. The dewar bottle must be replenished with ice regularly, which brings inconvenience to the work. This does not automate the measurement process and requires a special refrigerator for making ice [10-12]. In addition, the preparation of ice water mixture has certain requirements on the purity of water, thermal insulation equipment and production methods [13-14]. With the change of ambient temperature and the increase in use time, the temperature of the ice water mixture does not remain at 0 degrees Celsius, and the temperature of the ice water mixture needs to be detected at any time, which is very inconvenient in the actual use process.
Although some researchers have tried to solve the above problem. For example, Daniels [15] proposed a polynomial fitting correction method for steady-state temperature measurement. De [16] obtained a formula correction method suitable for steady-state measurement. Kapulla and Paranjape [17-18] evaluated the radiation error of the thermocouple over a certain temperature range during the OECD/NEA HYMERES-2 process. Researchers have basically studied the measurement methods and error compensation of thermocouples, but they have not solved the actual problem.
Under the background mentioned above, the advent of zero temperature thermostats seems to solve above problems. Zero-degree thermostat is a portable equipment that provides stable and accurate zero degrees Celsius for temperature measurement [19-21]. Zero-degree thermostat adopts semiconductor refrigeration technology, heat pipe technology and configuration of an intelligent digital regulator, which has the characteristics of stable working temperature, uniform temperature field and easy to use [22]. Zero temperature thermostat eliminates the complicated process of making ice water mixture, and displaying the temperature of each hole in real time, which can replace the traditional ice water mixture to provide a stable cold end temperature and convenience for thermocouple thermometer measurement [23-25]. However, the method to assess whether zero-degree thermostat can replace ice water mixtures as cold end compensation for thermocouple measurement have not been investigated.
Therefore, a method to evaluate the performance of a zero-degree thermostat is proposed in this paper. Temperature deviation, volatility, axial temperature difference, radial temperature difference and load characteristic are analyzed to verify the performance requirements of the zero-degree thermostat. In order to verify the validity of the results, the ice-water mixture is also used as a comparison in the experimental study. Measurement uncertainty is also introduced to verify the reliability of the results. This study provides technical support and evaluation method for the confirmation of the performance of the zero thermostats. This study ensures the accuracy of the quantity value of the zero-temperature thermostat and promotes the accuracy of the measurement of the thermocouple thermometer.
2. Method
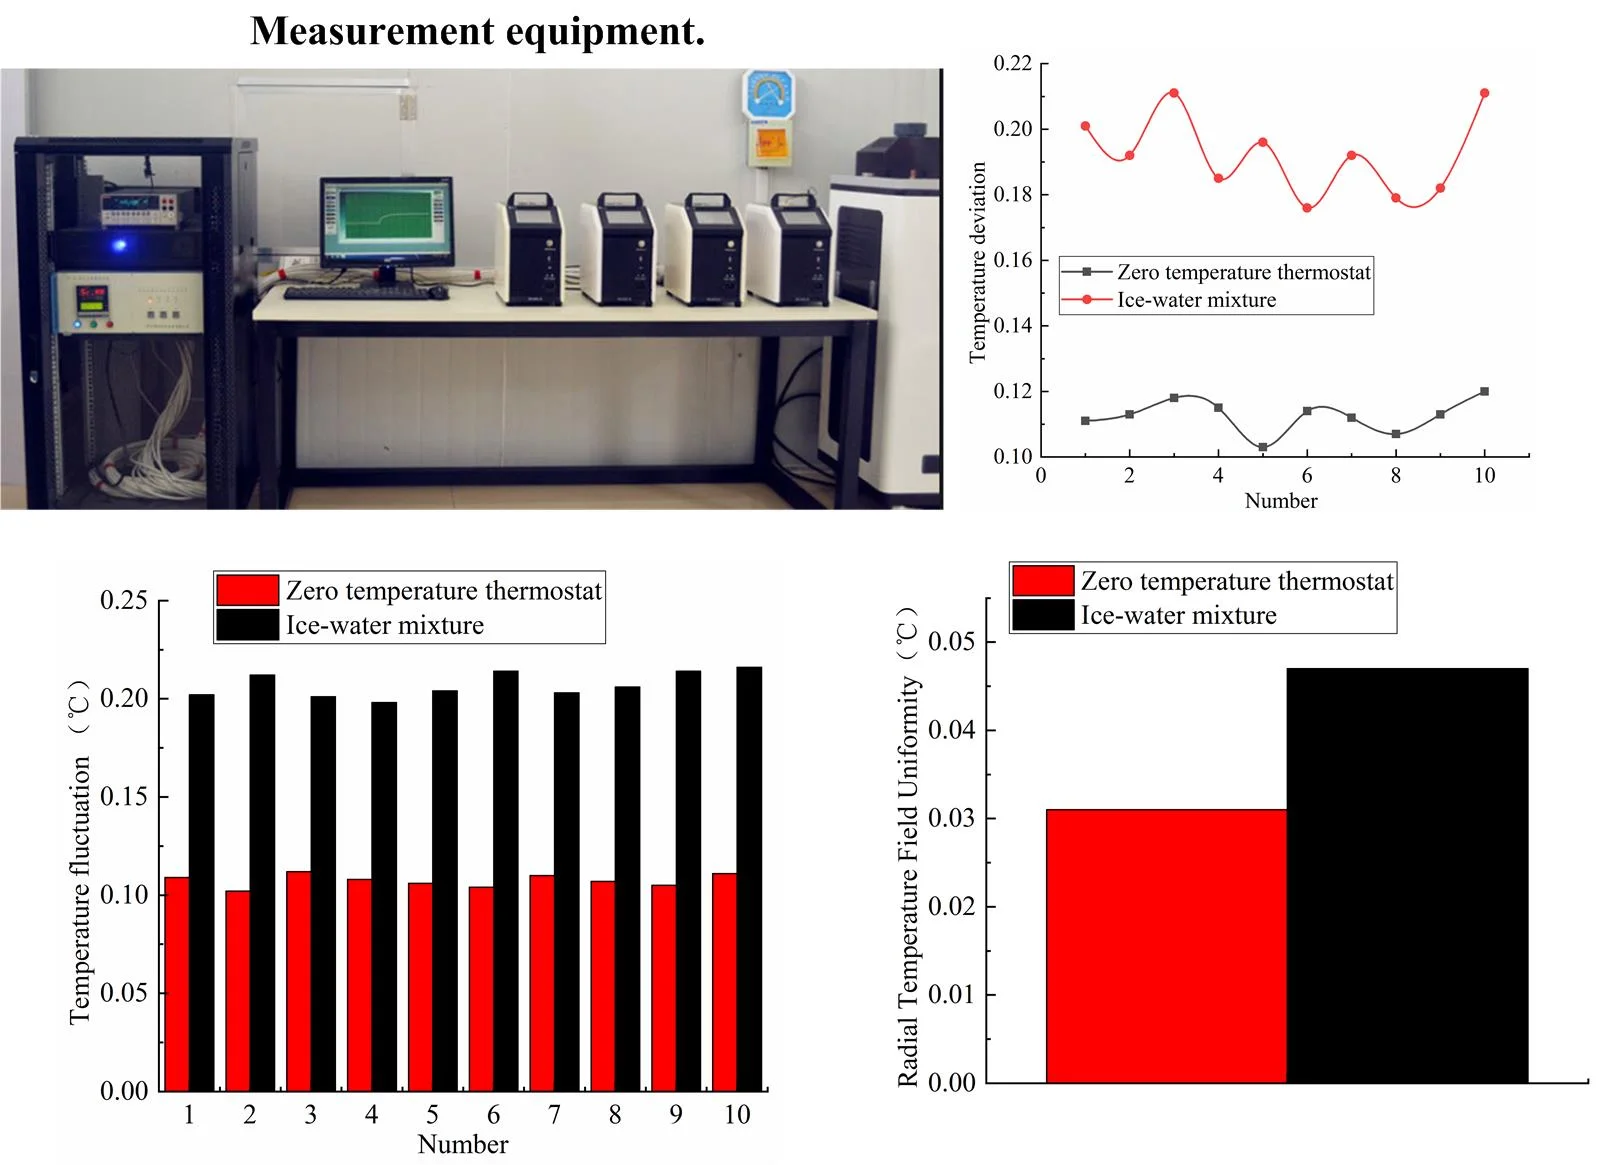
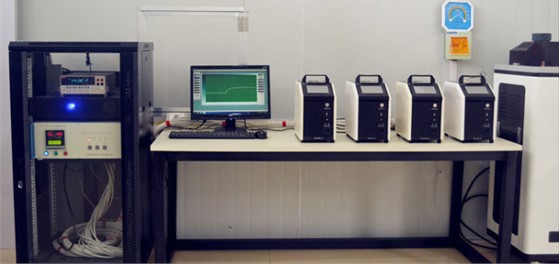
In this study, the performance of the zero-temperature thermostat is verified by detailed tests of temperature deviation characteristics, temperature fluctuation characteristics, temperature difference characteristics between holes, axial temperature field uniformity characteristics, and load characteristics. The same experiment is carried out as a comparison for the ice-water mixture. The ambient temperature of laboratory is 20 ℃ and the humidity is 70 % RH. The technical parameters of the standard device and supporting equipment used for the experiment are shown in Table 1 and Fig. 1.
Table 1Measurement equipment
Number | Device | Temperature measurement range | Application |
1 | Standard platinum resistance thermometer | (–189.3442-+419.527) ℃ | Measurement standard |
2 | Industrial platinum resistance thermometer | (–50-+400)℃ | As reference for measurement |
3 | Electrical measurement instrument | Accuracy level < 0.02, resolution < 0.1 m Ω | Measure the resistance value of a standard platinum resistance thermometer |
4 | Multi-point conversion switch | Contact emf ≤ 1.0 µV | A four-point switch that measures the resistance |
Before the test, turn on the zero-temperature thermostat and ice-water mixture for 20 minutes to keep it in a stable working state. The standard platinum resistance thermometer and the industrial platinum resistance thermometer are simultaneously inserted into the zero-temperature thermostat and ice-water mixture. A platinum resistance thermometer is measured using a mixture of ice water and a zero-temperature thermostat to measure the temperature of zero degrees Celsius.
Fig. 1Measurement equipment
2.1. Temperature deviation measurement method
Insert standard platinum resistance thermometers and industrial platinum resistance thermometers into the bottom of the center hole of a zero-degree thermostat or into a mixture of ice water to stabilize for 20 minutes. The temperature values of standard platinum resistance thermometers and industrial platinum resistance thermometers are recorded in the zero-temperature thermostat and the ice water mixture, respectively, the recording time is not less than 10 min, and the measurement speed is once per minute. A total of 10 measurements are taken, and the difference between the average of two platinum resistance thermometers and zero degrees Celsius is used as the temperature deviation. The analysis formula is shown as follows:
where Δt1 indicates the measured value of standard platinum resistance; Δt2 is the measured value of industrial platinum resistance.
2.2. Measurement of temperature fluctuation
Insert a standard platinum resistance thermometer into the bottom of the center hole of the zero-temperature thermostat or the ice water mixture. After stabilizing for 20 minutes, measure the standard platinum resistance thermometer every 3 minutes for a total of 10 measurements. Take half of the difference between the maximum and minimum measured values as the temperature fluctuation of the zero-temperature thermostat or the ice water mixture, shown as follows:
where Δtmaxis the maximum temperature; Δtmin is the minimum temperature.
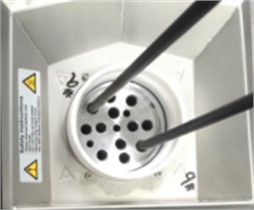
2.3. Radial temperature field uniformity
In order to reduce the effect of temperature drift over time, industrial platinum resistance thermometers and standard platinum resistance thermometers are inserted into the hole to eliminate the effect of temperature drift. The maximum temperature deviation is measured on the different holes of zero-degree thermostat. First, the two thermometers of A and B are inserted into the two measured holes of #a and #b, shown as in Fig. 2, the temperature values of tAa1 and tBb1 are recorded at the first time. Continue, exchange the location of reference thermometers of A and B, meaning thermometer A is inserted into hole #b and thermometer B is inserted into hole #a. After the temperature stabilized again, the temperature values of tAb1 and tBa2 corresponding to the two thermometers are recorded. Repeat the above procedure for 2 times, a total of four measurements are made.
The temperature difference between the holes-tab can be expressed as follows:
Fig. 2The two measured holes of #a and #b
2.4. Axial temperature-field uniformity
Insert a standard platinum resistance thermometer into the bottom of the hole, after the value is stable, record the indicating value of zero-degree thermostat or Ice-water mixture tbottom;
Raise the standard platinum resistance thermometer up to 20 mm, start timing, 10 minutes later, record the indicating value t20;
Raise the standard platinum resistance thermometer up to 40 mm, start timing, 10 minutes later, record the indicating value t40;
Raise the standard platinum resistance thermometer up to 60 mm, start timing, 10 minutes later, record the indicating value t60;
The difference between the maximum and minimum values in tbottom, t20, t40, t60 is the axial uniformity value, calculated it according to Eq. (4):
where Tbottom is temperature at the bottom of the zero-degree thermostat; T60mm is temperature value located 60mm from the bottom of the zero-temperature thermostat.
2.5. Load characteristic
Insert a standard platinum resistance thermometer into the hole of the zero-degree thermostat and make sure it touches the bottom of the measuring hole, and when the temperature reaches a stable level, record the measurement value of the platinum resistance thermometer as Temp. Then, the remaining holes are inserted into the industrial platinum resistance thermometers, and record the measurements of a standard platinum resistance thermometer at this time, as Tfull. According to Eq. (5), load characteristic is calculated as shown in Eq. (5):
where TFull is the temperature value when all holes are filled with platinum resistance temperatures; TEmp is the temperature value when only one platinum resistance thermometer is inserted into the hole.
In order to verify the performance of the zero-temperature thermostat, a comparison experiment is also done by using a mixture of ice water.
2.6. Uncertainty analysis
The model of the temperature deviation for the zero-temperature thermostat and the ice-water mixture is shown in Eq. (6):
where, Δt, tc and ts are the temperature indication value, the display temperature and the hole temperature of the zero temperature thermostat and ice-water mixture.
The meaning of δts, δtD, δti, δtR, δtB, δtL and δtV can be explained in Table 2.
Table 2The uncertainty components for the measurement
Symbol | Uncertainty | The cause of error uncertainty |
δts | The effect of resistance measurement | Resistance error caused by electrical measuring equipment |
δtD | Temperature drift | Temperature drift due to aging of standard platinum resistors |
δti | Resolution | Resolution uncertainty of zero temperature thermostat or ice water mixture |
δtR | Temperature difference between holes | Uncertainty of temperature difference between holes |
δtB | Axial temperature uniformity | Uncertainty of axial temperature uniformity |
δtL | Temperature instability | Uncertainty of temperature instability |
δtV | The effect of maximum load characteristics | The uncertainty of the influence of the maximum load characteristics |
Table 2 illustrates the uncertainty components for the measurement of the zero temperature thermostat and the ice-water mixture. Based on the uncertainty components in Table 2, the uncertainty of measurement can be expressed as follows:
where, ci represents the sensitivity coefficient for each uncertainty component. According to Eq. (7), the uncertainty of measurement can be solved.
3. Results
The purpose of the zero-temperature thermostat is to replace the ice water mixture as the temperature measurement at the cold end of the thermocouple. In order to verify the performance of the zero-temperature thermostat, various comparative experiments such as temperature deviation, temperature fluctuation, radial temperature uniformity, axial temperature uniformity, and load characteristics are performed using the ice water mixture.
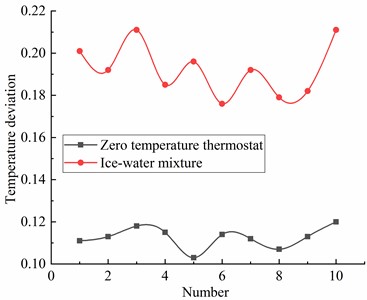
3.1. The results of temperature deviation
The deviation measurements of the zero-temperature thermostat and the ice water mixture at zero degrees Celsius are shown in Table 3, the results of temperature deviation can be shown as Table 3.
Table 3Results of the temperature deviation for zero temperature thermostat and ice water mixture
Number | 1 | 2 | 3 | 4 | 5 | 6 | 7 | 8 | 9 | 10 |
Temperature deviation of zero temperature thermostat | 0.111 ℃ | 0.113 ℃ | 0.118 ℃ | 0.115 ℃ | 0.103 ℃ | 0.114 ℃ | 0.112 ℃ | 0.107 ℃ | 0.099 ℃ | 0.094 ℃ |
Temperature deviation of Ice-water mixture | 0.201 ℃ | 0.192 ℃ | 0.211 ℃ | 0.185 ℃ | 0.196 ℃ | 0.176 ℃ | 0.192 ℃ | 0.179 ℃ | 0.182 ℃ | 0.211 ℃ |
Fig. 3 shows the results of temperature deviation for the zero-temperature thermostat and the ice water mixture. As shown in Table 2 and Fig. 3, it presents a state of ups and downs in 10 measurements, the temperature deviation of the ice-water mixture is significantly greater than that of the zero-temperature thermostat, At zero degrees Celsius, the temperature deviation of the zero degree thermostat is almost maintained at 0.1 ℃, and the temperature deviation of the ice-water mixture is almost maintained at 0.2 ℃. The temperature deviation result indicates that the zero-temperature thermostat has a smaller temperature deviation than that of the ice-water mixture, which meaning zero thermostat has higher accuracy than ice water mixture.
Fig. 3Temperature deviation
3.2. The results of temperature fluctuation
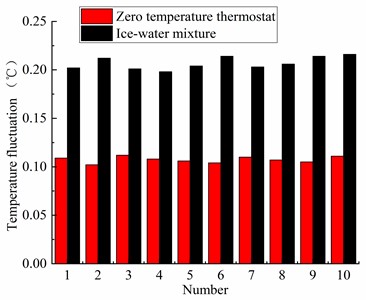
The temperature fluctuation of zero temperature thermostat and ice water mixture can be expressed as Table 4.
It can be shown that the temperature fluctuation results of the zero-temperature thermostat and the ice water mixture from Table 3 and Fig. 4. The temperature fluctuation of the zero-temperature thermostat and the ice-water mixture is relatively stable, and there is no big change in the test results of 10 times. The temperature fluctuation of the zero-temperature thermostat is basically maintained at about 0.1 ℃. However, the temperature fluctuation of the ice-water mixture remains stable at 0.2 ℃. Compared with the fluctuation of the ice-water mixture, the fluctuation of the zero-temperature thermostat is much smaller than that of the ice-water mixture, which indicates that the fluctuation of the zero-temperature thermostat is more stable and less susceptible to the external environment.
Table 4Results of the temperature fluctuation for zero temperature thermostat and ice water mixture
Number | 1 | 2 | 3 | 4 | 5 | 6 | 7 | 8 | 9 | 10 |
Temperature fluctuation of zero temperature thermostat | 0.109 ℃ | 0.102 ℃ | 0.112 ℃ | 0.108 ℃ | 0.106 ℃ | 0.104 ℃ | 0.110 ℃ | 0.107 ℃ | 0.105 ℃ | 0.111 ℃ |
Temperature fluctuation of Ice-water mixture | 0.202 ℃ | 0.212 ℃ | 0.201 ℃ | 0.198 ℃ | 0.204 ℃ | 0.214 ℃ | 0.203 ℃ | 0.206 ℃ | 0.214 ℃ | 0.216 ℃ |
Fig. 4Temperature fluctuation of zero temperature thermostat and ice water mixture
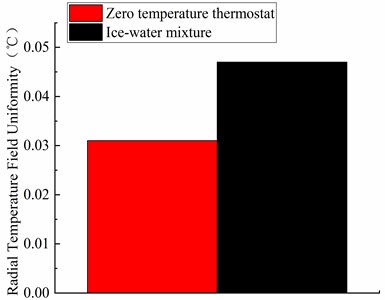
3.3. The results of the radial temperature field uniformity
The radial temperature uniformity results of the zero-temperature thermostat and the ice-water mixture can be shown in Table 5 and Fig. 5, the radial temperature uniformity of the zero-temperature thermostat is maintained at 0.031 ℃ while the radial temperature field uniformity of the ice-water mixture is 0.047 ℃. Because the internal temperature field of the ice-water mixture is not uniform, and with the change of measurement time, the internal temperature of the ice-water mixture changes. Because the internal temperature field of the ice-water mixture is not uniform, and with the change of measurement time, the internal temperature of the ice-water mixture changes, which leads to the greater uniformity of the radial temperature field of the ice-water mixture.
Table 5Results of the radial temperature field uniformity
Adial temperature field uniformity | tAa1 | tBa2 | tAa3 | tBa4 | tBb1 | tAb2 | tBb3 | tAb4 |
Zero temperature thermostat | 0.116 ℃ | 0.123 ℃ | 0.121 ℃ | 0.113 ℃ | 0.100 ℃ | 0.117 ℃ | 0.120 ℃ | 0.105 ℃ |
Ice-water mixture | 0.216 ℃ | 0.198 ℃ | 0.211 ℃ | 0.221 ℃ | 0.196 ℃ | 0.204 ℃ | 0.195 ℃ | 0.204 ℃ |
Fig. 5Results of the radial temperature field uniformity
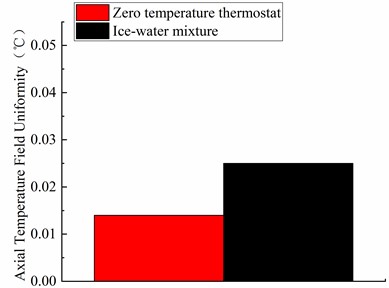
3.4. The results of the axial temperature-field uniformity
As can be seen from Table 6 and Fig. 6, at the zero temperature measuring point, it is obvious that at measuring point of zero degrees Celsius, the axial deviation of the ice-water mixture is also large, can be reach at 0.025 ℃, while the axial uniformity of the zero temperature thermostat is better, maintaining at 0.014 ℃.This indicates that the axial temperature field inside the zero temperature thermostat is more uniform than that of the ice-water mixture. As can be seen from Table 5, the deeper the platinum resistance thermometer is inserted into the hole, the greater the measurement value can be obtained. This result means that the closer you get to the bottom of the zero-temperature thermostat, the more accurate the measurement is.
Table 6Results of the axial temperature field uniformity
Axial temperature-field uniformity | tbottom | t20 | t40 | t60 |
Zero temperature thermostat | 0.119 ℃ | 0.116 ℃ | 0.111 ℃ | 0.105 ℃ |
Ice-water mixture | 0.221 ℃ | 0.211 ℃ | 0.202 ℃ | 0.196 ℃ |
Fig. 6Results of the axial temperature field uniformity
3.5. The results of load characteristic
The load characteristics of the zero-temperature thermostat and the ice water mixture can be shown as shown in Table 7. When the holes of zero temperature thermostat and ice water mixture are filled with standard platinum resistance thermometer. Compared with the case of only inserting a platinum resistance thermometer, the measurement value of the thermometer at this time is significantly reduced. Similar to the above results, the load characteristic of the zero-temperature thermostat is 0.009 ℃, which is better than that of 0.014 ℃ for the ice water mixture.
Table 7Results of the load characteristic
Load characteristic | TFull | TEmp | ΔTLoad |
Zero temperature thermostat | 0.102 ℃ | 0.111 ℃ | 0.009 ℃ |
Ice-water mixture | 0.198 ℃ | 0.212 ℃ | 0.014 ℃ |
3.6. Evaluation of measurement uncertainty
In order to verify the reliability of the method for evaluating the zero-temperature thermostat and analyze its accuracy, the measurement uncertainty of the zero temperature thermostat and the ice-water mixture are compared as follows:
The uncertainty components of the zero-temperature thermostat and the ice water mixture can be shown in Table 2. The measurement uncertainty component of the zero-degree thermostat can be shown in Table 8.
The uncertainty component of the ice-water mixture can be shown in Table 9.
According to Table 8, the synthetic uncertainty of zero temperature thermostat can be obtained as follows:
When k is 2, the extended uncertainty of zero temperature thermostat can be obtained as follows:
According to Table 9, the synthetic uncertainty of ice-water mixture can be obtained as follows:
Similarly, the extended uncertainty of ice water mixture can be expressed as follows:
Compare the extended uncertainties of the zero-temperature thermostat and the ice water mixture as follows:
Based on the results of the measurements in Table 8 and Table 9. The extended uncertainties of the zero-temperature thermostat and the ice-water mixture are 0.034 ℃ and 0.044 ℃, respectively, which shows the uncertainty of the zero-temperature thermostat is 0.01 ℃ less than that of the ice water mixture. This means that the temperature measurement accuracy of the zero-degree thermostat is better than that of the zero-degree thermostat. This means that the measurement reliability of zero temperature thermostat is higher than that of ice water mixture, which indicates that the zero-temperature thermostat can replace the ice-water mixture for the measurement of thermocouple thermometers.
Table 8The uncertainty component of the zero-degree thermostat
Uncertainty component | Standard uncertainty u(xi) / ℃ | Probability distribution | Sensitivity coefficient |ci| | Uncertainty component ui(y) / °C |
δts | 0.01 | Normality | 1.0 | 0.01 |
δtD | 0.006 | Uniform | 1.0 | 0.006 |
δti | 0.003 | Uniform | 1.0 | 0.003 |
δtR | 0.006 | Uniform | 1.0 | 0.006 |
δtB | 0.006 | Uniform | 1.0 | 0.006 |
δtL | 0.006 | Uniform | 1.0 | 0.006 |
δtV | 0.006 | Uniform | 1.0 | 0.006 |
Table 9The uncertainty component of the ice-water mixture
Uncertainty component | Standard uncertainty u(xi) / ℃ | Probability distribution | Sensitivity coefficient |ci| | Uncertainty component ui(y) / °C |
δts | 0.015 | Normality | 1.0 | 0.015 |
δtD | 0.006 | Uniform | 1.0 | 0.006 |
δti | 0.004 | Uniform | 1.0 | 0.004 |
δtR | 0.007 | Uniform | 1.0 | 0.007 |
δtB | 0.007 | Uniform | 1.0 | 0.007 |
δtL | 0.007 | Uniform | 1.0 | 0.007 |
δtV | 0.007 | Uniform | 1.0 | 0.007 |
4. Conclusions
With the wide application of thermocouple thermometers in various fields, thermocouple thermometers generally require ice-water mixture to compensate the cold end. However, the process of making the ice-water mixture is very complicated, so the generation of the zero-temperature thermostat can effectively replace the ice-water mixture. Therefore, a method for evaluating the performance of a zero-temperature thermostat is proposed. A variety of its characteristics such as temperature deviation, volatility, axial temperature difference, radial temperature difference and load characteristics are studied. In addition, ice water mixture is used as a comparison to verify the performance of the zero-temperature thermostat. The experimental results show that the various performance characteristics of the zero-temperature thermostat are better than that of the ice water mixture. This means that when measuring with a zero-temperature thermostat as the cold end of a thermocouple thermometer, the measurement results will be more stable and will produce less error. Similarly, the uncertainty results of zero temperature thermostat is also less than that of ice-water mixture. The experimental results show that the zero-temperature thermostat can completely replace the ice-water mixture as the cold end compensation of the thermocouple thermometer. This study provides a method for evaluating the characteristics of the zero-degree thermostat, which proves that the zero-temperature thermostat can successfully replace the traditional ice water mixture, thus saving costs and improving measurement efficiency. Meanwhile, the research in this paper also has certain limitations. The measurement results of zero temperature thermostat will be greatly affected by different environments, so it is very important to study the influence of ambient temperature on the accuracy of zero temperature thermostat for temperature measurement in the future.
References
-
S. Brohez, C. Delvosalle, and G. Marlair, “A two-thermocouples probe for radiation corrections of measured temperatures in compartment fires,” Fire Safety Journal, Vol. 39, No. 5, pp. 399–411, Jul. 2004, https://doi.org/10.1016/j.firesaf.2004.03.002
-
V. Hindasageri, R. P. Vedula, and S. V. Prabhu, “Thermocouple error correction for measuring the flame temperature with determination of emissivity and heat transfer coefficient,” Review of Scientific Instruments, Vol. 84, No. 2, pp. 82–92, Feb. 2013, https://doi.org/10.1063/1.4790471
-
X. Zhao, X. Jia, L. Pei, Q. Shi, and J. Wu, “Study of the test methods of emission rates in different ambient temperature fields,” in Journal of Physics: Conference Series, Vol. 2168, No. 1, p. 012018, Jan. 2022, https://doi.org/10.1088/1742-6596/2168/1/012018
-
M. Ballico and C. Freund, “A cryostat for automated mK-level thermometer calibrations from −202 °C to 250°C,” International Journal of Thermophysics, Vol. 32, No. 11-12, pp. 2360–2369, Dec. 2011, https://doi.org/10.1007/s10765-011-1125-5
-
M. Hohmann, S. Marin, M. Schalles, G. Krapf, and T. Fröhlich, “Dry block calibrator using heat flux sensors and an adiabatic shield,” International Journal of Thermophysics, Vol. 36, No. 8, pp. 2085–2098, Jul. 2015, https://doi.org/10.1007/s10765-015-1943-y
-
M. Hohmann, S. Marin, M. Schalles, and T. Fröhlich, “Dry block calibrator with improved temperature field and integrated fixed-point cells,” International Journal of Thermophysics, Vol. 38, No. 2, pp. 17–25, Dec. 2016, https://doi.org/10.1007/s10765-016-2155-9
-
C. K. Hsieh and K. C. Su, “Design, construction, and analysis of a continuous-temperature infrared calibrator for temperature measurement using an infrared scanner,” Review of Scientific Instruments, Vol. 50, No. 7, pp. 888–896, Jul. 1979, https://doi.org/10.1063/1.1135934
-
X. Zhao, Z. Zhao, Q. Shi, M. Dou, R. Zheng, and L. Cui, “Comparative experimental study on the stability of two brands of dry block furnace,” in IEEE Conference on Telecommunications, Optics and Computer Science (TOCS), pp. 38–41, Dec. 2020, https://doi.org/10.1109/tocs50858.2020.9339692
-
Yao. Lifang, Chen. Yu, Zheng. Wei, and Zhu. Jialiang, “Calibration method of precision platinum resistance thermometer,” (in Chinese), Shanghai Metrology Test, Vol. 41, No. 4, pp. 113–119, 2014.
-
A. A. Sachenko, V. V. Kochan, and V. Y. Mil’Chenko, “Check of thermoelectric transducers with built-in temperature calibrators,” Measurement Techniques, Vol. 31, No. 7, pp. 679–682, Jul. 1988, https://doi.org/10.1007/bf00866664
-
K. Cho, H. R. Brown, and D. C. Miller, “Effect of a block copolymer on the adhesion between incompatible polymers. I. Symmetric tests,” Journal of Polymer Science Part B: Polymer Physics, Vol. 28, No. 10, pp. 1699–1718, Mar. 2003, https://doi.org/10.1002/polb.1990.090281005
-
W. Zhe, Y. Songlin, Z. Xinming, L. Qiangguang, and S. Wenjie, “Research on test methods for calibrating automatic measurement system of cheap metal thermocouples at 300 ℃ and below,” (in Chinese), Journal of Physics: Conference Series, Vol. 1437, No. 1, p. 012045, Jan. 2020, https://doi.org/10.1088/1742-6596/1437/1/012045
-
Jinyao Li and Yonglie Qin, “Method to improve the measuring accuracy of surface thermocouple thermometer,” (in Chinese), Metrology and Testing Technology, Vol. 11, No. 6, pp. 17–20, 2023.
-
M. A. Ezzat and A. A. El-Bary, “Two-temperature theory of magneto-thermo-viscoelasticity with fractional derivative and integral orders heat transfer,” Journal of Electromagnetic Waves and Applications, Vol. 28, No. 16, pp. 1985–2004, Nov. 2014, https://doi.org/10.1080/09205071.2014.953639
-
D. S. De, “Measurement of flame temperature with a multi-element thermocouple,” Journal of the Institute of Energy, Vol. 54, No. 419, pp. 113–116, 2019.
-
R. Kapulla, G. Mignot, S. Paranjape, L. Ryan, and D. Paladino, “Large scale gas stratification erosion by a vertical helium-air jet,” Science and Technology of Nuclear Installations, Vol. 2014, No. 32, pp. 1–16, Jan. 2014, https://doi.org/10.1155/2014/197267
-
R. Kapulla, G. Mignot, S. Paranjape, M. Andreani, and D. Paladino, “Large scale experiments representing a containment natural circulation loop during an accident scenario,” Science and Technology of Nuclear Installations, Vol. 2018, No. 2, pp. 1–12, Nov. 2018, https://doi.org/10.1155/2018/8989070
-
J. Gale, A. Manes, and A. Poljakoff-Mayber, “A rapidly equilibrating thermocouple contact thermometer for measurement of leaf‐surface temperatures,” Ecology, Vol. 51, No. 3, pp. 521–525, May 1970, https://doi.org/10.2307/1935390
-
D. F. Wanjura and D. R. Upchurch, “Infrared thermometer calibration and viewing method effects on canopy temperature measurement,” Agricultural and Forest Meteorology, Vol. 55, No. 3-4, pp. 309–321, Jun. 1991, https://doi.org/10.1016/0168-1923(91)90068-2
-
C. Shen, “Measurement performance calibration and uncertainty evaluation of thermocouple temperature calibrator,” (in Chinese), Metrology Technique, Vol. 53, No. 1, pp. 54–62, 2008.
-
Ma Yashi, “Analysis of technical problems in the measurement and calibration of thermocouples,” Chinese Science and Technology Journal Database Engineering Technology, Vol. 42, No. 3, pp. 11–15, 2023.
-
Chen Su, “Analysis and research on axial temperature field uniformity of dry type temperature calibrator,” (in Chinese), Measurement technology, Vol. 23, No. 20, pp. 16–23, 2020, https://doi.org/10.1088/1742-6596/2101/1/012019/pdf
-
X. Zhang et al., “High precision of zero thermostat performance evaluation method,” (in Chinese), Journal of measurement technology, Vol. 10, No. 4, pp. 20–26, 2019.
-
X. H. Xu, “Comparison and application of thermal resistance thermometer and thermocouple thermometer,” (in Chinese), Inner Mongolia Petrochemical Industry, Vol. 23, No. 2, pp. 80–86, 2009.
-
X. Zhao, Z. Zhao, F. Guo, X. Zhang, Q. Shi, and J. Wu, “The influence of thermal imager parameters on the accuracy of infrared thermal imager,” in IEEE Conference on Telecommunications, Optics and Computer Science (TOCS), pp. 1–4, Dec. 2020, https://doi.org/10.1109/tocs50858.2020.9339617
About this article

The authors have not disclosed any funding.
The datasets generated during and/or analyzed during the current study are available from the corresponding author on reasonable request.
The authors declare that they have no conflict of interest.
