Abstract
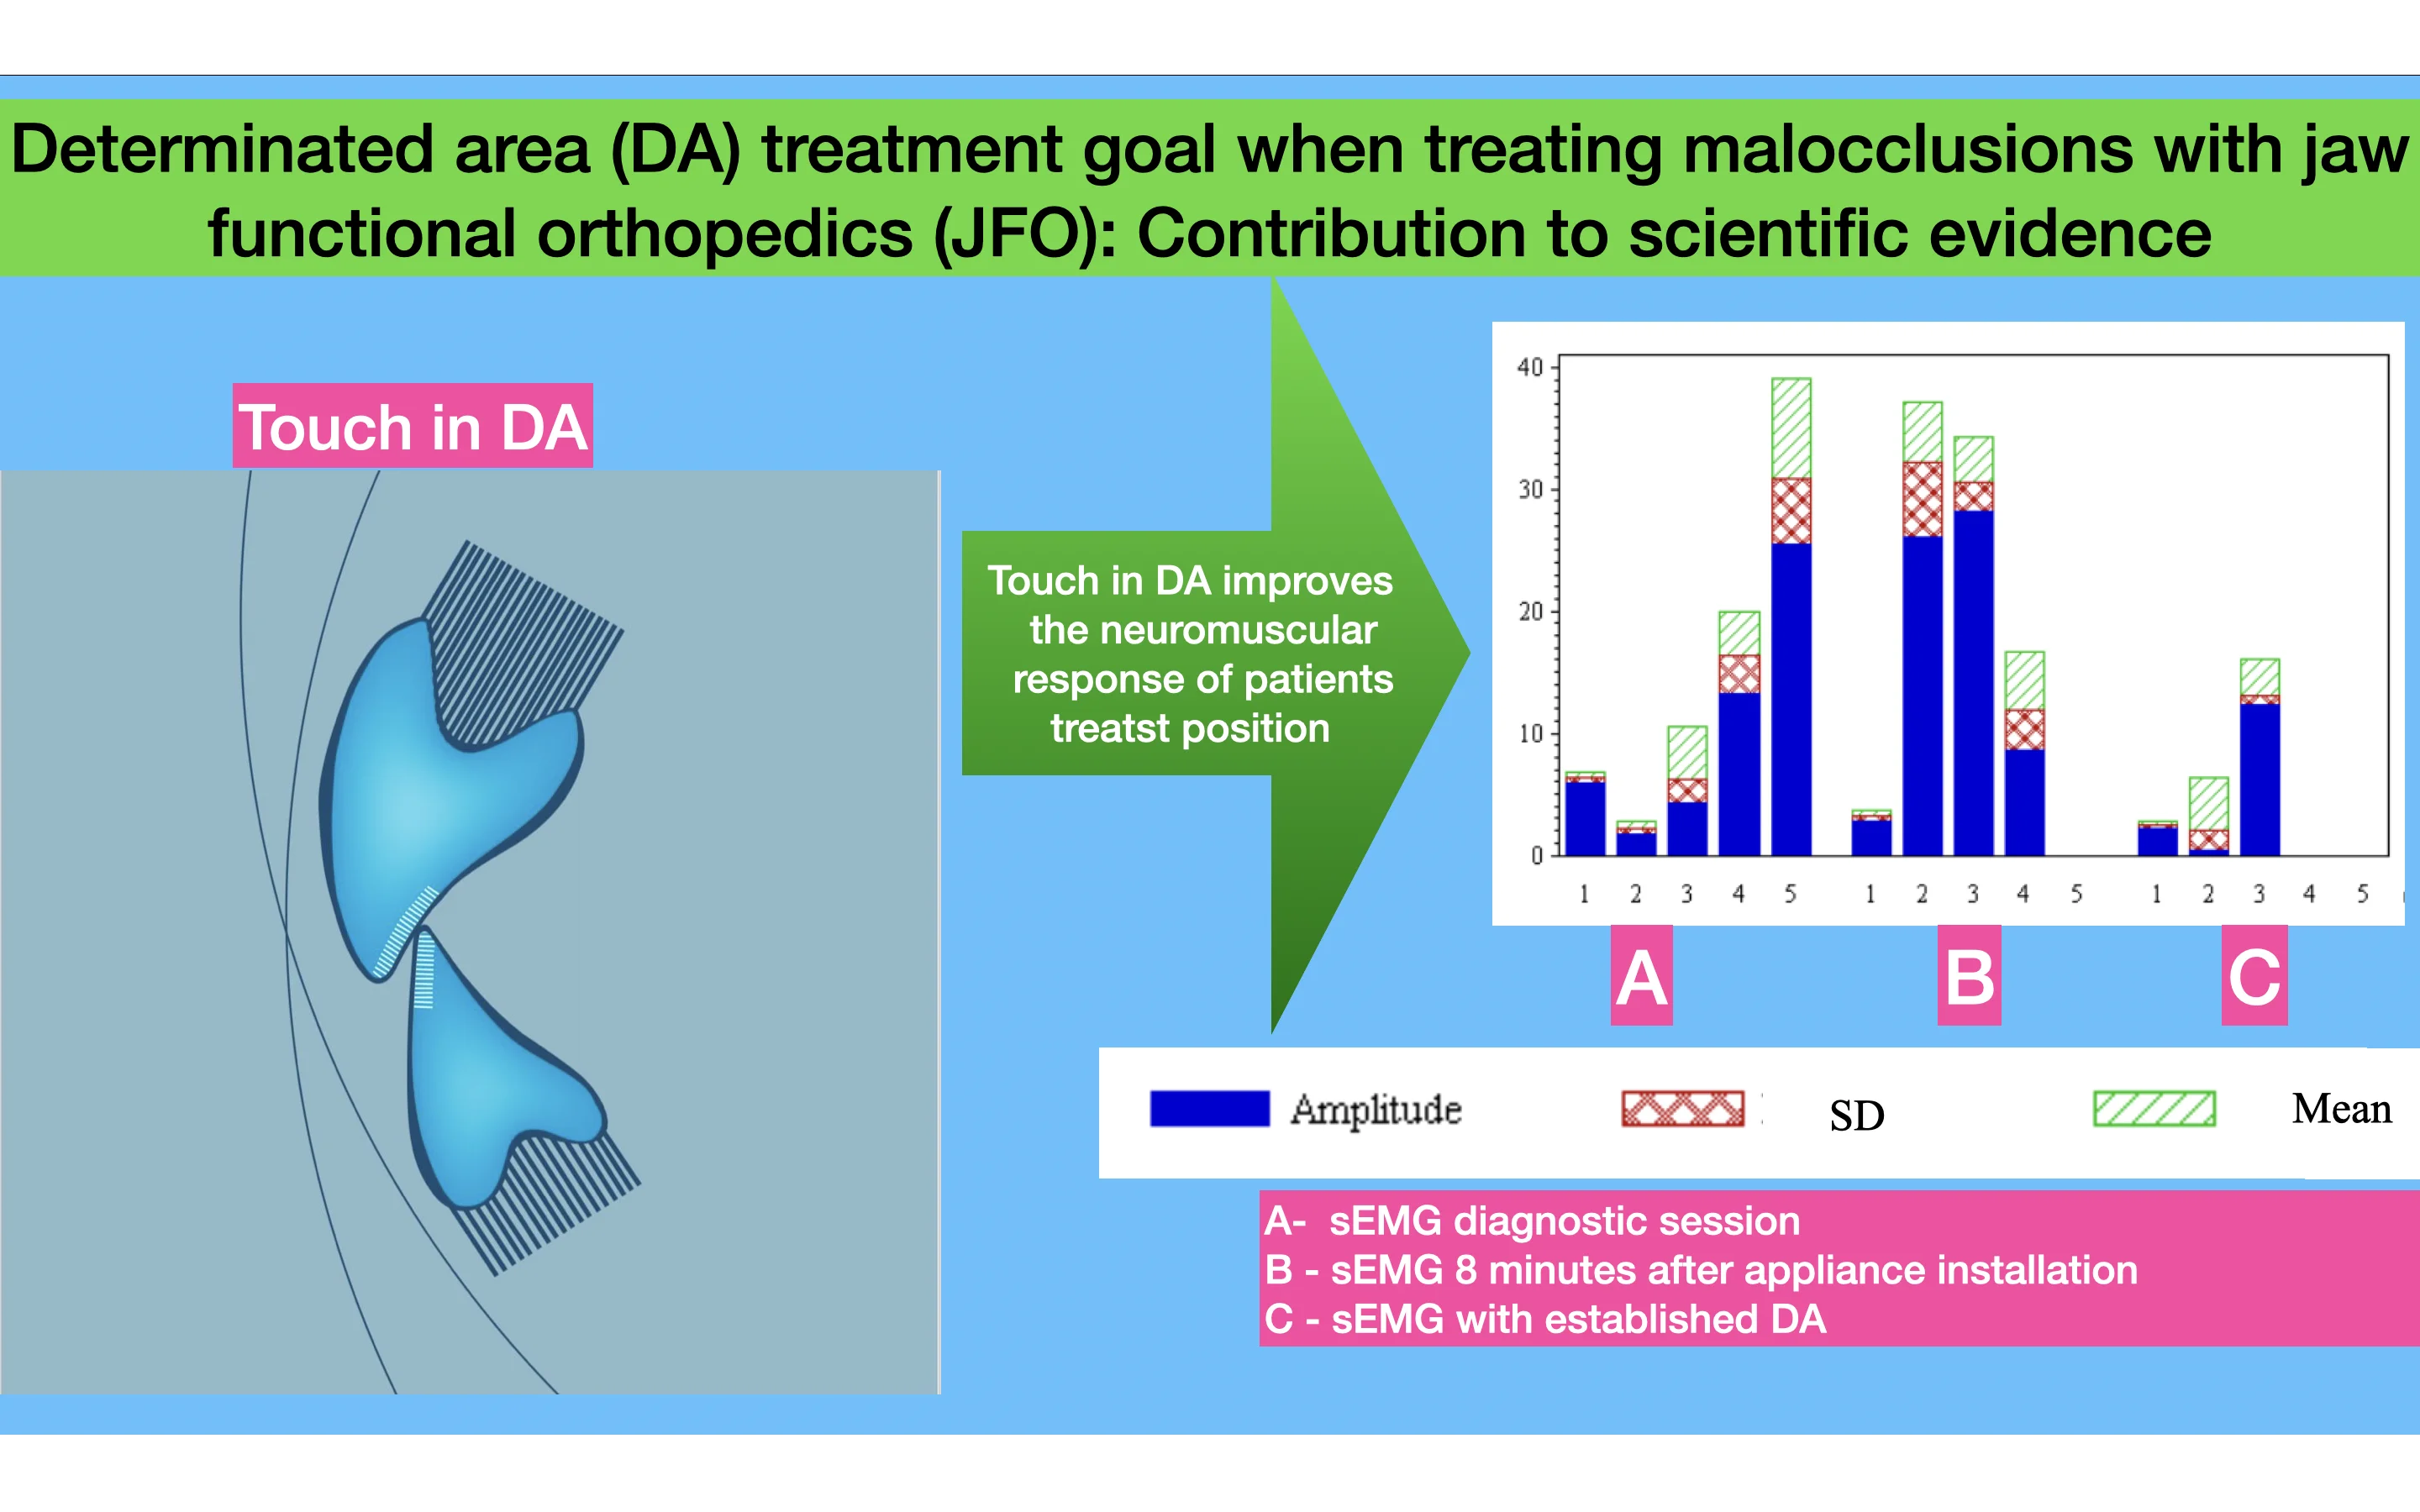
One of the goals of malocclusion treatment with Jaw Functional Orthopedics (JFO) is to obtain touch of the inferior incisors against the superior incisors in Determinate Area (DA). It is postulated that this touch would bring better stimuli and consequently faster results. Surface electromyographic study of the muscles was performed in Masseter, Temporal and suprahyoid muscles bilaterally from 159 patients undergoing malocclusion treatment with functional orthopedic appliances (FOA). To record muscle electric activity were used a conditioning signal module from Lynx Electronics Ltda with 8 channels, model EMG1000; software AqDAnalysis 4,18 from Lynx Electronics Ltda.; Software Lynx BioInspector 1,8r; passive surface electrodes (Ag/AgCl) from Noraxon Dual Electrodes (USA); dischargeable reference electrodes Kendall Meditrace (Ag/AgCl) – Canada. Frequency calibration was 2000 Hz, with 2048 sample by channel and time 1,024 seconds, and filters regulation was 20 Hz and 1000 Hz. The results found prove that there is a better electromyographic activity (bilaterally balanced) of the studied muscles when there is touch on DA. Conclusion. Touch in DA improves the neuromuscular response of patients treated with JFO. sEMG is a trustable tool to analyze masticatory muscles function for Diagnosis, Treatment and evaluation post treatment/gained objective.
Highlights
- Touch in DA improves sEMG of stomatognathic muscles
- Touch in DA as a Jaw Functional Orthopedics treatment goal brings better sEMG improvement of stomatognathic muscles
- Touch in DA should be a goal when treating malocclusion with Jaw Functional Orthopedics
- Touch in DA should be a goal when treating malocclusion with Dentofacial Orthopedics
- Touch in DA should be a goal when constructing functional orthopedic appliances to treat malocclusion
1. Introduction
Planas since his first publications in late 50’s and early 60’s stated that the incisive proprioception brings better results when treating malocclusion with neuro-occlusal rehabilitation [1]. He defended the thesis that when the mandible is free to move and during its lateroprotrusive movements or protrusive movements the buccal face inferior incisors touch the palatine face of the superior incisor the contact will trigger better development stimuli to the stomatognathic system (SS). It is good to remember that in Planas’ treatment protocol the ideal stimulation is the freedom of mandibular movements and the advances the mandible and keeps it forward in very specific cases [1, 2].
There are several protocols of therapeutic mandibular posture change (TMPC) with functional appliances depending on the type of malocclusion being treated [3]. It is postulated by Simões that when you construct the FOA TMPC and get the touch of the buccal surface of the inferior incisors in its incisal third against the palatine surface of the superior incisors in its incisal third – touch in DA – it is achieved the "supreme neural stimulation" for the treatment of malocclusions. Planas. The aim of this investigation is check, with surface electromyography of bilateral masseter, temporal and suprahyoid muscles, the stimuli improvement when the TMPC reach DA touch if it can be considered as a deal for malocclusions treatments with FOA, and if sEMG is a trustable tool to analyze masticatory muscles function for Diagnosis, Treatment and evaluation post treatment/ gained objective.
2. Methodology
Using a basis formed by 159 patients under treatment in Specialization course. The protocol followed the course to diagnosis, planification, and treatment includes: Anamnesis, Physical and Functional examination, normal lateral tele radiography (with Bimler and Petrovic cephalometry), tele radiography in NHP (Normal Head Position) (with Rocabado Cephalometry), Gnatostatic casts, mouth and body photos and films, sEMG collected in three times (Diagnosis, Appliance installation, D.A. obtained: Determined Area ) by three ways (Diagnosis- isometric contraction, FOA installation and fifteen minutes after this. sEMG examination follow ISEK protocol (bilaterally registration), and used no Normalization, all sEMG signals were analyzed from zero (rest) until the finish (15 seconds). All above data constructed the Tripled List to Diagnosis, Priorities and Treatment (Sakai & Corsi 2005). Appliances were made following instructions contained on Simoes. After obtained D.A., sEMG data were done again in three conditions: rest, isometric contraction with FOA and without it, under same Ambiental conditions (especially electromagnetic area isolation. Materials to sEMG: conditioning signals module from Lynx Electronics Ltda with 8 channels, model EMG1000; software AqDAnalysis 4,18 from Lynx Electronics Ltda.; Software Lynx BioInspector 1,8r; passive surface electrodes (Ag/AgCl) from Noraxon Dual Electrodes (USA); dischargeable reference electrodes Kendall Meditrace (Ag/AgCl) – Canada . Frequency calibration was 2000 Hz, with 2048 sample by channel and time 1,024 seconds, and filters regulation was 20 Hz and 1000 Hz. This investigation, authorized by the Research in Humans Ethics Committee of Universidade Estadual de Campinas (UNICAMP), Piracicaba, Brazil under protocol 159/2004.
In this study, patients were evaluated in 3 situations: Diagnosis – Diagnosis session (T1), Functional Orthopedic Appliance (FOA) -the day of functional appliance placement on the mouth (T2) and Determined Area (DA) – when patient maintains the touch between buccal face of inferior incisor against the palatine face of upper incisor without the appliance (T3), and each moments combination justify pairing because same patients were evaluated on 3 conditions what suggest association degree between data observed. For Pared Data it´s usually apply Student’s T test, Wilcoxon Test and Signal Test. Due to size of the sample (less than 2000), Shapiro-Wilk Test was used, because the sample has a normal distribution at significance level of 5 %.
Grouping analysis were applied to create patient groups with same result, in opposition to patients that show different results in order to evaluate groups and explain different comportments based on distinct morphometrics characteristics and diagnosis/prognosis; these characteristics cannot be controlled at time to choose experimental patients. It was used average grouping method based on data averaged. Method average linkage works with not pondered groups pairs method, using arithmetic average using middle distances.
2.1. Data preparing
Grouping analysis used electromyographic equilibrium data obtained by 3 indicators: Average Difference, Pattern Deviation Difference and Amplitude Difference; these differences calculated based on values observed on muscles Temporalis, Masseter and Suprahyoid. Measurements based on basic parameters (Average, pattern-deviation and Amplitude), obtained on 3 root mean square (RMS) evaluation of each patient for each muscle. After these, differences in absolute terms were calculated on values observed on each side muscles (right and left).
Values closer to zero indicates RMS values with small differences; values more than zero indicates predominance of muscular activity by one side, but without side definition.
Calculus of RMS that is average muscular activity observed from electromyographic study:
where, is patient indicator; is phase indicator (Diagnosis, FOA and DA); statistic observed from 3 collections from same patient (average, pattern-deviation or amplitude), is muscle indicator (Masseter, Temporalis and suprahyoid).
From muscular equilibrium values were developed average comparison studies by paired data tests and grouping analysis, and for this some processing were conducted follow determined by analysis techniques used.
3. Results
Obtained D.A., third sEMG data were done, in Rest, Isometric Contraction with and without FOA. After some statistical treatment, adequate to biological data, were found that D.A. is a good and important goal to malocclusions treatment with JFO. Results showed that functional mandible movements were equal, and sEMG profile were equilibrated bilaterally in all cases, moments, and situations. And more, for first time were obtained Rest registration with results closer to zero (centesimal of microvolt).
Table 1Supposition study and comparisons of media significant to significance level 5 % based on tests for paired data during swallowing
Variable | Group | H0: Normal | Asymmetry P | Statistical | Statistical test | value |
Me-da-aof-sd | 1 | –8,5124 | 0,0044 | –1,68 | Signaled orders test | 0,00195 |
Am-da-aof-sd | 2 | –40,6571 | 0,227 | –0,7832 | Student’s T test | 0,00320 |
Me-aof-dia-sd | 3 | –0,6286 | 0,4346 | –0,6119 | Student’s T test | 0,00365 |
Am-aof-dia-me | 4 | 5,7348 | 0,0135 | 1,93 | Signaled orders test | 0,01367 |
Dp-aof-dia-me | 5 | 0,8451 | 0,2017 | 0,1681 | Student’s T test | 0,01406 |
Am-aof-dia-sd | 6 | 29,8577 | 0,1572 | 0,8718 | Student’s T test | 0,01508 |
Am-aof-dia-se | 7 | 22,7963 | 0,7679 | 0,0411 | Student’s T test | 0,02073 |
Dp-aof-dia-se | 8 | 3,2374 | 0,4490 | 0,2878 | Student’s T test | 0,33360 |
Commentary 1: The Signaled Order Test is recommended because there is no normality signals (0,0044), but symmetry, that reveal statistically strong signals (0,00195) of differences between real medias on T3 and T2 from right suprahyoid muscle. Difference of media is negative and show that RMS values observed on T2 are bigger than on T3.
Commentary 2: Student’s T test shows statistically significant different signals (0,00320) of true amplitudes on T3 and T2 from right suprahyoid muscle. The difference of media is negative, and RMS values observed on T2 are more heterogeneous than observed on T3 phase.
Commentary 3: Student’s T test show signal statistically significant difference ( 0,00365) from real media on T2 than on T1of right temporalis muscle showing smaller signal amplitude on T2 concluding that RMS values of T1 are bigger than T2.
Commentary 4: Signal Test reveal true amplitudes signals shows statistically significant difference (0,01367) between T1 and T2 on left masseter muscle. This difference is positive, and because of this RMS values on T2 are more heterogeneous than on T1.
Commentary 5: Student’s T test shows statistically significant difference ( 0,01406) between true patterns deviation on T2 and T1 from left masseter muscle. RMS values observed on T2 are more heterogeneous than on T1.
Commentary 6: Student’s T test shows statistically significant difference (0,01508) between true amplitudes on T2 and T1 from right suprahyoid muscle show more heterogeneity on T2.
Commentary 7: Student’s T test shows statistically significant difference ( 0,02073) between true amplitude on T2 and T1 form left suprahyoid muscle showing more heterogeneity on T2 than T1 on the signals similar of the finding on the right side.
Commentary 8: Student’s T test shows statistically significant difference (0,03336) between true pattern deviation on T2 and T1 from left suprahyoid muscle; this difference is positive, and because of this RMS values observed on T2 are more heterogeneous than observed T1.
Table 2Supposition study and comparison of significant medias at 5 % significance level for more powerful pared data during isometry
Variable | Average | H0: Normal | Asymmetry | Statistical test | Statistic H0: | value |
H0: = 0 | ||||||
me-aof-dia-td | –27,4 | 0,48744 | 0,40252 | Student´s T test | –3,06720 | 0.01341 |
am-aof-dia-td | –37,0: | 0,28759 | 0,15675 | Student´s T test | –2,47709 | 0,03516 |
dp-aof-dia-td | –6,5: | 0,31435 | 0,07930 | Student´s T test | –2,37347 | 0,04167 |
me-da-dia-te | –21,5: | 0,19050 | 0,73862 | Student´s T test | –2,36681 | 0,04213 |
The recordings of Isometry tests with respective results are shown in Table 2. Look that right temporalis muscle shows significative difference from all parameters (Media, Pattern Deviation and Amplitude) when analyzed the numbers in FOA and Diagnosis periods.
It can be observed that these differences are always negative indicating that medium values and variability are always bigger on T1. Other difference is on left temporalis muscle: difference signal between true medias from T3 and T1, showing media from T3 significantly bigger than T1.
3.1. Pared data tests – equilibrium medias
A second process evaluated equilibrium alterations on muscular activities. Tests are the same, but this time alterations on differences are evaluated on same muscles of same sides. Equilibrated activities result on muscles with approximated values, with media 0 for differences, what is no differences to activities observed on both sides.
It can be observed that there are no detection of equilibrium variation between phases for masseter. Temporalis muscle appear most altered because there are signals of differences on amplitude When are evaluated equilibrium on Diagnosis and FOA phases and on pattern-deviation when analyzed variations of FOA and Diagnosis, and on pattern deviation when analised variations from FOA / Diagnosis and DA/Diagnosis. Look that only in the last are positive value for difference medias indicating bigger media on DA phase. In all other observations are major variance on Diagnosis phase than another.
In Table 3, signs of differences between real medias from parameter from temporalis muscle are saw on T1 related to T2. Negative media show bigger media on T1. It is analyzed parameters comparison on rest phase where there was no statistically significant difference between comparison electric signals of equilibrium media from T1, T2 and T3. With all of these, it´s not possible conclude for significative differences between medias, what suggests profounder studies.
Initially, must consider that any test needs control levels to from data acquisition, but this, many times, do not permit develop experiments on classic form.in this case specifically, where conditions are very well stablished form facial types, different kind of malocclusions, pathology nature, therapeutic resources utilized, an uniformization probably will take a conclusions generalization, and need an enormous number of patients to attend necessities of statistic tests.
It´s because of these that suggests data analysis with multivariate statistic that permits comparison with more than one variable, that´s it is giving more information to decision, obtaining results more trustable and an explanation for different results observed.
Groupment analysis were conducted to find specific results: equilibrium from supra-hyoidis in deglutition, masseters in isometrics and temporalis in rest.
Groupments were formed by side on each research phase. Relatory of groupment analysis were shown and comented next.
Table 3Supposition study and comparison of significant medias at 5 % significance level for more powerful pared data during isometry
Variable | H0: normal | Asymmetry | Statistical test | Statistic H0: = 0 | Value |
eq-am-aof-dia-m | 0,00520 | –2,12209 | Signal test | 0,0000 | 1.00000 |
eq-qm-qof-dia-s | 0,00033 | –2,59021 | Signal test | –2,0000 | 0,34375 |
eq-am-aof-dia-t | 0,46232 | –0,64320 | Student´s T test | –1,8096 | 0,10380 |
eq-am-da-aof-s | 0,00054 | 2,52508 | Signal test | –2,0000 | 0,34375 |
eq-am-da-aof-s | 0,11273 | 1,28157 | Student´s T test | 1,6525 | 0,13283 |
eq-am-da-aof-t | 0,75867 | 0,09984 | Student´s T test | 1,0018 | 0,34260 |
eq-am-da-dia-m | 0,02831 | –1,12787 | Signalated Orders Test | –10,5000 | 0,32227 |
eq-am-da-dia-s | 0,00435 | –0,195955 | Signalated Orders Test | 0,5000 | 1,00000 |
eq-am-da-dia-t | 0,04680 | –1,50551 | Signalated Orders Test | 4,5000 | 0,69531 |
eq-dp-aof-dia-m | 0,00494 | –0,195503 | Signalated Orders Test | –10,5000 | 0,32227 |
eq-dp-aof-dia-s | 0,00867 | –1,15858 | Signalated Orders Test | –1,5000 | 0,92188 |
eq-dp-aof-dia-t | 0,00012 | –2,58704 | Signalated Orders Test | –1,0000 | 0,75391 |
eq-dp-da-aof-m | 0,35500 | –0,37245 | Student´s T test | –1,3488 | 0,21035 |
eq-dp-da-aof-s | 0,00484 | 1,81902 | Signalated Orders Test | 13,5000 | 0,19336 |
eq-dp-da-aof-t | 0,83117 | –0,27241 | Student´s T test | 1,1342 | 0,28603 |
eq-dp-da-dia-m | 0,00009 | –2,75094 | Signal Test | –2,0000 | 0,34375 |
eq-dp-da-dia-s | 0,01428 | 1,67658 | Signalated Orders Test | 6,5000 | 0,55664 |
eq-dp-da-dia-t | 0,04346 | –1,61954 | Signalated Orders Test | 3,5000 | 0,76953 |
eq-me-aof-dia-m | 0,17822 | –0,50132 | Student´s T test | –1,3410 | 0,21278 |
eq-me-aof-dia-s | 0,62037 | 0,52186 | Student´s T test | 0,3294 | 0,74939 |
eq-me-aof-dia-t | 0,34664 | –1,00801 | Student´s T test | –3,1715 | 0,01134 |
eq-me-da-aof-m | 0,00098 | 2,35308 | Signal Test | –2,0000 | 0,34375 |
eq-me-da-aof-s | 0,00533 | 1,23058 | Signalated Orders Test | 6,5000 | 0,55664 |
eq-me-da-aof-t | 0,99553 | –0,24404 | Student´s T test | 1,5346 | 0,15926 |
eq-me-da-dia-m | 0,02928 | 1,09006 | Signalated orders Test | –9,5000 | 0,37500 |
eq-me-da-dia-s | 0,00950 | 1,39390 | Signalated orders Test | 3,5000 | 0,76953 |
eq-me-da-dia-t | 0,41565 | –0,92919 | Student´s T test | 0,5036 | 0,62662 |
3.2. Equilibrium on T1 groupment analysis next refers to diagnosis phase
Initially it´s possible see trough self-values of covariance matrix (Table 4), a strong association between masseters, temporalis and suprahyoid equilibrium, because with only one principal component it´s possible represent 96,57 % of all variations observed on three variables.
With two main components it explained 99 % of variability. Now lets understand groupment history that can be synthetized on next dendrogram as follows.
Table 4Self-evaluators of covariance matrix. Groupment history. NormRMS
Dist | PST2 | Union of groups | Union of groups | Freq |
0,0618 | 9 | 04-II-141 | 02-II-135 | 2 |
0,1076 | 8 | CL9/3.7 | 06-II-142 | 3 |
0,1248 | 7 | 3-II-140 | 06-II-156 | 2 |
0,1768 | 6 | CL8/4,7 | 05-II-160 | 4 |
0,2252 | 5 | CL7/ 4,0 | 05-II-163 | 3 |
0.3941 | 4 | 16,7 | 7 | |
0.4179 | 3 | CL4/2,3 | 05-II-146 | 8 |
0,8943 | 2 | 04-II159/ 11,2 | CL3 | 9 |
1,9798 | 1 | CL2/25,3 | 04-II-161 | 10 |
3.3. Equilibrium in T2 groupment analysis it´s pertinent to T2 phase
Results of groupment analysis can be resumed observing dendogram above. This analysis show that pseudo-t2 statistic don’t show a peak, that is characteristic of cut because all values are crescents. In this case is suggested adopt cut distance 0,2914 that is last union of two patients that are not in any group.
Table 5Self-evaluators of covariance matrix
Self-value | Diference | Proportion | Accumulated | |
1 | 996.093357 | 974.152085 | 0,9748 | 0,9748 |
2 | 21.941272 | 18,118859 | 0,0215 | 0,9963 |
Table 6Groupment history NormRMS
Dist | PST2 | Group Union | Group Union | Freq |
0.046 | 9 | 04-II-141 | 02-II-135 | 2 |
0.091 | 8 | 03-II-140 | 05-II-146 | 3 |
0.093 | 7 | CL9 | 05-II-160 | 2 |
0.114 | 6 | 05-II-163 | 06-II-142 | 4 |
0.164 | 5 | CL7 | CL8 | 3 |
0.263 | 4 | CL5 | CL6 | 7 |
0.291 | 3 | 04-II-159 | 04-II-161 | 8 |
0.536 | 2 | CL4 | 06-II-156 | 9 |
1.620 | 1 | Cl3 | Cl2 | 10 |
4. Discussion
Acceptable is to any malocclusions treatments have a deal, an objective, something concrete. The D.A. announced by Planas on first time for decades ago, shows a different way to obtain results and understand stomatognathic system and its functions, especially mastication. But this kind of postulate need for some researchers, investigations with scientific method, and publications. This is a final part of our investigation started with some case reports, methodology tests, Ambiental and laboratory installations, materials. Is D.A. an adequate deal for malocclusions treatments with FOA? With D.A. muscles involved obtain bilaterally balance? Some care were used (registration form rest until rest, no uses of Normalization, use best materials, sEMG registration obtained bilaterally, lab isolated to electromagnetic influences). Some investigations made years ago, suffered with analogic signals and analysis: Ahlgren, Ingervall and Thilander [4] studied and compared electromyographic activity from temporalis, masseter and orbicularis oris from patients with normal occlusion and with malocclusion Class II on rest, mastication and deglutition. Concluded that there are no differences in rest position between groups. There are agree on conclusion verified EMG activities differences in bilateral registrations, the results published by Moyers [5], Pruzanski [6], Quirch [7], Moss [8], Deguchi et al. [9], Gerstner et al [10], Palomari-Tobo et al [11]. It´s understood that these differences show us muscular function executed by different ways between right and left sides. Our data showed bigger Amplitudes, Pattern-Deviation and Media on isometric situation in Masseter on side of Minimal Vertical Dimension (MVD) [1,2] and anterior part Temporalis of opposite side (contralateral). These variations are according Planas’s affirmations [2] based on clinical observations. On the other hand, the findings are according to reported by Jarabak [12]; Pancherz and Anehuis [13]; Carels and van Steenberghe [14]; Mushimoto and Mitani [15]; Okeson [16] showing muscular adaptation to stomatognathic system changes.
Following ISEK and SENIAM orientations, with digital registrations and analysis gave to sEMG an higher scientific status. Level and number of scientific publications actually are higher than never; and because of it were assumed these cares. Results obtained and analyzed by some statistical tests and analysis gave consistency to these finds. And this research was not limited to results of a technique: some different appliances were used to these treatments, all of them FOA applied according to patients’ necessities; status of Stomatognathic System across and at the end of treatment are fundamental [1, 2]. Because of all of these, optioned to publish this investigation with all data, analysis, report (statistical), based on idea to stimulate other investigations. Electromyography is a seductive muse because it provides easy access, in detriment, electromyography is too easy to use and consequently too easy to abuse De Luca [17].
5. Conclusions
In D.A. were found a bilateral equilibrium of sEMG registration of the studied muscles, due to a homogenization of bilateral muscle analyzed results,
In D.A. were found a diminishing the sEMG registration in Amplitude, Pattern Deviation and Media, in all situation and moments, giving validation to D.A. as a treatment objective.
sEMG is a trustable tool to analyze masticatory muscles function for Diagnosis, Treatment and evaluation post treatment/ gained objective.
References
-
P. Planas, Genesis De La Rehabilitación Neuro-Oclusal. (in Spanish), Mexico: Ed. San Luiz, 1961.
-
P. Planas, Rehabilitación Neuro-Oclusal. (in Spanish), Barcelona: Ediciones Cientificas y Tecnias, 1994.
-
W. A. Simões, Ortopedia Funzionale Dei Mascellari Attraverso La Riabilitazione Neuro-Occlusale. (in Italian), Trestina: Nike Srl, 2010.
-
J. Ahlgren, B. F. Ingervall, and B. L. Thilander, “Muscle activity in normal and postnormal occlusion,” American Journal of Orthodontics, Vol. 64, No. 5, pp. 445–456, 1973.
-
R. E. Moyers, “Temporomandibular muscle contraction patterns in Angle Class II division 1 malocclusion: An electromyographic analysis,” American Journal of Orthodontics, Vol. 35, No. 7, pp. 837–857, 1949.
-
S. Pruzanski, “The application of electromyography to dental research,” The Journal of the American Dental Association, Vol. 44, pp. 245–256, 1976.
-
J. S. Quirch, “Interpretación de registros electromiográficos em relación con la oclusión,” (in Spanish), Journal of the Argentine Dental Association, Vol. 53, No. 9, pp. 307–312, 1965.
-
J. P. Moss, “An electromyographic investigation of certain muscle activities associated with malocclusion of teeth,” American Journal of Orthodontics, Vol. 67, No. 6, pp. 625–646, 1975.
-
T. Deguchi, T. Kumai, and L. Garetto, “Statistics of differential Lissajous EMG for normal occlusion and Class II malocclusion,” American Journal of Orthodontics and Dentofacial Orthopedics, Vol. 105, No. 1, pp. 42–48, 1994.
-
G. E. Gerstner, F. Marchi, and H. Haerian, “Relationship between anteroposterior maxillomandibular morphology and masticatory jaw movements patterns,” American Journal of Orthodontics and Dentofacial Orthopedics, Vol. 115, No. 3, pp. 258–266, 1999.
-
E. T. Palomari-Tobo, M. Vitti, and S. P. Barros, “Eletromiografia do músculo masseter em casos de oclusão normal e maloclusão Classe I,” (in Portuguese), Journal of the São Paulo Association of Dental Surgeons, Vol. 50, No. 1, pp. 25–30, 1996.
-
J. Jarabak, “The adaptability of the temporal and masseter muscles; and electromyographical study,” Angle Orthodontist, Vol. 24, No. 4, pp. 293–213, 1954.
-
H. Pancherz and M. Anehuis, “Masticatory’ function after activator treatment,” Acta Odontologica Scandinavica, Vol. 36, No. 5, pp. 309–316, 1978.
-
C. Carels and M. D. van Steeenberghe, “Changes in neuromuscular reflexes in the masseter muscle during functional jaw orthopedic treatment in children,” American Journal of Orthodontics and Dentofacial Orthopedics, Vol. 90, No. 5, pp. 410–419, 1986.
-
E. Mushimoto and H. Mitani, “Bilateral coordination pattern of masticatory muscle activities during chewing in normal subjects,” The Journal of Prosthetic Dentistry, Vol. 48, No. 2, pp. 191–197, 1982.
-
J. P. Okeson, Tratamento das desordens Temporomandibulares e Oclusão e. (in Portuguese), São Paulo: Artes Médicas, 2008.
-
C. J. de Luca, “The use of surface electromyography in biomechanics,” Journal of Applied Biomechanics, Vol. 13, No. 2, pp. 135–163, 1997.
About this article

The authors have not disclosed any funding.
The datasets generated during and/or analyzed during the current study are available from the corresponding author on reasonable request.
Eduardo Sakai: conceptualization, investigation, project management, supervision, methodology, writing-original draft preparation. Luciano Wagner Ribeiro: methodology, investigation. Orlando Santiago Junior: visualization, writing review and editing. Sergio Polizio Terçarolli: methodology, investigation. Jordanna Guedes Amorim: investigation, writing-original draft preparation.
The authors declare that they have no conflict of interest.
The research met all applicable standards for the ethics of experimentation. Permit to perform biomedical investigation was granted by Research in Humans Ethics Committee of Universidade Estadual de Campinas (UNICAMP), Piracicaba, Brazil under protocol 159/2004. Participants provided written informed consent prior to the experiment
