Abstract
This paper analyzes the flow uniformity based on the parallel pipe group model with an axial inlet. This paper is mainly based on the FLUENT fluid simulation module in ANSYS WORKBENCH, numerical simulation analysis of the established parallel pipe group model, and the law of uniformity of flow distribution under different mass flow conditions is obtained. The diameter of the main intake pipe of the parallel pipe group and the interval length of the branch intake pipes are changed. Under a large number of simulation conditions, the law of uniformity of flow distribution under different conditions is explored.
Highlights
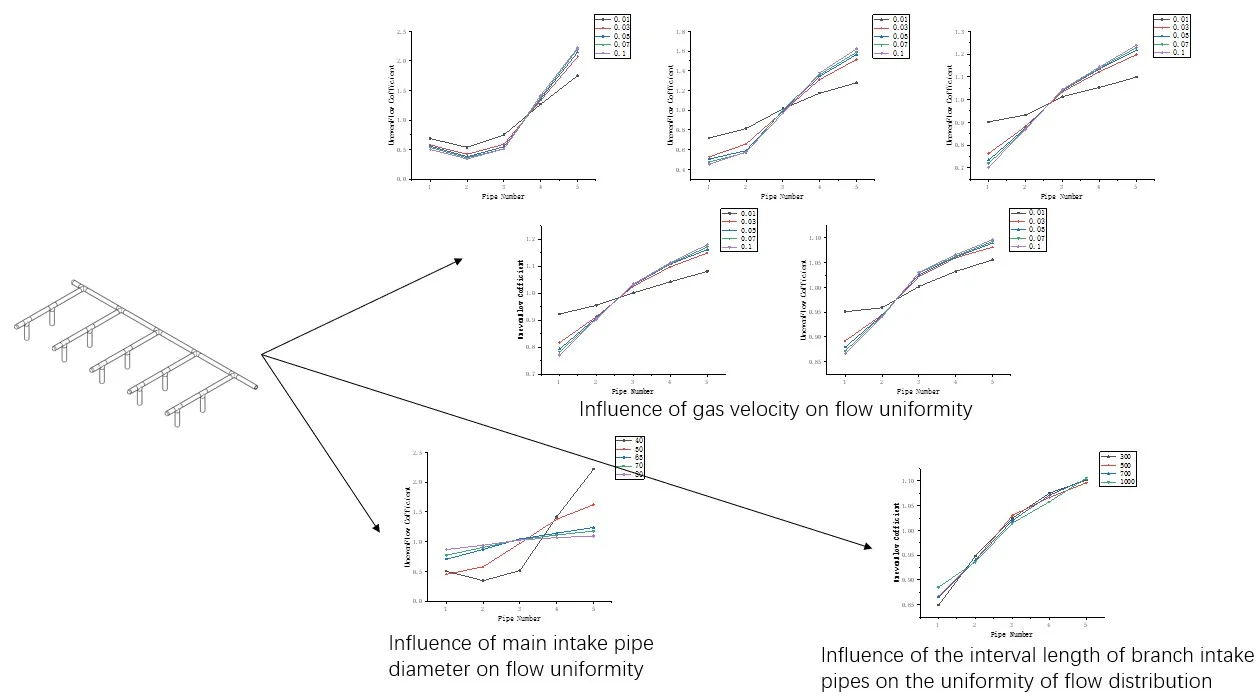
- When the diameter of the inlet port is constant, the greater the gas flow rate, the more uneven the flow distribution
- Under the condition that the diameter of the outlet pipe remains unchanged, the larger the diameter of the main inlet pipe, the more even the flow distribution. Compared with the condition of the same mass flow and small pipe diameter, the gap between the maximum flow unevenness coefficient and the minimum flow unevenness coefficient is reduced
- The interval length of the branch intake pipe has a small influence on the flow distribution, and this factor can be ignored in the engineering
- Increasing the diameter of the main air inlet pipe and reducing the flow rate of the air inlet can improve the uniformity of flow distribution
1. Introduction
Parallel tube groups with axial inlets are widely used in engineering, and are generally used in heat exchangers, collectors in solar-related systems [1], boiler tube groups, etc., where uniform flow distribution is required or uniform heat exchange is required. These parallel pipe groups are generally composed of distribution headers, branch pipes and collection boxes [2]. The various performances (economy, safety, vibration and noise, etc.) during its operation depend to a large extent on the uniformity of the flow distribution of the fluid medium in the piping system [3]. However, due to the inherent characteristics of the pipeline structure and the complexity of fluid flow, the flow distribution of each parallel branch pipe is not uniform [3], which will affect the vibration performance of the parallel pipe group and the entire system to a certain extent. Therefore, it is very necessary to study the flow uniformity of parallel pipe groups.
The object of this paper is the purge air path that requires uniformity of flow distribution, the flowing medium is air, and there is no heat exchange. In this article, by changing the model several times and conducting a large number of simulation experiments, the law of uniformity of flow distribution of parallel pipe groups is analyzed under certain conditions.
2. Model and simulation method
2.1. Model and meshing
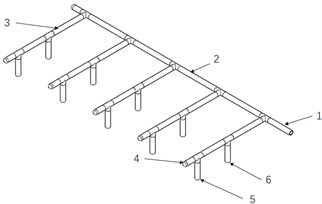
The purge gas path is generally welded by pipes and pipe fittings, so there are a large number of pipe fittings, meters, valves, etc. in the piping system [4]. In order to simplify the calculation model and reduce the amount of calculation, the model is simplified to a certain extent under the premise of not affecting the simulation experiment, and reserved for the tee and pipe caps used for connection in the pipeline system. The simplified model is shown in Fig. 1. The inner diameter of the pipe is 40 mm, the wall thickness is 4 mm, the length of the main air inlet pipe is 2990 mm, and the length of the branch air inlet pipe is 1115 mm. There are 5 branch air inlet pipes and 10 outlets.
Number the branch intake pipes from lower right to upper left, and number the intake ports from close to far away from the main intake pipe, such as: branch intake pipe 1, branch intake pipe 2..., outlet 1, outlet 2.... After extracting the fluid domain, the model is imported into Mesh for mesh division. The mesh size is 4mm. After the division is completed, the number of meshes is 287861 and the number of nodes is 1393041.
Fig. 1Simplified pipeline model: 1 – inlet; 2 – inlet manifold; 3 – branch inlet pipe; 4 – pipe cap; 5 – outlet 2; 6 – outlet 1
2.2. Model hypothesis and boundary condition setting
In order to simplify the boundary conditions of the calculation model, make the calculation simpler and save calculation time, the following assumptions are made for the calculation process:
1. In the calculation process, the speed is always less than 0.3 times the Mach number, and the fluid is Newtonian fluid;
2. There is no heat exchange during the calculation process, the default value is the calculated temperature of the model;
3. Except for local pipe fittings, the friction coefficients are equal throughout the pipeline, which is constant during the calculation process;
4. The diameter of the air inlet is the same as that of the main air inlet pipe, the diameter of each branch air inlet pipe is the same, and the diameter of each air outlet is the same [5].
Boundary condition setting:
1. Inlet boundary condition.
In this numerical simulation, it is necessary to adjust the inlet conditions of the pipeline several times. In order to make the simulation more suitable for the flow control method used in actual engineering, the inlet boundary condition is Mass-Flow-inlet, and the fluid direction is perpendicular to the radial direction of the pipeline.
2. Outlet boundary.
The outlet boundary condition selects the default pressure boundary condition: set the outlet pressure to 1000Pa.
3. Wall boundary [6].
The wall of the pipe adopts a non-slip wall boundary condition, that is, the air velocity at the wall of the pipe is 0.
4. Calculation model.
The turbulence calculation model adopts the Standard - model [7], the calculation method adopts Simple, Green-Gauss Node Based, Standard initialization, and other setting conditions adopt the default setting. Monitor any outlet flow value. When the outlet flow reaches a stable value, the default calculation converges and the calculation ends. Record the flow value of each outlet at this time.
Governing equation of Standard - model [8]:
3. Simulation results and analysis of results
3.1. The evaluation criteria of the results
Define the non-dimensional flow unevenness coefficient as the ratio of the mass flow of each branch of the intake pipe to the average value of the mass flow of each branch of the intake pipe, which can be expressed as follows:
3.2. Influence of gas velocity on the uniformity of flow distribution
In order to explore the influence of gas flow rate on the uniformity of flow distribution, the method of mass flow control is used to control the change of gas flow rate. When the model, gas density, and pipe cross-sectional area remain unchanged, the change in mass flow rate is manifested as the change in gas flow rate.
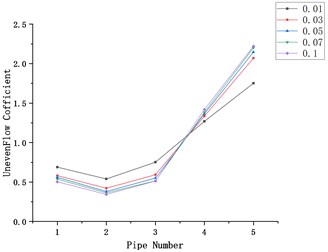
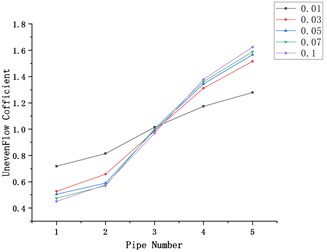
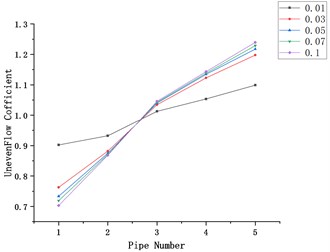
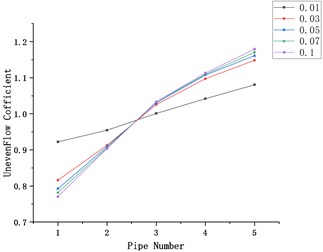
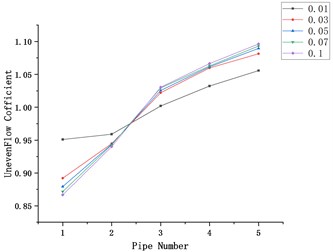
Fig. 2Influence of gas velocity on flow uniformity
a)
b)
c)
d)
e)
Take five types of intake air mass flow as 0.01, 0.03, 0.05, 0.07, 0.1 (kg/s), take the branch intake pipe number as the abscissa, and the flow unevenness coefficient as the ordinate to draw the graph, and explore the unevenness of the gas velocity to the flow. The influence of the law of sexual change.
In Fig. 2, (a-e) represent the models with the diameters of the main intake ducts of 40, 50, 65, 70, and 80 (mm), respectively. The mass flow rate is 0.01, 0.03, 0.05, 0.07, and 0.1 (kg/s). Under the condition of flow distribution uneven coefficient changes with flow.
It can be seen from the figure that no matter how the diameter of the main intake pipe changes, the uneven flow distribution coefficient increases with the increase in flow. The branch intake pipe 1 has the smallest flow distribution uneven coefficient, and the branch intake pipe 5 has the smallest flow distribution coefficient. The coefficient of uneven distribution is the largest, and the coefficient of uneven distribution of flow is similar under different flow conditions.
When the flow rate is 0.01 (kg/s), that is, when the speed is the minimum, the maximum flow distribution unevenness coefficient and the minimum flow distribution unevenness coefficient are the minimum values under these five flow conditions. The relationship between this law and the diameter change is not obvious.
3.3. Influence of different main intake pipe diameters on the uniformity of flow distribution
Take the diameter of the main air inlet pipe as 40, 50, 65, 70, 80 (mm), and the mass flow rate as 0.1 (kg/s). Take the branch air inlet pipe number as the abscissa and the flow unevenness coefficient as the ordinate to draw the graph. To explore the influence of different main intake pipes on the variation of flow unevenness.
Fig. 3Influence of main intake pipe diameter on flow uniformity
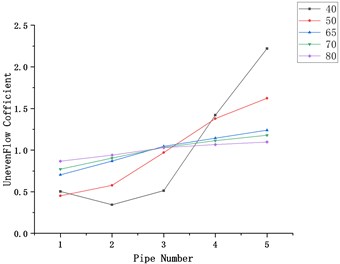
Fig. 3 shows the variation of the coefficient of uneven flow distribution under different main intake pipe diameters when the mass flow is 0.1 (kg/s).
It can be seen from the curve in the figure that as the diameter of the pipe increases, the flow distribution becomes more uniform. When the diameter of the main intake pipe is 80 mm, the flow of the five pipes can be distributed evenly. When the diameter of the main intake pipe is 40 mm, the maximum flow distribution unevenness coefficient is about 8 times the minimum flow distribution unevenness coefficient, and this multiple decreases as the diameter of the pipe increases.
3.4. Influence of the interval length of different branch intake pipes on the uniformity of flow distribution
Take the length of the main intake pipe 300, 500, 800, 1000 (mm), the mass flow rate is 0.1 (kg/s), take the branch intake pipe number as the abscissa, and the flow unevenness coefficient as the ordinate as the graph, explore the difference The influence of the interval of branch intake pipes on the variation law of flow unevenness.
Fig. 4Influence of the interval length of branch intake pipes on the uniformity of flow distribution
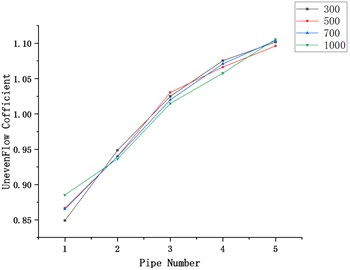
Fig. 4 shows the influence of the change in the length of the main intake pipe on the uniformity of flow distribution when the mass flow is 0.1 (kg/s) and the diameter of the main intake pipe is 80 mm.
It can be seen from the curve in the figure that the interval length of the branch intake pipes does not have a great influence on the uniformity of flow distribution, and the interval lengths of different branch intake pipes show the same changing law. The unevenness of flow distribution has not been improved as the length of the pipe increases. The uneven coefficient of maximum flow distribution is about 1.25 times the coefficient of uneven distribution of the minimum flow, which can basically realize the uniform flow distribution of the five pipes.
4. Conclusions
Based on the above data analysis, the following conclusions can be drawn:
1. When the diameter of the inlet port is constant, the greater the gas flow rate, the more uneven the flow distribution.
2. Under the condition that the diameter of the outlet pipe remains unchanged, the larger the diameter of the main inlet pipe, the more even the flow distribution. Compared with the condition of the same mass flow and small pipe diameter, the gap between the maximum flow unevenness coefficient and the minimum flow unevenness coefficient is reduced.
3. The interval length of the branch intake pipe has a small influence on the flow distribution, and this factor can be ignored in the engineering.
4. Increasing the diameter of the main air inlet pipe and reducing the flow rate of the air inlet can improve the uniformity of flow distribution.
References
-
H. G. Wang and Y. Liu, “The hydrodynamic propulsion algorithm of the parallel pipe group of the L-shaped header system,” (in Chinese), Journal of University of Shanghai for Science and Technology, No. 6, pp. 494–497, 2005.
-
Q. L. Gao and J. F. Xu, “Research on the flow distribution characteristics of the radial header system with multiple parallel branch pipes,” (in Chinese), Journal of Xi’an Technological University, No. 8, pp. 635–641, 2015.
-
J. He, “Numerical research on flow distribution mechanism and algorithm of multi-branch parallel pipes,” (in Chinese), Lanzhou Jiaotong University, 2014.
-
Y. Y. Zhang, H. P. Fu, H. Xiong, and Q. A. Song, “Analysis of fitting standards for oil and gas gathering and long-distance pipeline engineering,” (in Chinese), Natural Gas and Petroleum, No. 1, pp. 80–83, 2014.
-
R. L. Zhang and Y. H. Fang, “Analysis of flow uniformity of parallel tube group model,” (in Chinese), Journal of Tianjing University of Science and Technology, Vol. 22, No. 4, pp. 45–48, 2007.
-
M. H. Hosni, H. W. Coleman, and R. P. Taylor, “Measurement and calculation of fluid dynamic characteristics of rough-wall turbulent boundary-layer flows,” Journal of Fluids Engineering, Vol. 115, No. 3, pp. 383–388, Sep. 1993, https://doi.org/10.1115/1.2910150
-
T. Defraeye, B. Blocken, and J. Carmeliet, “CFD analysis of convective heat transfer at the surfaces of a cube immersed in a turbulent boundary layer,” International Journal of Heat and Mass Transfer, Vol. 53, No. 1-3, pp. 297–308, Jan. 2010, https://doi.org/10.1016/j.ijheatmasstransfer.2009.09.029
-
M. P. Schwarz and W. J. Turner, “Applicability of the standard k-ϵ turbulence model to gas-stirred baths,” Applied Mathematical Modelling, Vol. 12, No. 3, pp. 273–279, Jun. 1988, https://doi.org/10.1016/0307-904x(88)90034-0
