Abstract
In recent years, the influence of earthquake on geotechnical engineering has been paid more and more attention, and the study of soil dynamic characteristics is the most important part. In order to reveal the dynamic characteristics of the silty clay in the reservoir area of the hydropower station, firstly many samples are taken for dry-wet cycle several times to simulate the changes of soil in the reservoir slope under the condition of reservoir water level change or rainfall evaporation. And then dynamic triaxial tests are carried out on those samples to determine the dynamic deformation development law of the soil. The model is established based on Gompertz curve, making it be applied to the deformation curve of soil dynamics. The dynamic deformation curve of samples after different times of dry-wet cycle is fitted. The error of fitting value and actual value is within 5 %, and the relationship between vibration frequency and dynamic strain is established. The research results have practical significance for the prediction of dynamic deformation of soil and the application of Gompertz curve.
1. Introduction
Soil dynamics is an indispensable part of soil mechanics research. Under the action of dynamic load, the strength, deformation characteristics and soil structure of soil will change in varying degrees. According to statistics, tens of thousands of earthquakes occur every day in the world. The landslide, surface subsidence and debris flow induced by earthquake are more serious than the damage caused by the earthquake itself, causing inestimable economic losses and casualties. On April 25, 2015, M8.1 earthquake in Nepal caused at least 7903 people dead [1]; on May 12, 2008, Wenchuan M8.0 earthquake killed 69227 people, 17923 disappeared, and the economic loss was about845 billion yuan [2].
The construction of underground engineering and frequent occurrence of geological disasters make earthquake disaster reduction become an indispensable part of the engineering construction, the key to engineering safety and the core problem of geotechnical engineering workers. For example, the study of soil dynamics in earthquake engineering and seismic problems [3-5]; the study of different soil and soil dynamic characteristics law of the improved soil [6, 7], both of them have great significance to practical engineering.
Gompertz is a curve derived and formulated by British mathematician Benjamin Gompertz. A large number of test data show that the stable curve and Gompertz curve in the soil dynamic deformation curve have a similar shape and development process. In this paper, the curve is applied to the development law of dynamic deformation of the soil through self-Test and previous experimental research, combined with Gompertz curve and the reasonable deduction of the curve.
2. The derivation and establishment of Gompertz model
2.1. Gompertz curve
Gompertz curve is originally used to describe the prediction of species number in nature and it is widely applied to the analysis of population growth control. Till now, its application scope is not limited to biological models. Practices show that Gompertz curve has been widely used in market forecasting [8], settlement in engineering [9, 10] and even traffic prediction.
Gompertz curve initially describes the relationship between population size and time; its basic form is, dydt=-Tylnyk. It can be solved from above equation, y=K(y0K)e-Tt. Generally, the end of the curve is written as y=Kabt.
Where, a=y0K, b=exp(-T), a and b are model parameters; y is the population size; K is the environmental capacity; y0 is thinitial population number, T is the growth coefficient of population, and e is natural constant.
2.2. Establishment and deduction of Gompertz model
The dynamic deformation curve of soil and Gompertz curve have similar development law. According to the practical significance of the dynamic deformation curve of soil and Gompertz curve, the Gompertz model applied to the dynamic deformation curve is derived as follows:
The relationship between the dynamic strain and cycle number (vibration times) of the soil was established by Gompertz model. Among them, εp is the dynamic strain of soil; K is the maximum dynamic strain of soil; N is the cycle number (vibration times), a and b are model parameters.
3. Test scheme and result
3.1. Test instrument
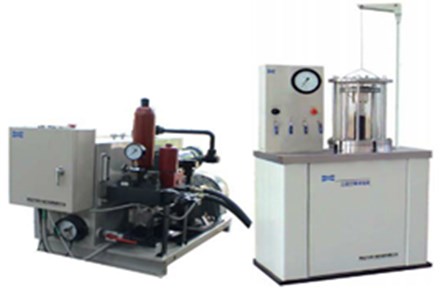
The test instrument adopts SDT-10 microcomputer controlled electro-hydraulic servo of soil dynamic triaxial test machine, and the instrument is composed of load control system, loading system and data acquisition system, detailed as axial loading mechanism and frame, confining pressure imposing mechanism, pressure chamber, pressure chamber lifting mechanism, hydraulic oil source, electrical control, microcomputer display, control and data processing.
Fig. 1SDT-10soil dynamic triaxial test machine with microcomputer control
3.2. Sample preparation and test scheme
The soil sample was taken from the excavation of the back edge of a landslide in the reservoir area of a hydropower station (shortened as Badong soil). The soil samples were yellowish and slightly expansive, and the main physical properties of the soil samples are shown in Table 1. Its plastic limit index Ip=16.88, silty clay, liquid limit index IL< 0, the soil in the natural state is a hard state.
Table 1The physical properties of test soil
Natural water content (%) | Natural density (g/cm3) | Dry density (g/cm3) | Void ratio e | Proportion Gs | Liquid- Limit WL (%) | Plastic limit WP (%) | Liquid limit index IL | Plastic limit index IP |
19.86 | 1.79 | 1.49 | 0.84 | 2.739 | 43.86 | 26.98 | –0.7 | 16.88 |
The sample takes three valves as mould and divided into four layers, and triaxial test samples are prepared using layered compaction method. The diameter is 61.8 mm and the height is 120 mm. After the sample is prepared, it is put into vacuum saturated cylinder and saturated by vacuum saturation method. Relevant studies have shown that the soil properties would experience irreversible changes after dry-wet cycles, reaching stable after five dry-wet cycles [12, 13]. The soil would experience several dry-wet cycles with the rise and fall of reservoir water level and climatic factors. In order to simulate the state, the saturated solid samples including saturated frame are dried in a constant temperature drying box, and the natural state temperature is set to 35 centigrade in order to simulate the natural state; control its water content change at about 10 % and then immerse in distilled water till to close to saturation. This process is a dry-wet cycle. For each sample, 0, 1, 3 and 6 dry-wet cycles were carried out respectively.
The prepared samples are used for isotropic consolidation test. Firstly, 10 kPa lateral pressure is added to the samples, and then equal lateral pressure σ3c and axial pressure σ1c, till equal lateral pressure σ3c and axial pressure σ1c are equal and reach setting pressure. Undrained dynamic test is carried out after consolidation test, the applied confining pressure of the test is 300 kPa; amplitude of dynamic stress is 150 kPa and 50 thousand cycle vibrations in all.
3.3. Test results and analysis
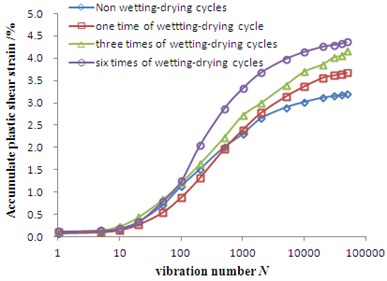
Fig. 2 is the dynamic deformation curve of Badong soil test. It is found that the dynamic deformation curve of Badong soil is stable under the conditions of 300 kPa confining pressure, 150 kPa amplitude of dynamic stress and different dry-wet cycles. When the loading and unloading cycles are less than 50 times, the soil dynamic strain changes little. When the loading and unloading times reach 50 times, the dynamic strain of soil increases sharply to about ten thousand times and then tends to be stable again. And then the increase of loading and unloading times has little effect on the dynamic strain of soil. At the same time, compared with the experimental curves under different dry-wet cycles, it is found that the dynamic strain has increasing trend with the increase of dry-wet cycles.
Fig. 2Relationship between accumulative plastic strain and vibration amplitude of Badong soil under different drying-wetting cycles
4. Validation of the model
The dynamic deformation curve of soil generally presents stable type, critical type and failure type. The morphological characteristics of stable curves are very similar to Gompertz curves. Based on this, two sets of test data including their own tests are selected for analysis and the dynamics deformation curves all select the stable curves.
4.1. Study on the dynamic deformation of Badongsilty clay using Gompertz model
It can be seen from Fig. 2 that the test curves of Badongsilty clay are all stable curves under the conditions of 300 kPa confining pressure, 150 kPa dynamic stress amplitude, 0, 1, 3 and 6 times of dry-wet cycle. Gompertz model can be used to fit the dynamic strain, and the confidence band range of the model at 95% confidence level is given. The results are shown in Fig. 3.
Fig. 3Fitting curves of measured data and predicted data under different dry-wet cycles in Badong soil
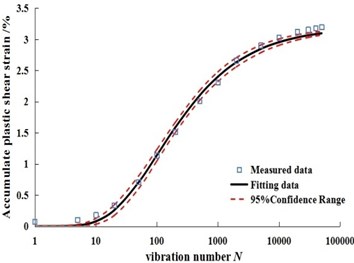
a) Zero time of dry-wet cycle sample
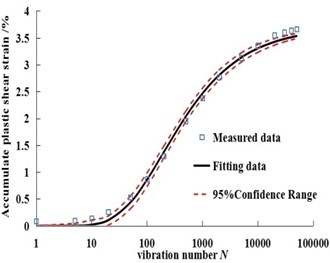
b) One time of dry-wet cycle sample
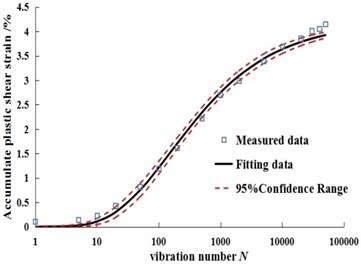
c) Three times of dry-wet cycle sample
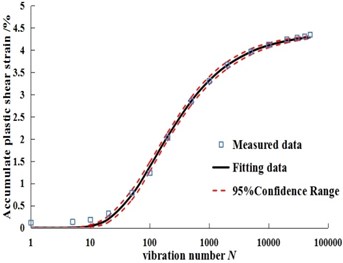
d) Six times of dry-wet cycle sample
4.2. Study on dynamic deformation of silty clay in Dalian using Gompertz model
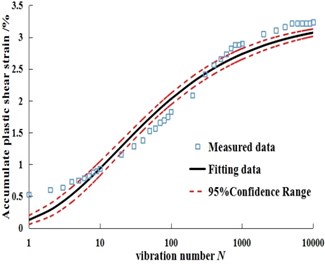
Liu Wenhua et al. [14] made soil dynamic test to the silty clay in Dalian. The confining pressure of saturated samples during the test was 50 kPa; the samples experienced zero and six time(s) of dry-wet cycle respectively and comparison test was carried out. The sample with zero time of dry-wet cycle selects the dynamic deformation curve with 100 kPa dynamic stress amplitude, and the sample with six times of dry-wet cycles selects the dynamic deformation curve with 110 kPa dynamic stress amplitude, and the two curves are both stable shown as Fig. 4. From the experimental data, it is found that the cumulative plastic strain of Dalian soil increases with the increase of loading and unloading times, and the cumulative plastic strain decreases with the increase of the number of dry-wet cycles.
Gompertz model is used to calculate the dynamic strain, and the confidence band range of the model at 95 % confidence level is given. The results are shown in Fig. 5.
Fig. 4Relation curves between cumulative plastic strain and vibration amplitude under different dry-wet cycles in Dalian soil
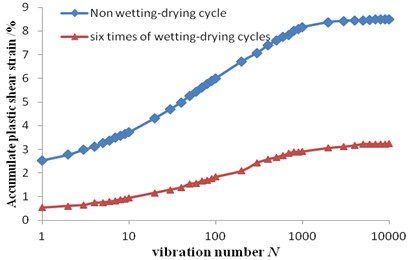
Fig. 5Fitting curves of measured data and predicted data under different dry-wet cycles in Dalian soil
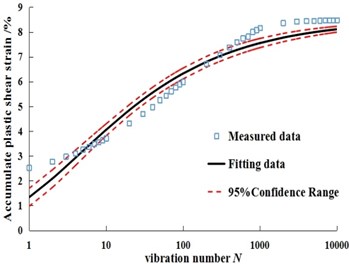
a) Original samples
b) Six times of dry-wet cycles samples
4.3. Application results and analysis of Gompertz model
The traditional dynamic strain curve is displayed in a constant coordinate. The commonly used model is found to be fitted by exponential function shown as [15]:
Comparatively, Gompertz model adds the factor of maximum dynamic strain, not only from the curve shape, but also from logarithmic coordinates to analyze the dynamic strain curve of soil, which can better reflect the relationship between dynamic strain and loading and unloading times. From the fitting results of Gompertz model for dynamic strain and the distribution state of confidence band in Fig. 3 and Fig. 5, the real value is basically within the 95 % confidence band of the fitting curve, which indicates that Gompertz model can better describe the evolution characteristics of dynamic strain and loading and unloading times under different dry wet cycles; At the same time, combined with the average absolute error (MAE) and mean square error(RMSE) of the two soils in Table 2, the two error indexes are less than 0.5, and Badong soil has the lowest error result. It shows that the discreteness of the model curve is low, the degree of deviation from the real value is very small, and the accuracy of the model is high. The curve fitting parameters and fitting degree are shown in Table 2.
5. Conclusions
1) The Gompertz model can be used to predict the dynamic deformation curve of the fitting stable type. The prediction value and the actual value are also more consistent. Compared with the common model, the model from the purely mathematical point of view has more physical meaning, and a new idea for the study of the development of soil dynamic deformation is put forward.
Table 2Fitting parameters and fitting results
Species of soil | Times of dry-wet cycles | Parameter | MAE | RMSE | Correlation coefficient r | |
a | b | |||||
Badong soil | 0 | 1.66E-6 | –1.277 | 0.0726 | 0.0786 | 0.997 |
Badong soil | 1 | 6.86E-9 | –1.276 | 0.0876 | 0.0949 | 0.995 |
Badong soil | 3 | 2.24E-5 | –1.075 | 0.1018 | 0.1140 | 0.989 |
Badong soil | 6 | 2.91E-9 | –1.411 | 0.0628 | 0.0812 | 0.998 |
Dalian soil | 0 | 0.156 | –0.916 | 0.4064 | 0.4586 | 0.978 |
Dalian soil | 6 | 0.038 | -0.952 | 0.1685 | 0.1871 | 0.983 |
2) Compared with the dry and wet cycle of Badong soil and Dalian soil, one has the trend that dynamic deformation increases and the other is opposite, which mainly depends on who would occupy a dominant for irreversible variable and development of the fracture. The Gompertz model can also be used for fitting the samples after dry-wet cycles.
3) There are many unsolved problems in the study of soil dynamics. Different soil, different initial state and different test conditions will affect the final test results. The parameters a and b may be related to test conditions and soil types. Due to the limited test conditions and data, the conditions for the two parameters to be determined depend on what conditions need to be verified. The Gompertz model can also be perfected to make its application wider.
References
-
Hu G. S., Chen L. S., Shu P. C., et al. Secondary mountain disasters and countermeasures for disaster prevention and mitigation in Nielamu, Tibet, Nepal at 4.25. Journal of Natural Disasters, Vol. 25, Issue 4, 2016, p. 70-75.
-
Huang R. Q., Li W. L. Wenchuan earthquake triggered landslides, landslides, quantitative density characteristics, geological disasters and environmental protection. September, Vol. 3, Issue 12, 2009, p. 1-7.
-
Cai Y. Q., Yu Y. Z., Yuan X. M., et al. Soil dynamics and Geotechnical Earthquake Engineering. China Civil Engineering Journal, Vol. 49, Issue 5, 2016, p. 9-30.
-
Liu H. L. Review of advances in soil dynamics and geotechnical seismic research. China Civil Engineering Journal, Vol. 45, Issue 4, 2012, p. 148-164.
-
Du X. L., Lu D. C. Advances in soil dynamics and geotechnical earthquake engineering. Geotechnical Mechanics, Vol. 32, 2011, p. 10-20.
-
Zhao M. L., Wang J. H., Liang A. H. Experimental study on the influence of wetting and drying cycles on fatigue strength of cement stabilized soil. Chinese Journal of Railway Science, Vol. 26, Issue 2, 2005, p. 25-28.
-
Li L. H., Xiao H. L., Tang H. M., et al. Experimental study on influence law of dynamic characteristics parameters of tire particle mixture. Geotechnical Mechanics, Vol. 35, Issue 2, 2014, p. 359-364.
-
Zhao H. M. Mid and long term prediction of China’s 1000 car ownership based on Gompertz curve model. Industrial Technology Economy, Vol. 7, 2012, p. 7-23.
-
Zhang Y. T., Sun H., Wang J. X. Application of Gompertz curve model to prediction of settlement of soft soil foundation of seawall. Journal of Waterway and Harbor, Vol. 30, Issue 4, 2009, p. 257-276.
-
Yu C., Liu S. Y. Application of Gompertz model to prediction of embankment settlement. Geotechnical Mechanics, Vol. 26, Issue 1, 2005, p. 82-86.
-
Dan C., Dan Y. S., Zhao Y. D. Improved Gompertz model and its application in traffic prediction. Science and Technology Review, Vol. 27, Issue 18, 2009, p. 82-85.
-
Guan G. S., Rahardjo Choon H. L. E. Shear strength equations for unsaturated soil under drying and wetting. Journal of Geotechnical and Geoenvironmental Engineering, Vol. 136, Issue 4, 2010, p. 594-606.
-
Zhang R., Yang H. P., Zheng J. L. The effect of vertical pressure on the deformation and strength of expansive soil during cyclic wetting and drying. Proceedings of the 4th International Conference on Unsaturated Soils, Arizona, 2006, p. 894-905.
-
Liu W. H., Yang Q., Tang X. W., et al. Experimental study on dynamic characteristics of silty clay under cyclic loading under cyclic wetting and drying conditions. Journal of Hydraulic Engineering, Vol. 46, Issue 4, 2015, p. 425-432.
-
Monismith C. L., Ogawa N., Freeme C. R. Permanent deformation characteristics of subgrade soils due to repeated loading. Transport Research Record, Vol. 537, 1975, p. 1-17.

