Abstract
An earthquake is a natural disaster with a high destructive force. According to previous history, a great many power grid facilities are damaged during the earthquake, and the damage to electrical equipment in substations are often very serious. This article takes the isolating switch in the substation as an experimental object. Firstly, the friction pendulum for vibration isolation is designed and manufactured according to the numerical simulation, and then the seismic test and vibration isolation test of the high voltage isolating switch are designed. The input waveforms and input acceleration intensities of the seismic test were designed experimentally. The test data of the isolating switch under the seismic condition and the vibration isolation condition with the friction pendulum vibration isolation system installed are mainly investigated. The measured acceleration of the top of the isolating switch bracket is used to compare and analyze the vibration isolation performance of the friction pendulum. Then, it can be seen that the friction pendulum system has the vibration isolation effects on the isolating switch. Especially, the isolation effects of friction pendulum are better when the acceleration intensity become higher. In order to obtain a better curvature radius and friction coefficient of the friction pendulum, based on the results of this test, the systematically numerical simulation tests for optimization on the friction pendulum vibration isolation system are conducted. The simulated top displacement of the isolating switch and the stress change of the root of the porcelain bottle were obtained. By comparing the vibration isolating performance of the friction pendulum under different parameters, numerical simulations show that the vibration isolation performance of the friction pendulum is better when the radius of curvature is 1200 mm and the friction coefficient is 0.04. The numerical results demonstrate that reasonable design of friction pendulum parameters can play a significant role in isolating vibration for power equipment.
1. Introduction
Earthquakes are natural disasters with great destructive power, and they cause great damages to substations in the power grid. Electrical equipment in substations is vulnerable to damage in earthquakes. Once severe damage to electrical equipment causes power system interruptions, it will cause unpredictable losses to industry production and human lives. It will also bring many difficulties to disaster relief and post-disaster reconstruction. Therefore, in order to prevent electrical equipment from being damaged in an earthquake, the electrical equipment should be designed for vibration reduction and isolation to ensure that it can still function normally in the event of a major earthquake. Among them, the friction pendulum vibration isolation equipment has been used in various projects and achieved success [1], which verified the feasibility and feasibility of the friction pendulum vibration isolation support.
The friction pendulum vibration isolation system was originally proposed by the American scholar Dr. Victor. Zays, and other researchers around the world have begun to apply the friction pendulum vibration isolation system to the vibration isolation and vibration reduction of various projects. The main application areas are bridges [2], transportation [3], and buildings [4]. For example, Saha A. [5] takes the Southern California 91/5 highway overpass as the research object and study passive polynomial friction pendulum vibration isolation. Response of reference highway bridges with vibration isolation (PFPIs). Zhang Ruifa [6] used the multi-friction pendulum system (MFPS) to analyze the seismic response of an isolated vertical cylindrical large liquefied natural gas (LNG) storage tank, and proposed an ultra-large liquefied natural gas storage tank isolated by the MFPS tank. Castaldo P. [7] used a two-degree-of-freedom model considering the flexibility of the superstructure to analyze the seismic reliability of the friction pendulum system.
In addition, there are also many researches on the modeling and dynamic characteristics analysis of the friction pendulum vibration isolation system. For example, Xia Junyong [8] introduced a new model of equivalent mass center of friction pendulum bearings, and based on this model, the equivalent centroid and sliding surface separation coefficients are defined. Cardone D. [9] carried out extensive parametric research on spherical sliding isolation systems (FPSs), performed thousands of nonlinear response historical analyses of SDOF systems, and studied the recovery capability of friction pendulum systems. Tu Jingsong [10] conducted in-depth research on the dynamic response and isolation performance of large tonnage friction pendulum isolated bearings suitable for high-rise building structures under different seismic loading conditions through model shake table tests and numerical simulations. Weng Dageng [11] used a model shaker table to study the seismic isolation performance of a floor using a complex friction isolation support (MFPB).
Friction pendulum systems are also used in vibration isolation of electrical equipment. For example, Ala Saadeghvaziri M. [12] used basic vibration isolation devices such as friction pendulums for vibration isolation of electrical equipment in substations. The related research on the seismic protection of large transformers using the friction pendulum vibration isolation system is presented.
The friction pendulum systems are mostly used in construction engineering and other occasions, but it is rarely used in electrical equipment. In this paper, one of the electrical equipment, high voltage isolating switch is used as the research object. The comparison of the seismic and vibration isolation tests is used to study the isolation effects of the friction pendulum applied on the isolating switch under various simulated earthquake conditions. Isolating switch and the vibration isolation effect of the friction pendulum system on electrical equipment is also verified. At the same time, based on the friction pendulum used in the vibration isolation test, the parameters of this friction pendulum were optimized through numerical simulation, and the influence of friction coefficient and radius of curvature on the vibration isolation performance of the friction pendulum was considered. And the paper is arranged as follows: experimental design, model text for isolating switch. The comparison of seismic test and vibration reduction test of isolating switch. Parameters optimization of friction pendulum and Conclusion.
2. Experimental design
2.1. Shaking table equipment
This experiment was completed in a structural and seismic laboratory. The experiment uses a three-dimensional, six-degree-of-freedom earthquake simulation shake table test system from the American MTS company.
The size of seismic simulation shaking table is 4.1 m×4.1 m. The test frequency range is from 0.1 Hz to 50 Hz. The maximal equipment load under full load is 20 t, and the equipment load is 30 t under load reduction. When the equipment load is 20 t, the horizontal -direction maximal acceleration is 1.5 g and the maximal acceleration of -direction and the vertical direction are 1.0 g respectively. When the full load is 30 t, the maximal acceleration in horizontal direction and in direction is 1.0 g respectively, and the maximal acceleration in vertical direction is 0.9 g.
A total of 81 bolt holes are arranged on the shaking table surface, with a pitch of 50 cm and a bolt whole diameter of 3 cm.
2.2. Friction pendulum equipment
110 kV isolating switch will be taken as the research object, so the design of the friction pendulum equipment is mainly designed for the isolating switch. After numerical simulation, it can be obtained that the first order natural frequency of the isolating switch is 3.03 Hz. The natural period, T1 is 0.33 s, and the natural period of the friction pendulum is T2 = 6T1, that is, the friction pendulum vibration isolation period is 1.98 s. According to the calculation formula of the friction pendulum period, the radius of curvature R of the lower support plate can be ≈1000 mm [13].
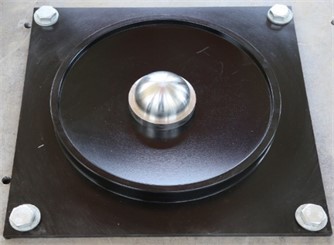
The friction pendulum system is designed to spray polytetrafluoroethylene (Teflon) in the lower bearing plate sliding surface and the upper bearing plate slider cavity. Because the Teflon coating has excellent sliding properties, it has a very low coefficient of friction at all times when it is in contact with most materials. Due to the different thickness and uniformity of sprayed Teflon coating, the range of friction coefficient that can be achieved is 0.05-0.2. But for the friction pendulum, the smaller the friction coefficient, the smaller the seismic force required when the slider starts to slide, but the sliding displacement also increases. Therefore, in order to ensure that the friction pendulum can achieve the effect of isolation as soon as possible, the friction coefficient is 0.05. Fig. 1 is a sectional view of a friction pendulum structure, 1 and 3 are Teflon coatings, 2 is an upper support plate, 4 is a slider, and 5 is a lower support plate. Fig. 2 is a picture of manufactured bottom plate and a slider of the friction pendulum.
Fig. 1Sectional view of friction pendulum structure
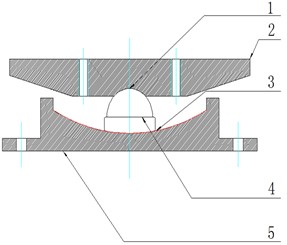
Fig. 2Bottom plate and a slider of the friction pendulum
2.3. Isolating switch equipment
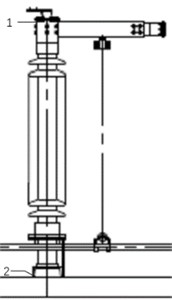
As shown in Fig. 3, an 110 kV isolating switch is used for this test. The size is: length × width × height = 4833 mm × 1750 mm × 2765 mm, and the weight is 980 kg. Test point 1 is the top of the isolating switch porcelain sleeve, and test point 2 is the top of the isolating switch bracket. These two points will be to measure the vibration of isolating switch.
2.4. Test input seismic wave
The input of seismic waves are very important for the earthquake simulation shaking table experiment. This experiment chooses the appropriate seismic wave according to the standard requirements of GB50011-2010 [14] and GB50260-2013 [15] Four types of waveforms were selected as the input waveforms of the earthquake simulation vibration test, which are white noise, artificial wave (local vibration waveform in Lanzhou), El-Centro wave and Taft wave. And these waveforms will be applied on the isolating switch horizontally through the test rig. When the horizontal vibration are increased, the power amplification factor of 1.2 times the bracket is considered ( 1.2).
Fig. 3Part of isolating switch and measuring points
2.5. Test conditions
In the seismic test, if the simulated earthquake intensity is too high, that is, the acceleration of the load is too high, the isolating switch isolating switch may be vulnerable, so the acceleration value of the load in the earthquake test is not selected too high. Based on different seismic accelerations of 0.1 g, 0.2 g, 0.4 g, and 0.6 g, the experiments of isolating switch under different waveforms are conducted. The vibration test conditions are shown in Table 1.
Table 1Seismic test conditions
Condition | Waveform | Acceleration (g) |
1 | White noise | |
2 | Artificial wave | 0.1 |
3 | EL Centro wave | 0.1 |
4 | Taft wave | 0.1 |
5 | White noise | |
6 | Artificial wave | 0.2 |
7 | EL Centro wave | 0.2 |
8 | Taft wave | 0.2 |
9 | White noise | |
10 | Artificial wave | 0.4 |
11 | EL Centro wave | 0.4 |
12 | Taft wave | 0.4 |
13 | White noise | |
14 | Artificial wave | 0.6 |
15 | EL Centro wave | 0.6 |
16 | Taft wave | 0.6 |
17 | White noise |
In the vibration isolation test, four friction pendulum devices are added to the vibration table, and the Isolating switch is subjected to the vibration isolation test. Considering the addition of a friction pendulum for vibration isolation, the input seismic accelerations are 0.1 g, 0.2 g, 0.4 g, 0.6 g, and 1.0 g, respectively, to obtain experimental data for vibration reduction under different waveforms. under comprehensive consideration, specific vibration isolation tests conditions can be obtained, as shown in Table 2.
Table 2Vibration isolation test conditions
Condition | Waveform | Acceleration (g) |
1 | White noise | |
2 | Artificial wave | 0.1 |
3 | EL Centro wave | 0.1 |
4 | Taft wave | 0.1 |
5 | White noise | |
6 | Artificial wave | 0.2 |
7 | EL Centro wave | 0.2 |
8 | Taft wave | 0.2 |
9 | White noise | |
10 | Artificial wave | 0.4 |
11 | EL Centro wave | 0.4 |
12 | Taft wave | 0.4 |
13 | White noise | |
14 | Artificial wave | 0.6 |
15 | EL Centro wave | 0.6 |
16 | Taft wave | 0.6 |
17 | White noise | |
18 | Artificial wave | 1.0 |
19 | EL Centro wave | 1.0 |
20 | Taft wave | 1.0 |
21 | White noise |
3. Modal test for isolating switch
In consideration of factors such as the accuracy and safety of the isolating switch vibration isolation experiment, this experiment uses white noise as the input waveform to perform a modal experiment, and in the two different cases of seismic cases and vibration reduction cases. Each time it changes before changing the earthquake intensity, the measurements of the first-order natural frequency of the isolating switch are performed respectively. Therefore, we can pay attention to whether there is any problem with the experimental equipment before and during the experiment.
The input white noise has a frequency range of 0.1-50 Hz, an acceleration half-peak of 0.03 g, and a duration of 120 s. during the seismic test, five sets of white noise modal experiments of the isolating switch were performed, which were before the isolating switch was installed, but before the test was started, and the acceleration of the load was 0.1 g. the first-order natural frequency of the isolating switch vibration test measured after the vibration test at g, after the vibration test with acceleration of 0.4 g, and after the vibration test with acceleration of 0.6 g Table 3 shows.
Table 3First order natural frequency (Hz) of Isolating switch seismic test
Condition | Before the test | After 0.1G | After 0.2G | After 0.4G | After 0.6G |
The first natural frequency isolating switch | 2.74 | 2.66 | 2.57 | 2.55 | 2.50 |
It can be seen from Table 3 that under the seismic condition, after each increase in acceleration, the measured first-order natural frequency of the isolating switch isolating switch continues to decrease slightly, indicating that the equipment has not been greatly damaged. That is, the experiment can be continued
During the vibration isolation test, 6 groups of white noise modal test for the isolating switch were performed. Before the isolating switch was installed, the test was not started, and the acceleration of the load was 0.1 g, and the acceleration of the load was 0.2 g. After the vibration reduction test at time, the acceleration after loading was 0.4 g, the vibration reduction test at 0.6 g, and the vibration reduction test at 1.0 g. the measured first-order natural frequency of the Isolating switch isolation test is shown in Table 4.
It can be seen from Table 4 that the first-order natural frequency of the isolating switch decreases slightly with the increase of acceleration under the vibration reduction condition, and the decrease are larger than that under the seismic condition, but in general, no equipment damage was seen.
Table 4First order natural frequency (Hz) of isolating switch vibration reduction test
Condition | Before the test | After 0.1G | After 0.2G | After 0.4G | After 0.6G | After 1.0G |
Isolating switch | 2.65 | 2.65 | 2.65 | 2.4 | 2.35 | 2.12 |
4. The comparison of seismic test and vibration reduction test of isolating switch
The vibration isolation performance of the friction pendulum is judged by comparing the experimental data in the case of seismic test and vibration reduction tests. This paper mainly compares and analyzes the results of the measured acceleration of two different cases to verify the isolating performance of the friction pendulum. Fig. 4 is the site map of the seismic test of isolating switch and Fig. 5 is the site isolation test of the vibration isolation test.
Fig. 4Site map of seismic test for isolating switch
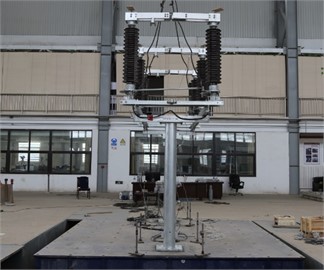
Fig. 5Site map of Isolating switch vibration reduction test for isolating switch
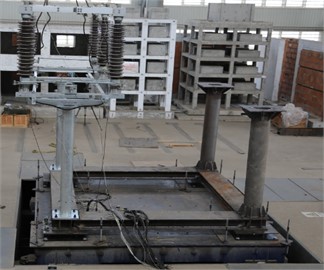
During the seismic test, isolating switch is directly installed in the middle of the vibration table, and the test is performed according to the above-mentioned seismic test conditions. in the vibration reduction experiment, a square connection beam is installed on the vibration table for the earthquake simulation test table. the four friction pendulums and the disconnect switch above are installed.
4.1. Comparison of acceleration on top of porcelain sleeve of isolating switch
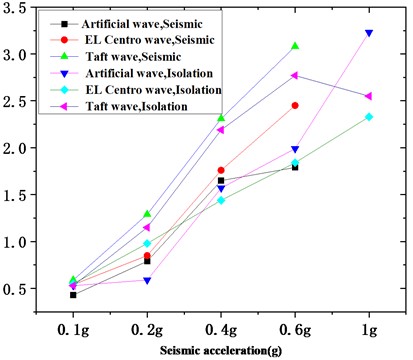
In this test, an acceleration sensor was installed on top of the isolating switch porcelain sleeve and the top of the isolating switch bracket to measure the acceleration of the isolating switch isolating switch during the simulated earthquake. the sensor data was extracted and analyzed to obtain the acceleration of the top of the isolating switch porcelain sleeve and the top of the bracket. the test data obtained from the vibration isolation and vibration resistance tests are compared. the comparison data of the seismic and vibration reduction tests on the top of the isolating switch porcelain bottle is shown in Fig. 6.
For the EL Centro wave, the vibration reduction effect of friction pendulum is obvious. When the earthquake intensity is 1.0 g, the acceleration at the top of the isolating switch after using the friction pendulum is already lower than the acceleration of 0.6 g, which indicates that the friction pendulum vibration isolation system is EL Centro wave played a good role. Similarly, for the Taft wave, the vibration isolation effect of the friction pendulum is also quite obvious, especially at 0.6 g and 1.0 g, the acceleration at the top of the porcelain sleeve is significantly reduced.
Fig. 6Acceleration comparison on top of porcelain sleeve of isolating switch
4.2. Comparison of acceleration on top of bracket of isolating switch
Analyzing the acceleration of the top of the bracket of the isolating switch in two different cases, Fig. 7 is obtained.
Fig. 7Comparison curve of acceleration at the top of the bracket of isolating switch
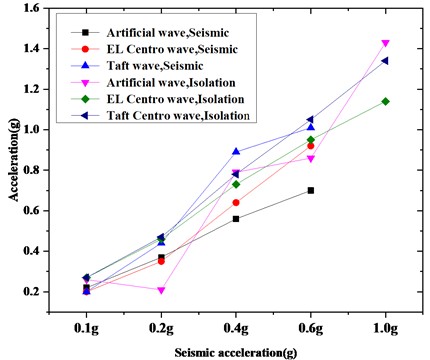
According to Fig. 7, it can be obtained that for artificial waves, the friction pendulum only plays a role at 0.2 g; also for EL Centro wave, it plays a role at 0.4 g, but the friction pendulum is used after 0.6 g, the trend increased slowly; for the Taft wave, it only played a role at 0.4 g, and other operating conditions were not obvious.
According to the acceleration analysis on top of the porcelain sleeve of the isolating switch and the top of the bracket, the vibration isolation effect of the friction pendulum on artificial waves is not obvious, but it is more obvious on EL Centro wave and Taft waves, which can have a good vibration isolation effect, and reduce the degree of shaking at the top of the isolating switch.
5. Parameters optimization of friction pendulum
From the above tests, it can be concluded that the friction pendulum in the isolating switch isolation system will have significant effect for vibration reduction, when the acceleration strength is higher. In order to obtain better isolation effects, the parameter optimization design of the friction pendulum is considered. This section considers numerical simulations of friction pendulums with different friction coefficients and curvature radii. The vibration isolation performance of friction pendulum with different parameters in the simulation test is compared.
5.1. Analysis of vibration isolation effects of friction pendulum with same friction coefficient and different curvature radius
In this part of the simulation experiment, by controlling the friction coefficient to a fixed value and different curvature radii are taken into account to observe its effect on the vibration reduction. Because the friction coefficient is 0.04, 0.05 and 0.06, the experimental effect is not much different. Here we only consider when the friction coefficient is 0.04, and analyze the top displacement of the isolating switch and the stress change of the root of the porcelain bottle.
5.1.1. Displacement on top of isolating switch
When the friction coefficient is 0.04, the curvature radii of the friction pendulum are taken to be 900 mm, 1100 mm, 1200 mm, and 1300 mm, respectively. the input seismic wave intensity is 0.1 g, 0.2 g, 0.4 g, 0.6 g and 1.0 g. Because the data obtained by the Taft wave is relatively obvious, only the data obtained by the Taft wave is used for analysis. the obtained data is shown in Fig. 8.
Fig. 8Comparison of top displacement of isolating switch under the same friction coefficient (Taft wave)
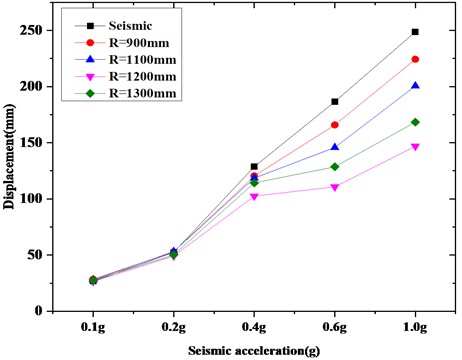
It can be seen from Figure 8 that after the friction pendulum is added, the top displacement of the isolating switch are reduced compared to the seismic test. However, different curvature radii will give rise to different displacement on top of isolating switch, when the friction coefficient of the sliding surface of the lower support plate is the same. in general, the friction pendulum has a smaller effect at smaller seismic waves, namely, 0.1 g and 0.2 g, that is, when subjected to at low earthquake intensity, the vibration reduction effect of the friction pendulum is not obvious. with the increase of the seismic wave intensity, the top displacement decreases significantly after using the isolation device, especially for the radius of curvature 1200 mm. When the coefficient of friction is 0.05 and 0.06, the displacement of the top of the isolating switch is roughly the same as above.
5.1.2. Stress changes at the roots of isolating switch porcelain bottles
The content of the simulation experiment is the same as above. Let the friction coefficient be 0.4, and input the seismic waves of 0.1 g, 0.2 g, 0.4 g, 0.6 g, 1.0 g to get the seismic data and the stress change of the porcelain bottle root corresponding to different curvature radii, as shown in Fig. 9.
It can be seen from Fig. 9 that the stress change of the porcelain bottle root is relatively large under the condition of seismic test, but for the isolating switch using the friction pendulum, the stress change of the porcelain bottle root is obviously reduced, but when the friction pendulum with different curvature radius are used, the vibration reduction effects are also different. Although the effect is not obvious when the seismic wave is 0.1 g and 0.2 g, the effect of the friction pendulum vibration isolation support is much greater when the seismic wave intensity increases. Generally speaking, when the radius of curvature 1200 mm, the root stress of the porcelain bottle is the smallest. the friction coefficient is 0.05, and the effect is the same as 0.06.
Fig. 9Comparison of strain at the root of isolating switch porcelain bottle under the same friction coefficient (Taft wave)
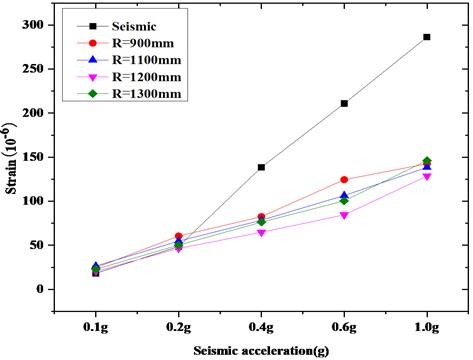
Through the above simulation analysis of the effects of the friction pendulum isolation of various parameters, it can be obtained that: under the same friction coefficient, the isolation effect is different for different curvature radii, but the overall trend is the same: when the curvature radius is 1200 mm, the friction pendulum has the best control of the top displacement of the isolating switch and the strain on the root of the porcelain bottle of isolating switch.
5.2. Vibration reduction of different friction coefficients under the same curvature radius
In this part of the simulation experiment, the curvature radius is controlled to a fixed value, and the influence of different friction coefficients on the vibration isolation effect of the friction pendulum is observed. It has been concluded above that the vibration isolation effect is best when the radius of curvature is 1200 mm, so the radius of curvature of this part of the experiment is set to 1200 mm. Combining the previous simulation experiments can confirm the vibration isolation effect of the friction pendulum, so this part of the experiment does not need to carry out seismic test.
5.2.1. Displacement analysis of the top of the isolating switch
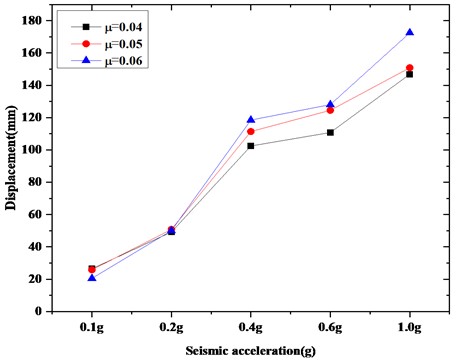
The radius of curvature is 1200 mm, and the different friction coefficients are 0.04, 0.05, and 0.06, respectively. the input seismic waves are 0.1 g, 0.2 g, 0.4 g, 0.6 g, 1.0 g. Here, only the Taft seismic wave is taken as an example. the comparison of the displacement isolation of the top of the isolating switch under the same radius of curvature is shown in Fig. 10.
According to the previous experiments, it can be determined that the displacement of the top of the isolating switch will decrease after the friction pendulums t is added. Here we observe the degree of reduction corresponding to different friction coefficients. When the intensity of the seismic wave is relatively small, such as 0.1 g and 0.2 g the effects of the friction pendulum corresponding to the three friction coefficients were almost the same, but after the seismic wave intensity increased, the vibration isolation effect of the friction pendulum with a friction coefficient of 0.04 was better than the other two.
Fig. 10Comparison of displacement isolation of the top of an isolating switch under the same curvature radius (Taft wave)
5.2.2. Stress analysis at the root of isolating switch porcelain bottles
Considering the stress change at the root of the isolating switch porcelain bottle, the friction coefficients are 0.04, 0.05 and 0.06 respectively. Add seismic waves with an intensity of 0.1 g, 0.2 g, 0.4 g, 0.6 g and 10 g. Here, only the Taft wave is taken as an example, and the comparison data of strain isolation at the root of a porcelain bottle under the same radius of curvature is shown in Fig. 11.
Fig. 11Comparison of strain isolation of roots of porcelain bottles with the same radius of curvature (Taft wave)
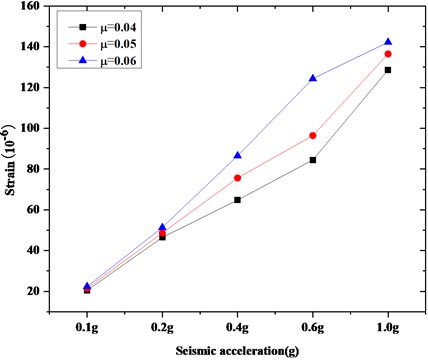
It can be concluded from Fig. 11, that the strain reduction of the isolating switch porcelain root corresponding to different friction coefficients is different, but the effects are different. The friction coefficient is the best when the coefficient of friction is 0.04, and the strain value is the least.
Through the analysis of the vibration isolation performance of the friction pendulum with different friction coefficients, it can be concluded that under the same curvature radius, although the friction pendulum with different friction coefficients has a certain degree of vibration reduction effect. However, when the friction coefficient is 0.04, the vibration isolation effect of the friction pendulum is the best under a certain radius of curvature.
6. Conclusions
In this paper, a friction pendulum is designed and manufactured, and an isolating switch is used as a test object to conduct seismic tests and vibration reduction tests in order to verify the vibration isolation performance of the friction pendulum. Based on the friction pendulum used in the experiment, numerical simulation was conducted to study the influence of the radius of curvature and friction coefficient on the vibration isolation effect of the friction pendulum. the following conclusions were obtained:
1) Taking isolating switches into account, seismic and vibration reduction tests to verify the vibration isolation performance of friction pendulums are investigated. at present, there are relatively few friction pendulum vibration isolation tests for isolating switch.
2) White noise modal tests were performed on the isolating switch during the seismic test and vibration reduction tests. the first-order natural frequencies of the isolating switch were measured under different test cases, and the analysis showed that the isolating switch was not damaged during the test.
3) The seismic acceleration of the isolating switch vibration reduction test reached 1 g. There are fewer tests that reach such standards. It can be used as a reference for the following research.
4) The acceleration of the top of the porcelain sleeve and the acceleration of the bracket in the vibration isolation test of the isolating switch is compared and analyzed in order to study the vibration isolation performance of the friction pendulum system.
5) The parameters of the friction pendulum are optimized and simulated. the vibration isolation effects of the friction pendulum under different friction coefficients and curvature radii are considered, and simulation tests are performed. It is concluded that the vibration isolation effect of the friction pendulum is the best when the radius of curvature is 1200 mm and the friction coefficient is 0.04, which can be used as a reference for subsequent research.
References
-
Zhou Y., Gong J., Deng X. S. Simplified analysis and numerical simulation of double variable curvature friction pendulum isolation bearing. Engineering Mechanics, Vol. 78, Issue 6, 2012, p. 2877-2889.
-
Morgan T. A., Mahin S. A. Achieving reliable seismic performance enhancement using multi-stage friction pendulum isolators. Earthquake Engineering and Structural Dynamics, Vol. 39, Issue 13, 2010, p. 1443-1461.
-
Rabiei M., Khoshnoudian F. Response of multistory friction pendulum base-isolated buildings including the vertical component of earthquakes. Canadian Journal of Civil Engineering, Vol. 38, Issue 10, 2011, p. 1045-1059.
-
Mazza M. Nonlinear analysis of r.c. framed buildings retrofitted with elastomeric and friction bearings under near-fault earthquakes. Earthquake Science, Vol. 28, Issue 5, 2015, p. 365-377.
-
Saha A., Saha P., Patro S. K. Polynomial friction pendulum isolators (PFPIs) for seismic performance control of benchmark highway bridge. Earthquake Engineering and Engineering Vibration, Vol. 16, Issue 4, 2017, p. 827-840.
-
Zhang R. F., Weng D. G., Ren X. S. Seismic analysis of a LNG storage tank isolated by a multiple friction pendulum system. Earthquake Engineering and Engineering Vibration, Vol. 10, Issue 2, 2011, p. 253-262.
-
Castaldo P., Amendola G., Ripani M. Seismic fragility of structures isolated by single concave sliding devices for different soil conditions. Earthquake Engineering and Engineering Vibration, Vol. 17, Issue 4, 2018, p. 869-891.
-
Xia J. Y., Ning X. L., Tan P., Hao H. X., Chen G. P. Impact of the equivalent center of mass separating from the sliding surface on the isolation performance of friction pendulum bearings. Earthquake Engineering and Engineering Vibration, Vol. 14, Issue 4, 2015, p. 695-702.
-
Cardone D., Gesualdi G., Brancato P. Restoring capability of friction pendulum seismic isolation systems. Bulletin of Earthquake Engineering, Vol. 13, Issue 8, 2015, p. 2449-2480.
-
Tu J. S., Li Z., Liu Y. Z. Experiment, simulation and application research of friction pendulum isolation bearing system. World Earthquake Engineering, Vol. 30, Issue 2, 2014, p. 237-246, (in Chinese).
-
Weng D. G., Zhou Y., Zhao Y. Isolation efficiency check for multiple friction pendulum bearings using shaking table tests. Journal of Vibration and Shock, Vol. 33, Issue 3, 2014, p. 122-129, (in Chinese).
-
Ala Saadeghvaziri M., Feizi B., Kempner L. On seismic response of substation equipment and application of base isolation to transformers. Power Delivery IEEE Transactions on Power Delivery, Vol. 25, Issue 1, 2010, p. 177-186.
-
Chen P., Zhou Y. The applicable design method of isolated structure using friction pendulum system. Earthquake Engineering and Engineering Vibration, Vol. 37, Issue 1, 2017, p. 58-65, (in Chinese).
-
GB50260-2013 Code for Seismic Design of Electrical Installations. China Planning Press, Beijing, 2013, (in Chinese).
-
GB50011-2010 Code for Seismic Design of Buildings. China Construction Industry Press, Beijing, 2010, (in Chinese).
About this article
The work was supported by the Shanghai Natural Science Foundation under Grant No. 19ZR1420300, and Capacity Building Projects in Local Universities of Science and Technology Commission of Shanghai Municipality (No. 19020500900).

