Abstract
Construction of an optimal band-pass filter for effective envelope demodulation spectral (EDS) analysis of rolling element bearing has been studied widely and amount of methods have been arising. However, most of these methods only get the envelope demodulation analysis result of a specific frequency band. In fact, multiple resonance bands might be caused when rolling bearing fails, especially when compound fault arises, and some key components buried in the original signal are often neglected by the above methods such as fast Kurtogram and Autogram algorithms. Therefore, it is particularly necessary to establish a multi-band pass filter algorithm for EDS. In the paper, an adaptive multi-band pass filter method based on signal energy is proposed, and then the square wave envelope analysis method is used for multi-band pass filtered signal to extract the fault characteristic frequency of rolling bearing. In addition, since the phase of the signal retains a lot of useful information of the original signal, the phase information of the multi-band filtered signal is retained and used for signal reconstruction. Not only the early weak fault feature could be extracted, but also the compound fault feature of rolling bearing could also be extracted by the proposed method, which is verified thorough simulation and experiments.
Highlights
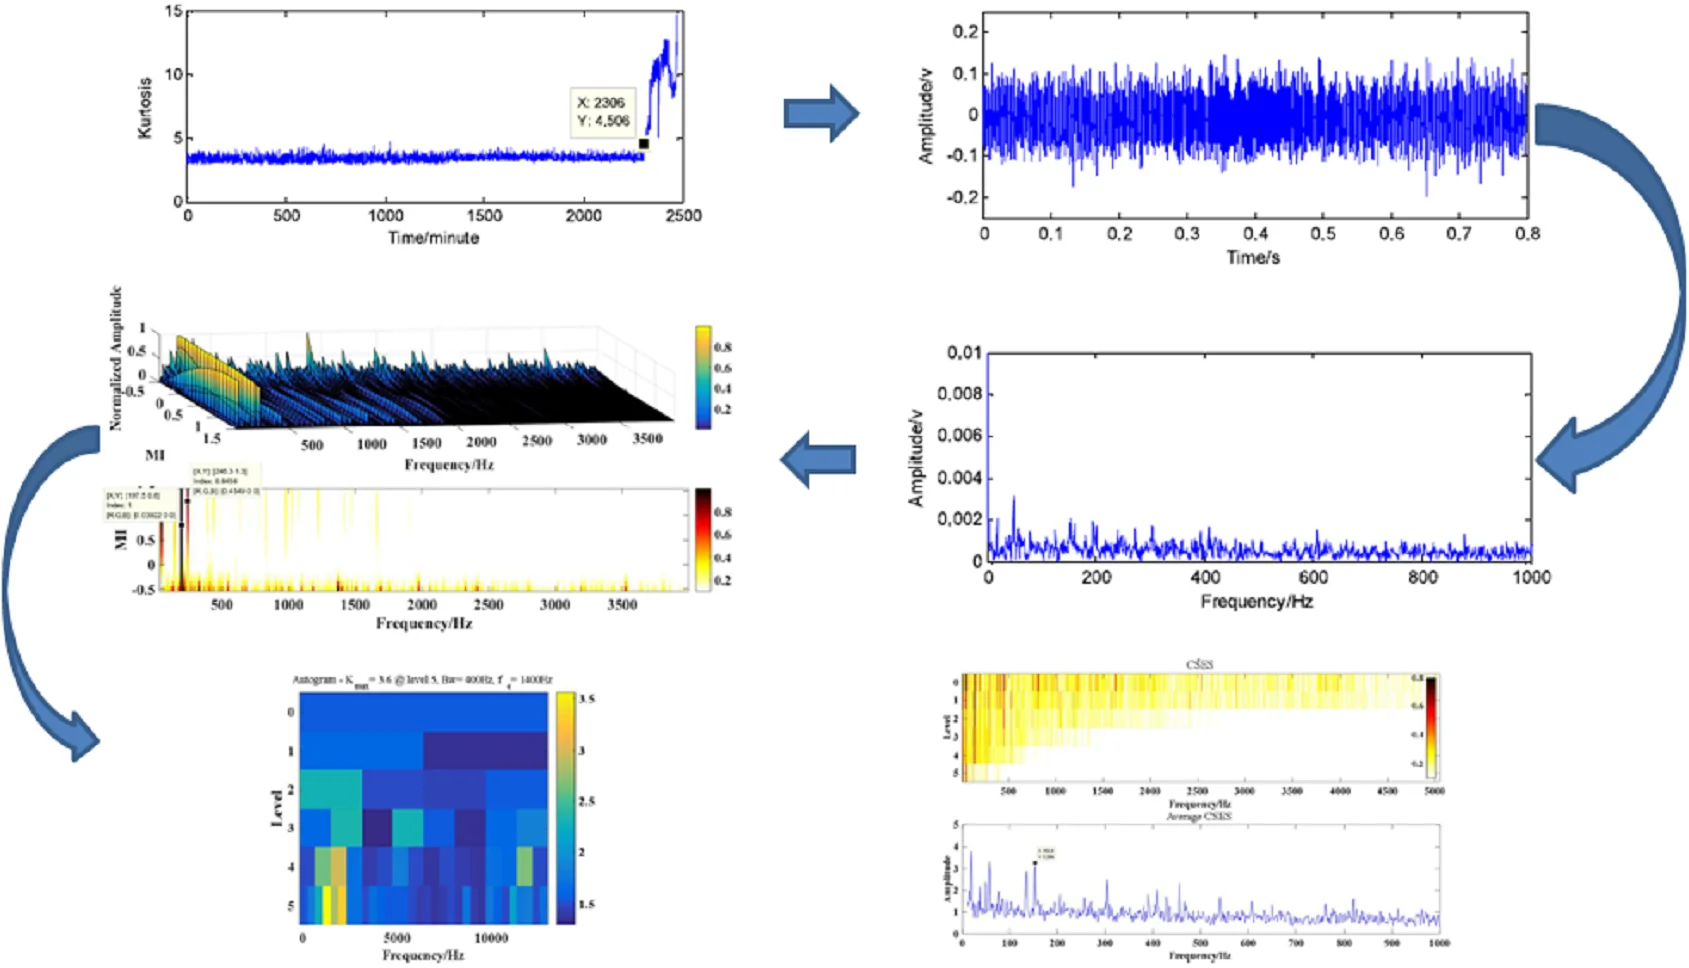
- Accelerated fatigue test of rolling bearing is carried out and the early weak fault stage vibration data is used to verify the effectiveness of the proposed method.
- An adaptive multi-band pass filter construction method for EDS is proposed in the paper.
- The phase information of the multi-band filtered signal is retained and used for signal reconstruction.
1. Introduction
Rolling element bearing is the most commonly used supporting component whose safe running plays a decisive role in guaranteeing the safety of the whole unit. EDS is a classical feature extraction method for rolling element bearing. Usually, an optimal band-pass filter is often needed to be constructed for better EDS effect. In recent years, extensive achievements have been made in the construction of optimal band-pass filters for envelope analysis. Fast spectral kurtosis algorithm [1] is the representative work which is a fourth-order spectral analysis for detecting and characterizing non-stationary components being buried in the vibration signal of rolling bearing. However, the fast spectral kurtosis would not work effectively when the signal-to-noise ratio is low. To solve this problem, Protrugram was proposed to select the optimal band for vibration signal demodulation [2]. Protrugram is based on the kurtosis of the envelope spectrum amplitudes of the demodulated signal, rather than on the kurtosis of the filtered time signal. The advantage of Protrugram is the ability to detect transients with smaller signal-to-noise ratio comparing to the SK-based Fast Kurtogram. Alike Protrugram to solve the drawback of fast kurtosis algorithm in fault feature extraction of vibration signal and taking advantage of the second-order cyclostationary characteristic of the vibration signal when fault arises in rolling bearing, the Autogram method was proposed [3]. An adaptive Kurtogram method using the order statistics filter (OSF) to estimate and divide the effective modal components from the spectrum to replace the fast Kurtogram (FK) was proposed [4], and it was verified by simulated signals and actual signals that the proposed method was faster and more efficient than Kurtogram. However, the main disadvantage of the above algorithms is that only signal being contained in one frequency band is selected for EDS analysis, and it may result in misjudgement when compound fault arises in rolling element bearing, because the fault characteristic signal of rolling element bearing compound fault will distribute in different frequency bands. Effective feature extraction of rolling bearing compound fault is a hot and difficult area. A novel fault diagnosis method was proposed by combing compound feature selection with parameter optimization of ELM, which was verified owing the advantage of high accuracy compared with the other relating methods [5]. Effective fault feature extration of rotating machinery under variable speeds is a challenge area due to the reason that the vibration signals are multi-components and time-varying, and a multi-faults detection method was proposed basing on Vold-Kalman generalized demodulation to address the issue successfully [6]. A multi-objective iterative optimization algorithm was introduced into maximum correlated kurtosis deconvolution to overcome its limitation in fault feature extraction of rolling bearing compound fault [7]. Deep convolution neural network (DCNN) was combined with support vector machine (SVM) to extract the features of rotating machinery multi-fault vibration signals, which solved the shortcomings of hum-designed feature sets being not able to respond adequately to the complex task of fault diagnosis to some extent [8]. The study developed a novel ensemble extreme learning machine (EELM) network to replace the conventional layout by combining binary classifiers (e.g., binary relevance) for compound-fault diagnosis of rotating machinery effectively [9]. An intelligent rolling element bearing fault diagnosis method based on wavelet kernel component analysis and coupling hidden Markov model was proposed [10], and the feasibility and advantages of the proposed method are verified through experiment.
However, most of the above stated compound fault diagnosis methods of rolling bearing are intelligent methods, and their computation ratio is relative lower than signal processing based methods. Besides, most of the existed optimal band-pass filter construction methods such as Protrugram, Autogram and so on would not work effectively when signal-to-noise ratio is low or compound fault arises in rolling bearing. To solve the above stated problem, an adaptive multi band-pass filter construction method is proposed in the paper for EDS analysis. Besides, the phase information contained in the signal is retained and utilized effectively for signal reconstruction. The validity and superiority of the method are verified by compound fault and early weak fault of rolling element bearing.
The remained parts of paper are organized as follows. Section 2 is dedicated to the basic theory of the proposed method. In Section 3, simulation is carried out to verify the effectiveness of the proposed method in early weak fault feature extraction of rolling bearing. In Section 4, processes of the proposed method in fault diagnosis of the rolling element bearing compound and early weak fault are given. Conclusions obtained from the above results are given in Section 5.
2. Basic theory and the adaptive multi ban-pass filter
2.1. Cepstrum
Cepstrum is defined as “spectrum of spectrum”. The frequency domain signal is obtained by applying fast Fourier transform (FFT) on the time domain signal, and it could be expressed in Eq. (1):
where represents the amplitude and represents the phase. represents the imaginary units.
The definition of complex cepstrum is shown in Eq. (2):
where IFT represents the inverse transform of FFT, andrepresents the arbitrary increment of the amplitude to avoid the occurrence of 0. Correspondingly, the abscissa unit in the complex cepstrum is time.
The calculation of real cepstrum is to set the phase to zero and only use the amplitude, which could be expressed in Eq. (3):
Cepstrum could enhance the periodic components such as harmonics with their side bands compared with the conventional linear spectral analysis method. However, cepstrum is not used widely same as EDS, and the reason is following: the principle of cepstrum calculation and the intuition of analysis results are not as good as EDS method.
2.2. Cepstrum correction and cepstrum prewhitening
Cepstrum correction is proposed on the basis of the real cepstrumas as shown in Eq. (3). In essence, cepstrum correction is to select discrete frequencies and their corresponding spectral lines manually on the real cepstrum and remove them, so that the interested components of analyzed signal could be retained. Based on the idea of cepstrum correction, a similar but simple algorithm, that is cepstrum whitening method is proposed [11]: divide the Fourier transform of the signal by its norm, and then transform it into time domain by inverse fast Fourier transform (IFFT), which is shown in Eq. (4):
where represents the prewhitening signal, and represents norm symbols. This method is named as cepstrum prewhitening method and its essence is to set the corresponding amplitudes of all frequencies to 0 in the real cepstrum. So this technique could be regarded as a signal reconstruction technique only by using the phase information, and it was used in fault feature extraction of rolling bearing successfully [11].
2.3. The adaptive multi band-pass filter
Although the cepstrum whitening method has achieved some results in fault diagnosis of rolling bearings [12], there existing two drawbacks of it:
1) Signal-to-noise ratio of the reconstructed signal will be reduced to some extent because all real cepstrums are set to zero in cepstrum prewhitening method or, that is to say, the amplitude of the signal in the whole frequency domain is set to 1, so the noise and the target signal have the same amplitude.
2) It is concluded that the damage-related peak does not have a large range in the actual cepstrum assuming that the bearing defect signal only takes on second-order cyclostationary. This hypothesis is inaccurate because the random sliding is not obvious in many cases, and the discrete components related to the defects could be detected in both frequency domain and inverse frequency domain.
As mentioned earlier, all real cepstrums are set to zero in order to reduce noise interference in cepstrum pre-whitening method. In addition, the cepstrum pre-whitening method based on Eq. (4) could be used directly in frequency domain. Therefore, Eq. (4) could be rewritten into Eq. (5):
Although amplitude inconsistency with the original signal may be caused in Eq. (5) due to amplitude correction, this problem could be neglected [13]. In fact, phase contains more signal information than amplitude in signal construction, and it is sufficient to reconstruct signal with phase information [14].
Since it is too arbitrary to unify all the amplitudes in cepstrum pre-whitening method, it is better to operate the amplitude of the original signal so that it could represent the overall behavior of spectrum. A non-linear filter could be formed to separate various signal components from different sources by giving different weights to different frequency components. Based on the above stated and Eq. (5), a new method as shown in Eq. (6) is proposed:
where is named as corrected signal which is reconstructed by the symbolic amplitude and the phase information of the original signal. In fact, the exponent 0 in Eq. (5) is replaced by (, and represent any number), and is named as amplitude index. It is worth noting that the original signal and the pre-whitened signal in Eq. (6) correspond to the amplitude index of 1 and 0 respectively.
Flow chart of the adaptive multi band-pass filter method is shown in Fig. 1. Similar to cepstrum correction and cepstrum pre-whitening, the interference of signal is unavoidable due to the change of amplitude spectrum. However, the main purpose of bearing fault diagnosis is to extract the recurrence frequency caused by fault. So the interference caused by the change of amplitude spectrum could be negligible (the period of impulse signal caused by fault remains unchanged) if the amplitude index is selected properly. Apply square wave envelope analysis and square wave envelope spectrum analysis as shown in Eq. (7a) and (7b) respectively on the series of corrected signals:
where represents analytical, represents envelope analysis and SES represents envelope spectrum analysis.
In the conventional method, the envelope spectrum analysis results could be obtained by applying FFT on the analysis result of Eq. (7a). A new logarithmic envelope spectrum analysis method is used to extract the second-order cyclostationary signals hidden in non-Gaussian and impulsive noise signals [15], which is shown in Eq. (8):
The logarithmic envelope spectrum analysis method as shown in Eq. (8) has a lower signal-to-noise ratio being compared with . So, the algorithm as shown in Eq. (8) is improved in the paper, and the improved algorithm is shown in Eq. (9):
3. Simulation
Firstly, simulation is carried out to verify the effectiveness of the proposed method in extracting the early weak fault feature of rolling bearing. The rolling bearing fault model [16, 17] is used whose mathematical express could be shown in Eq. (10):
where is tiny fluctuation around mean period . Sampling frequency is set as25600 Hz, and24 Hz is the shaft rotating frequency. The fault characteristic frequency (FCF) of inner race is102 Hz, and the system natural frequency is 4000 Hz. It is assumed that the random sliding between the rolling element and the race distributes normally, and its standard deviation is 0.5 % of the shaft speed ratio. Time-domain waveforms of the simulated signal without noise and with noise are shown in Fig. 2(a) and (b) respectively: Fig. 2(b) simulates the early weak fault of rolling bearing, and Fig. 2(c) is its corresponding EDS analysis result basing on which the distribution of the spectral lines are chaotic so that it is impossible to extract the FCF of inner race fault.
Fig. 1Flow chart of the adaptive multi band-pass filter method
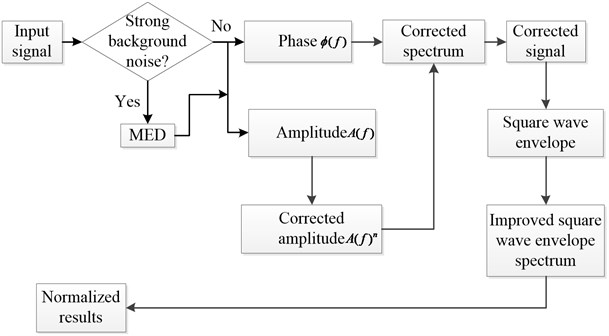
It is evident that the background noise is strong as shown in Fig. 2(b), so de-noise it using minimum entropy de-convolution (MED) [18] firstly as shown in Fig. 1, then the proposed method is applied on the de-noised simulation signal and the analysis result is shown in Fig. 3, and it could be seen that the FCF with its harmonics are extracted perfectly which illustrates the feasibility of the proposed method in extracting the early weak fault feature of rolling bearing.
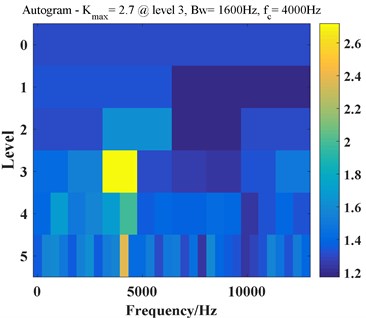
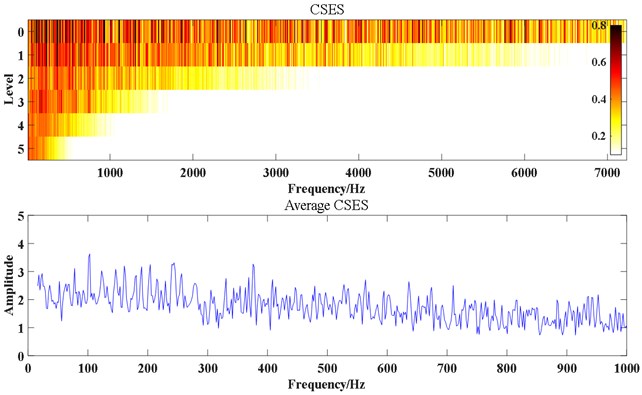
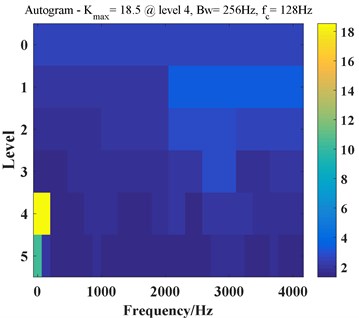
The analysis results using related method such as Autogram are also presented in the section to verify the advantages of the proposed method. The Autogram method is based on cyclic autocorrelation variance by utilizing the second-order cyclostationary characteristic of rolling bearing fault. Its steps are mainly as following: Firstly, the frequency band of fault signal is divided by maximum overlapping discrete wavelet packet transform. Secondly, the second-order cycle of rolling bearing is used. The periodic characteristic of autocorrelation variance function of stationary fault signal is calculated, and the unbiased autocorrelation function of envelope result of fault signal corresponding to each division frequency band is calculated. Then the kurtosis value corresponding to unbiased autocorrelation function is calculated, and the spectrum kurtosis map based on cyclic autocorrelation is obtained. A new indicator, Combined Squared Envelope Spectrum (CSES) [3], is employed to consider all the frequency bands with valuable diagnostic information to improve the fault detectability of the Autogram. Under the guidance of the above stated, Fig. 4 is the analysis result of the de-noised simulation signal using Autogram method from which the FCF of inner race could not be identified, and the noise robustness advantage of the proposed method over Autogram is verified. Besides, the computational time of the proposed method is about 80 % of Autogram through statistics.
Fig. 2Rolling bearing inner race fault simulation signal
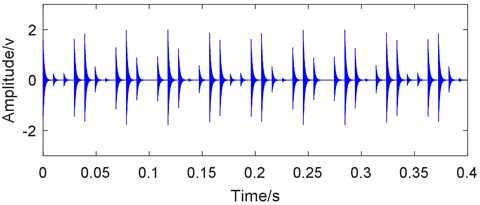
a) Time-domain waveform of inner race fault simulation signal
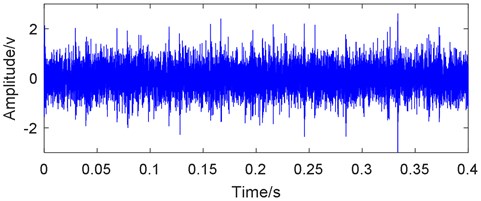
b) Time-domain waveform of inner race fault simulation signal added with white noise
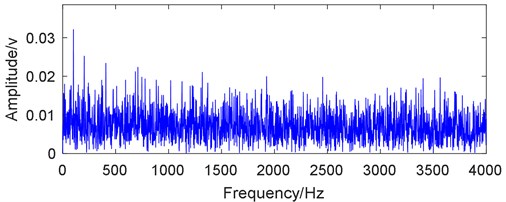
c) Envelope demodulation spectrum of inner race fault simulation signal added with white noise
Fig. 3Analysis result of the inner race fault simulation signal using the proposed method
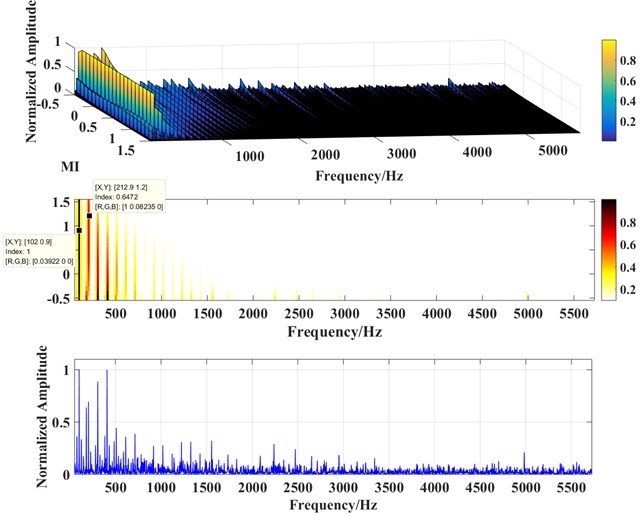
Fig. 4Analysis result of the inner race fault simulation signal using Autogram
4. Experiment
4.1. Rolling element bearing compound fault
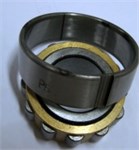
The test bed of rolling bearing compound fault is shown in Fig. 5(a). The test bearing is installed on the outer bearing seat of the test bench, and the inner ring is assembled with the main driving shaft. The main driving shaft is driven by a motor through a synchronous belt. The acceleration sensor is installed in the horizontal and vertical positions of the outer bearing seat (of course, this test only needs the signal data of a single channel). The signal acquisition system uses the NI PXI hardware platform and the LabVIEW software development platform. The acquisition system is shown in Fig. 5(b). The type of the test bearings is UN205, and the related parameters are shown in Table 1. The FCFs of the test bearings are 64.41 Hz (Outer race FCF), 95.38 Hz (Inner race FCF) and 5.38 Hz (Ball FCF) respectively. Process fault on the outer race, inner race and rolling element respectively using wire cutting technology and the processed fault on each part are shown in Fig. 6. Then different types of compound faults are realized by combing the different fault parts of the test bearing.
Table 1Parameters of the test bearing
Type | Ball number | Ball diameter [mm] | Pitch diameter [mm] | Contact angle | Rotating speed [rmp] |
NU205 | 12 | 7.5 | 39 | 0 | 800 |
Fig. 5Test rig and vibration signals collection device
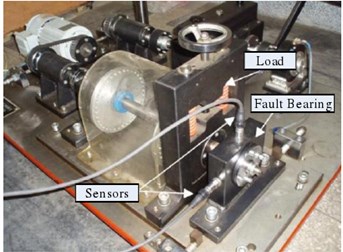
a) Test rig
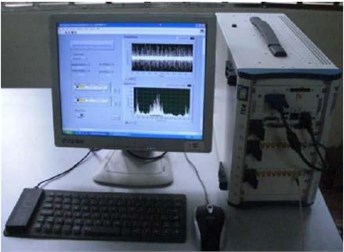
b) Vibration signals collection device
Fig. 6Processed faults on the test bearing
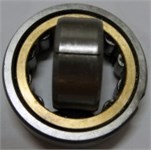
a) Inner race fault
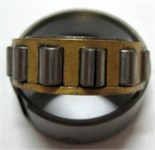
b) Rolling element fault
c) Outer race fault
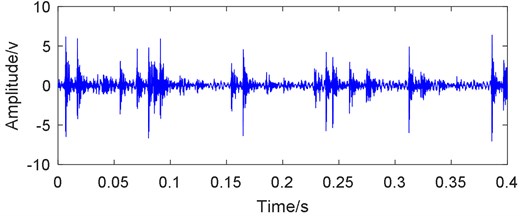
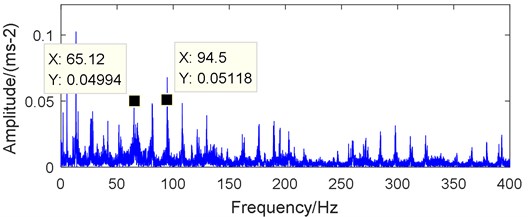
Firstly, the rolling bearing compound fault with inner race fault, out race fault and ball fault is carried out. Time-domain waveform with the corresponding EDS results of the vibration measuring point are shown in Fig. 7(a) and (b) respectively. It could be identified that the background noise is not strong based on Fig. 7(a), so it does not need to de-noise the original signal using MED method. Although EDS analysis method could extract the FCFs of inner race and outer race effectively, the FCF of ball could not be identified.
Fig. 7Time-domain waveform with its EDS of outer, inner race and ball compound fault
a) Time-domain waveform of outer, inner race and ball faults
b) EDS of outer, inner race and ball compound fault
Fig. 8Analysis result of outer, inner race and ball compound fault based on the proposed method
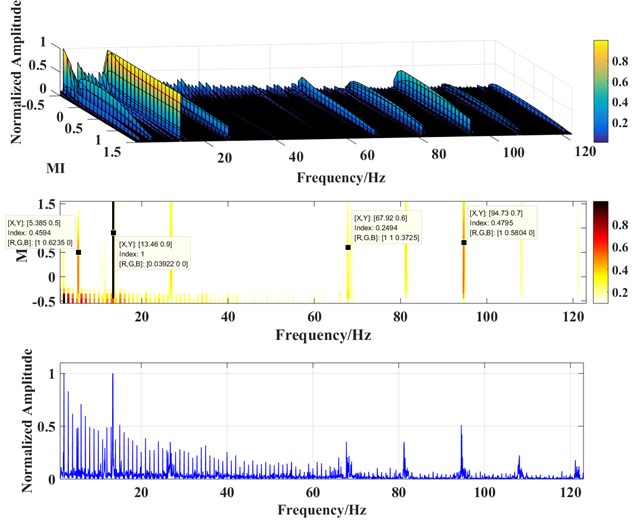
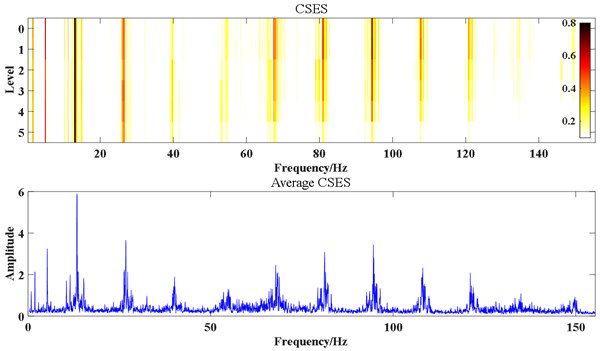
Fig. 9Analysis result of outer, inner race and ball compound fault based on Autogram method
The analysis results of the proposed method on the same vibration data are shown in Fig. 8: the three-dimensional analysis result of the proposed method is shown in the above figure of Fig. 8 in which -axis represents the frequency, the -axis represents the amplitude index and the -axis represents the normalized corrected amplitude. The middle figure of Fig. 8 is the corresponding two-dimensional view of the above figure of Fig. 8, and the normalized corrected amplitude is proportional to the depth of color. It is evident that the FCFs of inner race, outer race and ball are extracted successfully in the middle figure of Fig. 8, and the superior of the proposed method over traditional EDS method is verified. The bottom figure of Fig. 8 is the view along -axis of the above figure of Fig. 8, and it shows the maximum normalized amplitude at each frequency.
Fig. 9 is the analysis result by applying Autogram on the above same vibration data as shown in Fig. 7(a) in order to highlight the advantage of the proposed method in fault diagnosis of rolling bearing compound fault. Although Autogram analysis method could also extract the FCFs of inner race, outer race and ball effectively, its analysis result contains much more interference as shown in the bottom figure of Fig. 9 compared with Fig. 8, and this comparison further illustrates the superiority of the proposed method.
4.2. Rolling element bearing early weak fault
Accelerated fatigue test of rolling bearing is carried out in order to obtain much more real early weak fault vibration signal of rolling bearing. The details and processes of the test could be referred to reference [19].
Fig. 10Early weak fault of rolling bearing
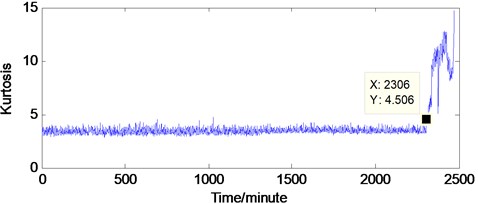
a) Kurtosis index of the experimental bearing life cycle
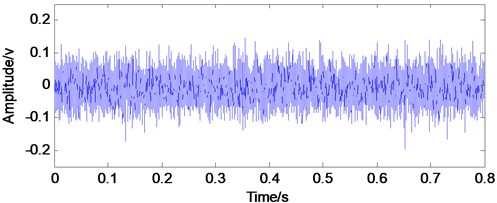
b) Time-domain waveform of the vibration data at 2297th minute
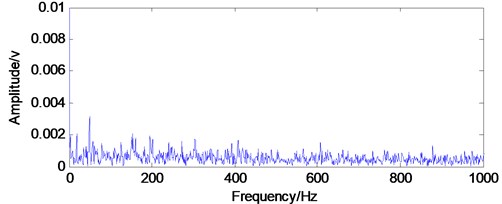
c) Envelope demodulation spectrum of signal as shown in Fig. 10(b)
Fig. 11Analysis result of rolling bearing early weak fault based on the proposed method
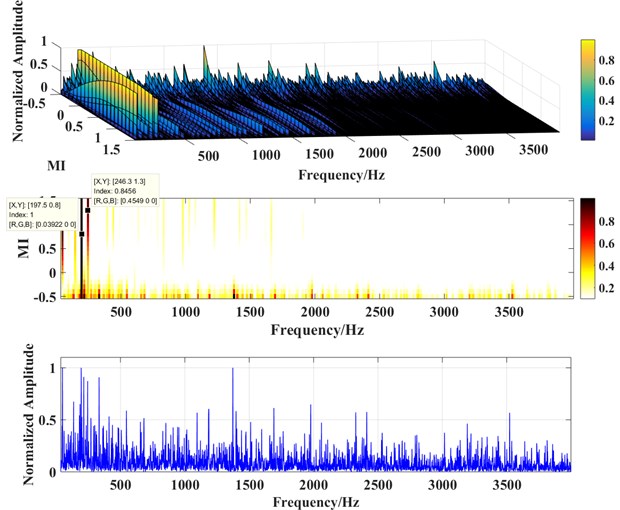
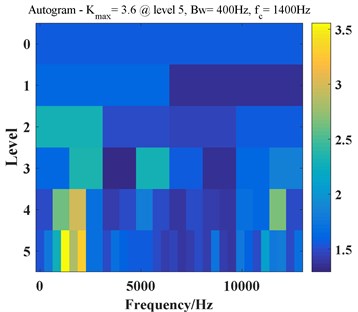
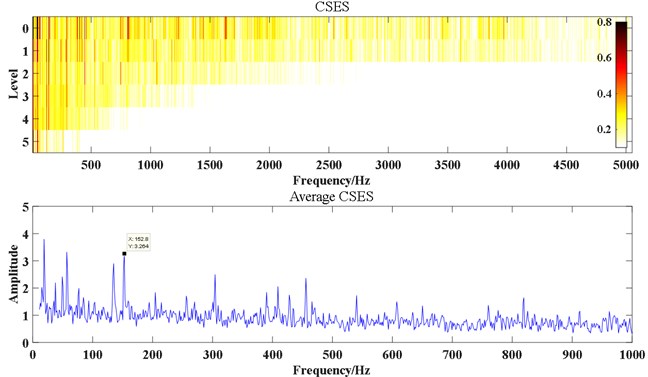
Fig. 12Analysis result of rolling bearing early weak fault based on the Autogram method
Kurtosis is an effective index reflecting the early weak fault of rolling bearing. Fig. 10(a) is the kurtosis curve of the test bearing over its whole life. Same as reference [19], the vibration data at 2297th minute could be regarded as the corresponding data at early weak fault stage of rolling bearing, whose corresponding time-domain waveform and EDS analysis result are shown in Fig. 10(b) and (c) respectively, and the FCF of test bearing could not be extracted based on Fig. 10(c).
Same as the above simulation and compound fault experiment signal handling processes, the analysis results of the early weak fault signal of rolling bearing based on the proposed method are shown in Fig. 11. From Fig. 11, it could be seen that the FCF of inner race is extracted effectively, which illustrates the effectiveness of the proposed method in extracting the characteristic of the early weak fault of rolling bearing. Same as above section, the Autogram method is applied on the 2297th data and the corresponding result is presented in Fig. 12: the FCF of the inner race could not be extracted. The advantages of the proposed method over Autogram method are further illustrated.
5. Conclusions
In the paper, a new non-linear signal processing method for rolling element bearing is proposed, which compensates the drawback of traditional EDS which needs to find an optimal band-pass filter. Besides, the traditional optimal band pass filter construction methods such as Protrugram, Autogram and so on only filter the signal contained in the selected frequency band which might omit some important components when the fault characteristic signals scatter in different frequency bands, and the situation is especially serious when compound fault arises in rolling bearing. The proposed method overcomes the above shortcomings to some extent.
Furthermore, the proposed method overcomes the above stated defect of traditional EDS method by using the phase information effectively. The proposed method is based on the idea that phase contains much more features than the amplitude of vibration signal, and it utilizes the information contained in the phase of the signal for signal reconstruction. The validity of the proposed method is verified by compound fault and early weak fault of rolling bearing. In addition, the advantages of the proposed method are verified by comparing with other new signal processing method such as Autogram.
References
-
Antoni J. Fast computation of the kurtogram for the detection of transient faults. Mechanical Systems and Signal Processing, Vol. 21, Issue 1, 2007, p. 108-124.
-
Barszcz T., Jabłon S. A. A novel method for the optimal band selection for vibration signal demodulation and comparison with the kurtogram. Mechanical Systems and Signal Processing, Vol. 25, Issue 1, 2011, p. 431-451.
-
Moshrefzadeh A., Fasana A. The autogram: an effective approach for selecting the optimal demodulation band in rolling element bearings diagnosis. Mechanical Systems and Signal Processing, Vol. 105, 2018, p. 294-318.
-
Xu Y. G., Zhang K., Ma C. Y., Cui L. L., Tian W. K. Adaptive kurtogram and its application in rolling bearing fault diagnosis. Mechanical Systems and Signal Processing, Vol. 130, 2019, p. 87-107.
-
Luo M., Li C. S., Zhang X. Y., et al. Compound feature selection and parameter optimization of ELM for fault diagnosis of rolling element bearing. ISA Transactions, Vol. 65, 2016, p. 556-566.
-
Zhao D. Z., Li J. Y., Cheng W. D., et al. Vold-Kalman generalized demodulation for multi-faults detection of gear and bearing under variable speeds. Procedia Manufacturing, Vol. 26, 2018, p. 1213-1220.
-
Ding C. C., Zhao M., Lin J., et al. Multi-objective iterative optimization algorithm based optimal wavelet filter selection for multi-fault diagnosis of rolling element bearings. ISA Transactions, Vol. 88, 2019, p. 199-215.
-
Xue Y., Dou D. Y., Yang J. G. Multi-fault diagnosis of rotating machinery based on deep convolution neural network and support vector machine. Measurement, Vol. 156, 2020, p. 107571.
-
Wang X. B., Zhang X. Y., Li Z., et al. Ensemble extreme learning machines for compound-fault diagnosis of rotating machinery. Knowledage-Based Systems, Vol. 188, 2020, p. 105012.
-
Wang H. C., Hao F. Fault diagnosis of rolling element bearing based on wavelet kernel principle component analysis-coupled hidden Markov model. Journal of Vibroengineering, Vol. 17, 2017, p. 1392-8716.
-
Borghesani P., Pennacchi P., Randall R. B., Sawalhi N., Ricci R. Application of cepstrum pre-whitening for the diagnosis of bearing faults under variable speed conditions. Mechanical Systems and Signal Processing, Vol. 36, Issue 2, 2013, p. 370-384.
-
Andreas K., Huynh V. K., Kjell G. R. Multi-band identification for enhancing bearing fault detection in variable speed conditions. Mechanical Systems and Signal Processing, Vol. 139, 2020, p. 106422.
-
Randall R. B., Sawalhi N. A new method for separating discrete components from a signal. Sound and Vibration, Vol. 45, Issue 5, 2011, p. 6-9.
-
Oppenheim A. V., Lim J. S. The importance of phase in signals. Proceedings of the IEEE, Vol. 69, 1981, p. 529-541.
-
Borghesani P., Shahriar M. R. Cyclostationary analysis with logarithmic variance stabilization. Mechanical Systems and Signal Processing, Vol. 70, Issue 71, 2016, p. 51-72.
-
Antoni A., Bonnardot F., Raad A., Badaoui M. Cyclostationary modeling of rotating machine vibration signals. Mechanical System and Signal Processing, Vol. 18, Issue 6, 2004, p. 1285-1314.
-
Borghesani P., Smith W. A., Zhang X., et al. A new statistical model for acoustic emission signals generated from sliding contact in machine elements. Tribology International, Vol. 127, 2018, p. 412-419.
-
Ma H. Q., Feng Z. P. Planet bearing fault diagnosis using multipoint optimal minimum entropy deconvolution adjusted. Journal of Sound and Vibration, Vol. 449, 2019, p. 253-273.
-
Wang H. C., Chen J., Dong G. M. Feature extraction of rolling bearing’ early weak fault based on EEMD and tunable Q-factor wavelet transform. Mechanical Systems and Signal Processing, Vol. 48, Issues 1-2, 2014, p. 103-119.
Cited by
About this article
The research is supported by the Key Science and Technology Research Project of the Henan Province (approved grant: 192102210105) and the National Natural Science Foundation (approved grant: U1804141).
