Abstract
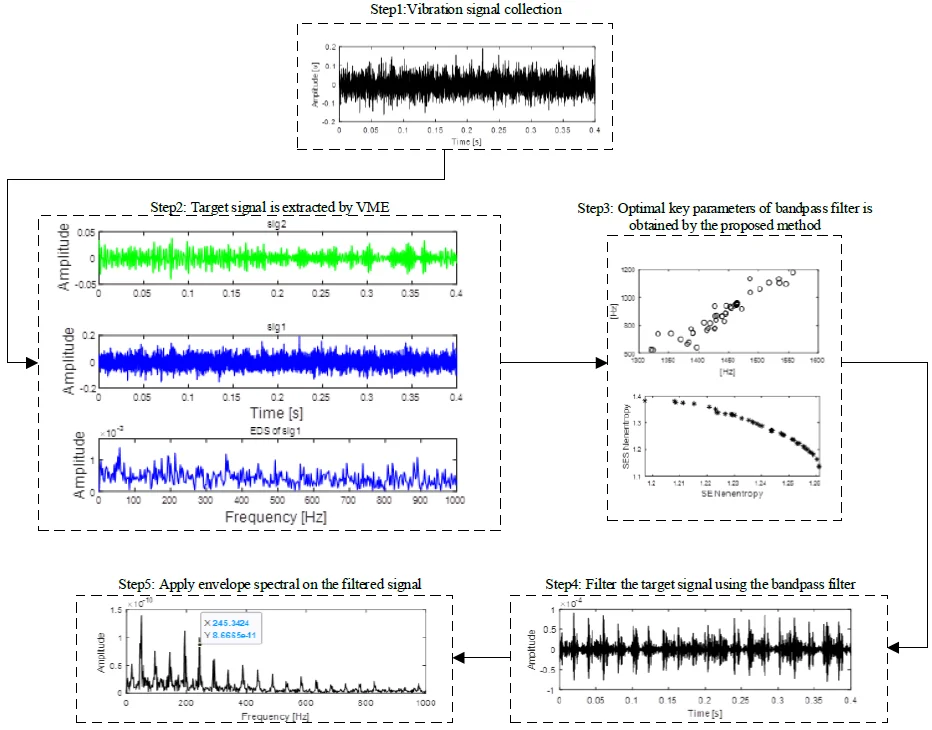
Aiming at solving the difficulty in extracting early weak fault features of rolling element bearing (REB), a feature extraction method by combing variational mode extraction (VME) with multi-objective information fusion band-pass filter (MIFBF) is proposed. This method is based on the advantage of the VME in filtering out the interference signals and the enhancement effect of the MIFBF on the impact characteristic signals. Firstly, VME is used as the signal preprocessing method to filter out the interference noise. Then, the filtered signal is taken as the target signal, and then MIFBF is used to analyze it to obtain the optimal band-pass filter parameters-center Frequency and bandwidth, thereby constructing the optimal band-pass filter. Finally, further filter the target signal based on the constructed optimal band-pass filter and apply envelope demodulation spectral (EDS) analysis on the filtered signal. At last, satisfactory fault feature extraction effect can be achieved. To obtain key parameters of the optimal band-pass filter, this paper proposes a method based on time and frequency domain fusion indexes to balance the extraction of impact characteristics and cyclostationary characteristics while REB failure occurs. Compared with the existed single index based on time domain or frequency domain, better results could be obtained. Effectiveness and superiority of the proposed method are verified through simulation and experiments.
Highlights
- A method basing on time and frequency domain fusion indexes to obtain key parameters of the optimal band-pass filter is proposed in the paper, which could balance the extraction of impact characteristics and cyclostationary characteristics while REB failure occurs.
- A method basing on the advantage of the VME in filtering out the interference signals and the enhancement effect of the MIFBF on the impact characteristic signals is proposed for weak fault feature extraction of rolling element bearing.
- The advantages of the proposed over the other related methods are verified through simualtion and experiment.
1. Introduction
EDS is the most commonly used method for fault diagnosis of REB. Normally, a band-pass filter is needed to be constructed to filter the original signal of REB for better effect of EDS. Amounts of studies focusing on the construction of optimal band-pass filter (OBF) have been arising in recent years and spectral kurtosis (SK) [1] is the landmark of these methods. An adaptive and flexible SK method being from parameter selection is proposed, and its effectiveness in fault feature extraction of REB is verified thorough simulation and experiment [2]. To solve the problem of kurtosis being vulnerable to impulsive noise, a sparsity index called Gini index is introduced as one substitutes for OBF construction [3]. The concepts and definitions of spectral norm and more general spectral are given in paper [4], and their relationship with spectral kurtosis for characterizing non-stationary bearing fault signals is also clarified. Besides, the performance of spectral being compared with kurtosis, smoothness index and Gini index is conducted and presented in paper [5]. Most of the existed methods mainly base on single time-domain estimator or frequency-domain estimator to improve SK. However, single time-domain estimator based methods commonly have the defect of being vulnerable to noise, and fewer harmonics of fault characteristic frequency (FCF) in the envelope demodulation spectral might be induced by using single frequency-domain estimator based methods. Most of the existed methods enhancing the cyclostationary feature of rolling bearing fault vibration signal could obtain harmonics of FCF, which needs to take the FCF of REB as prior knowledge. Unfortunately, there exists errors between the actual FCF and the calculated FCF. A multi-objective information frequency selection method basing on time and frequency indexes is proposed in the paper to solve the above problem. However, the proposed MIFBF method still has difficulty in analyzing the early weak vibration signal of REB. That is, the features of other interferences components also might be enhanced and extracted by MIFBF. Thus, some signal filtering or separation methods are needed as preprocessing program to remove the interference components as much as possible prior to handling the original signal using the proposed MIFBF method.
As a classical time frequency analysis (TFA) method being suitable for non-stationary and nonlinear vibration signal, empirical mode decomposition (EMD) has been used widely in fault diagnosis over the past decade [6-9] and it could decompose complicated signal into several simple modes for better feature extraction result. However, the inherent disadvantages such as mode mixing, false mode and lack of solid mathematical theoretical foundation support limit its application promotion [10]. Besides, since the algorithm basis of EMD is interpolation of local extrema, EMD is very sensitive to noise because the local extrema could be affected by noise [10]. In recent years, kinds of improved EMD methods have been proposed and used in fault diagnosis [11-14]. Although these improved EMD methods overcome the above shortcomings to a certain extent, most of them own the defect of low computational efficiency. Wavelet transform could also be used as the preprocessing program. However, suitable wavelet basis has to be chosen in advance for wavelet transform, which partially restricts its application. Recently, as a variational, non-recursive and noise robustness multi resolution decomposition method, variational mode decomposition (VMD) has better noise robustness performance than EMD in application of vibration signal decomposition, which has been introduced in the field of fault diagnosis [15-17]. Normally, only a specific mode relating to the fault source is in interest in the area of fault diagnosis, and VMD will produce unnecessary computational burden because it extracts all modes of the analyzed signal concurrently through decomposition. Besides, VMD also has the disadvantage of needing to determine the optimal number of modes in advance, and more or less number of mode selection will have great impact on the decomposition results. VME originating from VMD has the same concepts as VMD: the wiener filtering, Hilbert transform and the variational [18], and it could extract a specific mode of the analyzed signal by using the prior knowledge of the analyzed signal, and computation efficiency could be improved greatly compared with VMD.
Based on the above stated, an early weak fault feature extraction method of REB by integrating VME with MIFBF is proposed in the paper. Firstly, input the complicated vibration signal of rolling bearing early weak fault and the constructed reference signal using the prior knowledge into VME model, and the specific mode related to the fault source is extracted. Then, an optimal band pass filter establishment method basing on the fusion index of time and frequency domain for balancing the enhancement of impulsive and cyclostationary characteristics is used to analyze the extracted specific mode. Finally, EDS analysis is applied on the filtered vibration signal and the FCF with its harmonics of the faulty REB are extracted.
2. VME
VME originates from VMD, and it is necessary to introduce the theory of VMD simply.
Mathematical structure of VMD includes main three steps: de-noise the original signal by Wiener filter, then establish single sideband analysis signal by Hilbert transform, and shift frequency to baseband by complex harmonic at last. Bandwidth indication of the th intrinsic mode could be calculated using following equation:
where represents convolution andis the Dirac distribution. The th intrinsic mode function (IMF) [19-20] is defined as amplitude-modulated-frequency-modulated (AM-FM) signal, and is its center frequency. The following optimization problem is used by VMD while decomposing the input signal into modes :
where the first term is used to make the modes compact and the second term is the reconstruction error which should be minimized, and is the weighting parameter for balancing the two terms.
VME supposes the input signal is decomposed into two signals-expected signal and residual signal , namely:
The solution of expected signal could be realized by minimizing the following criteria:
Construct a filter with the following frequency response to filter the input signal to minimize the problem of spectral overlap between the expected signal and the residual signal :
The penalty function as following is introduced in order to further minimize the spectral overlap problem between the expected signal and the residual signal :
where is the impulse response of the constructed filter. Based on the above, the solution of expected signal could be classified as the following constraint minimization problem:
where is the parameter balancing and , which is selected as 0.5 in this study. The enhanced Lagrangian function as shown in following formula is used to solve the reconstruction constraint problem as encountered in Eq. (7):
where is the Lagrange Multiplier. Let , in which is the Fourier transform of , and . The above equation could be simplified as following:
The expected signal in th iteration could be obtained by the following equation:
The first variable is eliminated based on , and the above formula could be further simplified as following:
where represents the number of iterations. Similarly, and could be expressed in the following two simplified expressions:
The extraction results of VME are the expected signal and residual signal , so could be ignored. The solution expressions of and could be rewritten as follows thorough algebraic operations:
where the Lagrange Multiplier could be updated using the following equation:
3. MIFBF
Wavelet transform is used for signal processing widely and the calculation equation could be expressed as following:
where represents the selected mother wavelet function, and with is its scale parameter and translation parameter. is the signal to be analyzed. is the complex conjugate of the mother wavelet function. The following equation is the frequency domain expression of Eq. (17):
where represents the inverse Fourier transform, and the Fourier transform of and are represented by and . Selection of the basis function has an important influence on the analysis result: the better analysis result could be obtained with the closer the basis function to the shape of the target extraction signal; and vice versa. Based on this ideology, Anti-symmetric real Laplace wavelet filter (ARLW) [21] has been proved to be fit for analyzing bearing impulse vibration signal while fault arises, and time-domain and corresponding frequency domain of ARLW could be calculated by the following two equations:
where and represent the bandwidth and center frequency of the designed band-pass filter. Here, the analyzed signal using ARLW is filtered by a band-pass filter with band-pass interval , and it could be expressed as following equation:
Subsequently, squared envelope (SE) [22] and squared envelope spectrum (SES) [23] of the filtered signal could be obtained:
Some indicators basing on either SE [22] or SES [23] were proposed to select the optimal parameters and for construction the optimal wavelet filter in previous work. However, the optimal result could not be guaranteed using single indicator as the above discussed, and indicator basing on multi-objective optimization for balancing the extraction of impulse and cyclostationary characteristics of bearing should be designed. So the combination consideration of SE and SES which is named the negentropy [23] of SE and SES as being shown in Eqs. (24) and (25) are proposed to be taken as the objectives for seeking optimal band pass filter parameters to characterize both the cyclostationarity and impulsiveness:
where represent the cyclic frequency. The multi-objective grey wolf optimizer (MOGWO) algorithm [24-25] is used to optimize the calculation process of Eqs. (24) and (25).
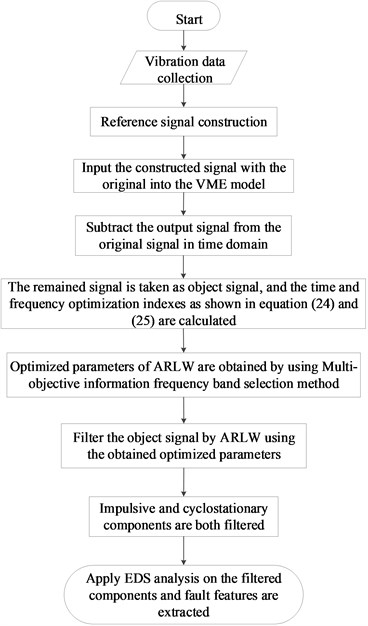
Fig. 1Flow chart of the proposed method
4. Flow chart of the proposed method
Flow chart of the proposed method is shown in Fig. 1 and its details are as follows:
Step 1: Vibration signal of REB weak fault is collected.
Step 2: Sine reference signal is constructed with known rotation speed of the diagnosis machinery.
Step 3: Input the constructed signal with the original signal into VME calculation model, and output signal of VME is obtained.
Step 4: Subtract the obtained output signal in step 3 from the original signal in time domain.
Step 5: The remained components are taken as object signal and selected for further analysis, and the time-domain optimization index and frequency-domain optimization index as shown in Eq. (24) and Eq. (25) are used commonly as the optimization indexes of the proposed multi-objective information frequency band selection method.
Step 6: Optimized parameters of ARLW that is center frequency and bandwidth are obtained by using the proposed MIFBF method.
Step 7: Construct a band-pass filter using the obtained optimized parameters: center frequencyand bandwidth .
Step 8: Filter the remained components in step 4 using the constructed band-pass filter, and the impulsive and cyclostationary components are both filtered and retained due to the using of time-domain and frequency-domain optimization indexes simultaneously.
Step 9: Apply EDS on the filtered signal and satisfactory fault feature results are extracted.
5. Simulation
Simulation is carried out in this section to verify the feasibility of the proposed method. A rolling bearing impulsive signal [26], a sine signal and their combined signal are presented in Fig. 2(a): sig1 is inner race fault signal of REB, sig2 is a sine signal and their combination is presented in the bottom figure. Firstly, a sine reference signal same as the sine signal sig2 as shown in Fig. 2(a) is constructed. Then input the reference signal with the combined signal into VME calculation model and the output signals are given in Fig. 2(b), in which the above figure is the object extraction signal and the below figure could be reviewed as the inner race fault signal, and it could be found that satisfactory extraction results could be obtained using VME without noise interference.
Fig. 2Simulation combination signal without noise extracted using VME
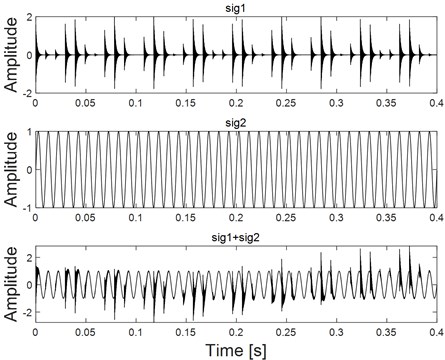
a) Different components with their combination
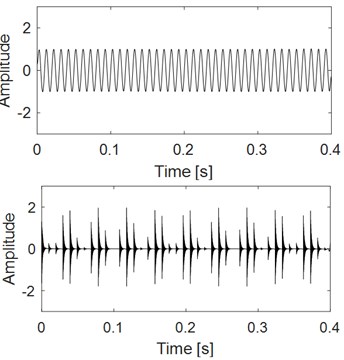
b) Extraction results of the combination signal using VME
Fig. 3Combined signal with different degree of noise and the corresponding EDS results
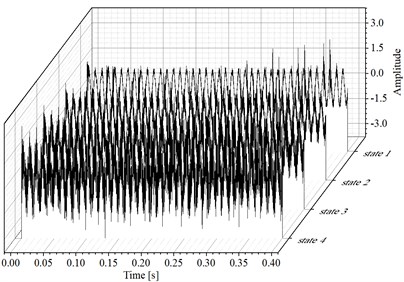
a) Combined signal shown in Fig. 2(a) with different degree of noise
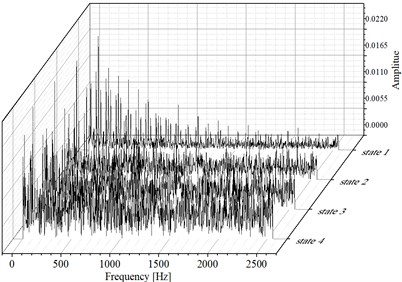
b) EDS results of the signals as shown in Fig. 3(a)
Fig. 4Analysis results of the combined signal corresponding to the four states as shown in Fig. 3(a) using VME
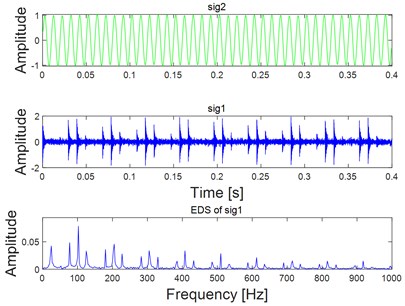
a) Analysis results of the combined signal corresponding to state 1 as shown in Fig. 3(a) using VME
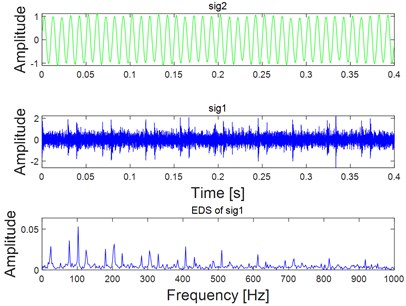
b) Analysis results of the combined signal corresponding to state 2 as shown in Fig. 3(a) using VME
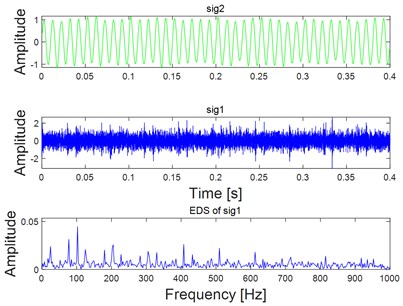
c) Analysis results of the combined signal corresponding to state 3 as shown in Fig. 3(a) using VME
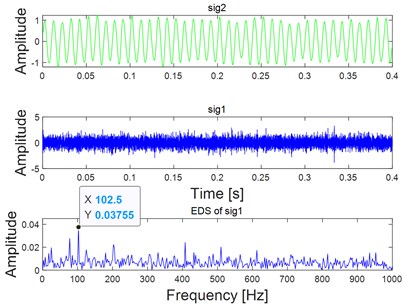
d) Analysis results of the combined signal corresponding to state 4 as shown in Fig. 3(a) using VME
To verify the noise robustness of the proposed method, different degrees of white noise are added into the combined signal as shown in Fig. 2(a), and their corresponding time-domain waveform diagram is shown Fig. 3(a). EDS of the signal shown in Fig. 3(a) are given in Fig. 3(b) basing on which the fault feature would become unidentified with the increasing interference of white noise. Fig. 4 gives the feature extraction results of the signals shown in Fig. 3(a) based on VME directly, and the noise robustness of VME could be verified by the final EDS analysis results as shown in Fig. 4. As for the fault diagnosis of REB, there should be harmonics of FCF in the ideal spectrum structure of EDS. In addition, there also should be modulation when inner race fails. However, neither of the above two features could be observed on the last figure of Fig. 4, and the reason is that feature extraction effect using VME directly would not be ideal when the noise interference reaches a certain level.
Apply step 6 to step 9 of the proposed method as described in Fig. 1 on the analysis signal sig1 in Fig. 4(d), and the corresponding analysis result is shown in Fig. 5. The parameters of MOGWO are set same as reference [25], and the calculated values of SE Nenentropy and SES Nenentropy are presented in Fig. 5(a) after iteration. Then the average value of SE and SES as shown in Fig. 5(a) is calculated and the maximum average value of 1.36 is selected as the best optimal one. Subsequently, the optimal couple of and are identified as 3826 Hz and 602 Hz respectively as shown in Fig. 5(b). Filter the sig1 as shown in Fig. 4(d) by ARLW using the obtained optimal parameters and , and time domain waveform of the filtered signal is shown in Fig. 5(c) from which the impulsive and cyclostationary characteristic could be identified evidently. At last, apply EDS on the filtered signal and the corresponding result is shown on Fig. 5(d), and it can be seen that both the harmonic frequency of the FCF and modulation phenomenon are extracted basing on the last EDS result, which verifies the superiority of the proposed method.
Fig. 5Analysis results of the target impulse components sig1 as shown in Fig. 4(d) using the proposed multi-objective information frequency band selection method
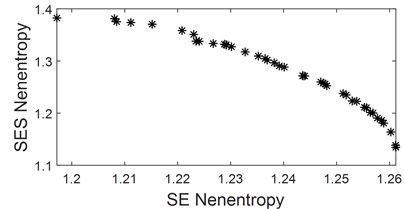
a) Calculated optimal indexes of the analysis signal sig1 as shown in Fig. 4(d)
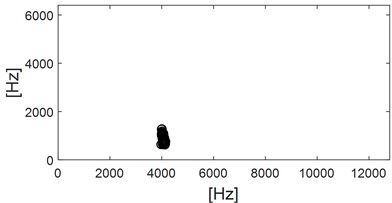
b) Calculated optimal parameters of ARLW basing the obtained results as shown in Fig. 5(a)
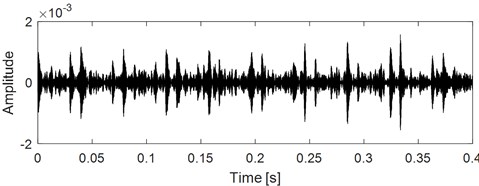
c) Time domain waveform of the filtered signal by ARLW using the calculated optimal parameters as shown in Fig. 5(b)
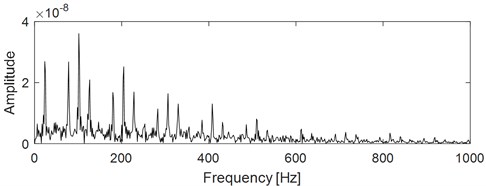
d) EDS result of the signal as shown in Fig. 5(c)
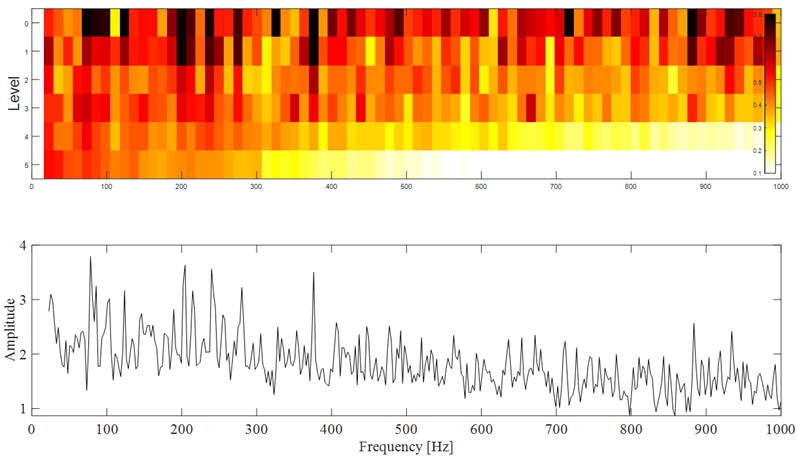
Envelope analysis is one of the most advantageous methods for rolling element bearing diagnostics, but finding a suitable frequency band for demodulation has been a substantial challenge for a long time. Introduction of the SK and Kurtogram solved this problem to some extent, but in situations where the ratio of signal to noise (SNR) is very low or in the presence of non-Gaussian noise, these methods will fail, and the Autogram [22] method overcomes the above shortcomings, which is used here for comparison to verify the advantage of the proposed method. Apply Autogram on the combined signal corresponding to state 4 as shown in Fig. 3(a) and the results are presented in Fig. 6, in which though the FCF could be extracted roughly, the effect is far less than the proposed method.
Fig. 6Analysis results of the combined signal corresponding to state 3 as shown in Fig. 3(a) using autogram
6. Experiment
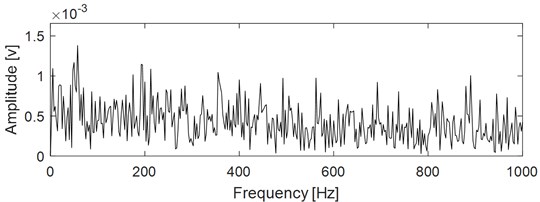
The analyzed vibration signal is collected from accelerated bearing life test, which is provided by Hangzhou Bearing Test & Research Center. It simultaneously hosts four REBs on one shaft driven by an AC motor and coupled by rubber belts. The test rig is shown in Fig. 7. A new bearing will be installed if one is failed. Select one of the test bearings as the study object. The parameters the fault characteristic frequencies of the selected analyzed test rolling bearing are shown in Table 1 and Table 2 respectively. The inner race fault of the selected test rolling bearing is shown in Fig. 8. Same as reference [26], the vibration data at 2297th minute over one of the selected test bearing’ whole life is used for analysis using the proposed method. Kurtosis index curve over the full life cycle of the analyzed bearing is shown in Fig. 9, and time domain waveform of the vibration data at 2297th minute is given in Fig. 10 from which the impulse characteristic is buried by the strong background noise. EDS analysis result of the analyzed signal is shown in Fig. 11, and the distribution of the spectral lines is chaotic from which the FCF of the test bearing could not identified.
Table 1Parameters of the test rolling bearing
Type | Ball number | Ball diameter (mm) | Pitch diameter (mm) | Contact angle | Motor speed (rpm) | Load (kN) |
6307 | 8 | 13.494 | 58.5 | 0 | 3000 | 12.744 |
Table 2Fault characteristic frequencies of test rolling bearing
50 | 19 | 102 | 246 | 153 |
Fig. 7The test rig
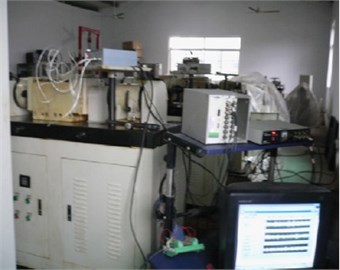
Fig. 8Inner race fault of the test rolling bearing
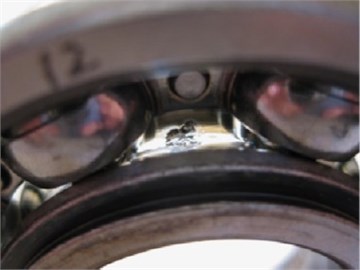
Fig. 9Kurtosis index curve over the full life cycle of the test bearing
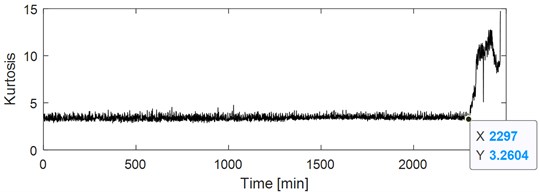
Fig. 10Time domain waveform of test bearing early weak fault
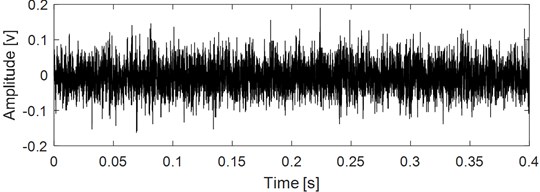
Fig. 11EDS of the signal as shown in Fig. 10
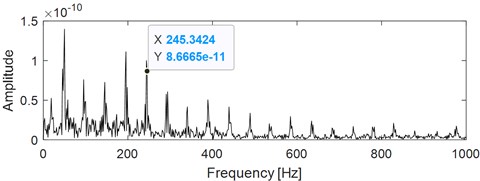
As for VME based fault feature extraction of REB, the ideal reference signal is to establish an impact reference signal with the same frequency as the FCFs of REB. However, there often exists error between the actual FCF and the theoretical FCF due to installation and manufacturing errors and other reasons, which will have a great impact on the extraction effect of VME. Therefore, a sinusoidal reference signal could be established based on the rotational speed of the rotating shaft where the bearing is located, and input it with the original weak fault signal of bearing into VME model. The expected output signal of VME is the rotation frequency, harmonic frequency and other noise components. Then the expected output signal is subtracted from the original signal in time domain, and the residual signal is the impulse characteristic component of bearing. Based on the above stated and the flow chart of the proposed method as described in Fig. 1, construct a sine reference signal with frequency same as the known rotating frequency, that is 50 Hz. The amplitude of the reference signal could be selected as half of the RMS of the signal shown in Fig. 10 (the RMS of the signal shown in Fig. 10 is about 0.11 through calculation), and its phase is set as 0. Then input the reference signal with the original signal as shown in Fig. 10 into VME model, and the final extraction result is shown in Fig. 12: sig2 is the VME model extraction signal, that is, the sine, sine harmonics and other interference components in the original signal, and sig1 is the impact component buried in the original signal. Comparing sig1 with the original signal, the impulse characteristics are enhanced obviously, because the kurtosis index of the former is about twice that of the latter through calculation. The EDS analysis result of sig1 is shown the below figure of Fig. 12, from which the inner race FCF still could not be extracted. In order to obtain good EDS analysis results, it is usually necessary to construct a band-pass filter based on the optimal parameters, namely the center frequency and bandwidth, to band-pass filter the rolling bearing signal, and then perform envelope spectrum analysis on the filtered signal. As proposed in Eqs. (24) and (25), and the calculated values of SE Nenentropy and SES Nenentropy are presented in Fig. 13(a) after iteration, and parameters of MOGWO are set same as reference [24]. Then the average value of SE and SES as shown in Fig. 13(a) is calculated and the maximum average value of 1.32 is selected as the best optimal one. Subsequently, the optimal couple of and are identified as 1473 Hz and 962 Hz respectively as shown in Fig. 13(b). Filter the impulse component sig1 as shown in Fig. 12 by ARLW using the obtained optimal parameters and , and the time domain waveform of the filtered signal is shown in Fig. 13(c) from which the impulsive and cyclostationary characteristic could be identified evidently. At last, apply EDS on the filtered signal and corresponding result is shown on Fig. 13(d) basing on which not only the inner race FCF with its harmonics are extracted, but also the modulation frequency that is rotating frequency is also extracted.
Fig. 12Analysis results of the signal as shown in Fig. 10 using VME
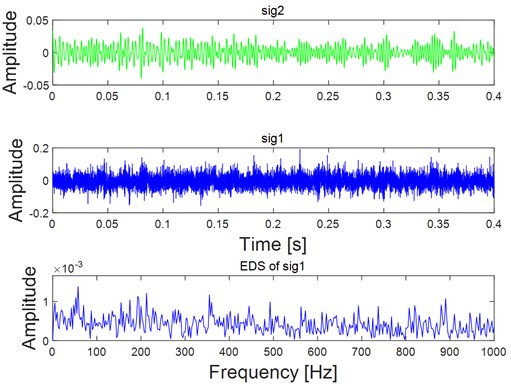
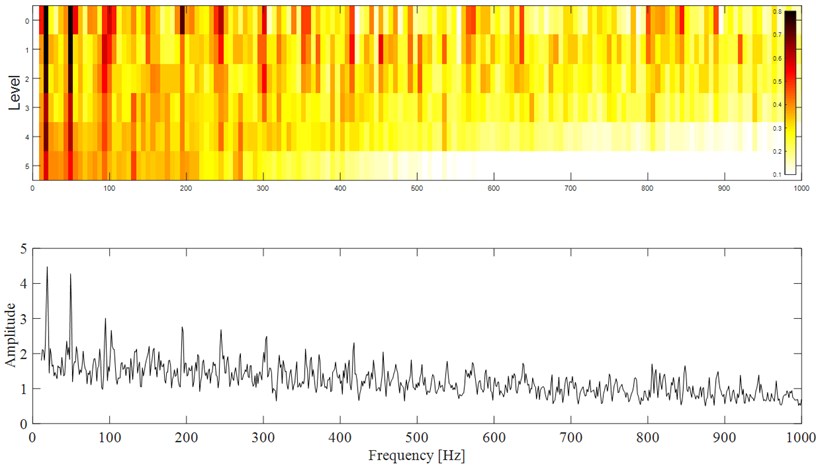
Same as simulation, Autogram is applied on the original signal as shown in Fig. 10 to further highlight the superiority of the proposed method, and the corresponding analysis result is shown in Fig. 14: though the fault characteristic frequency 245 Hz is extracted, both its harmonics and the side frequency are not extracted.
Fig. 13Analysis results of the target impulse components sig1 as shown in Fig. 12 using the proposed Multi-objective information frequency band selection method
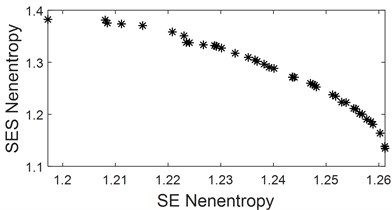
a) Calculated optimal indexes of the analysis signal sig1 as shown in Fig. 12
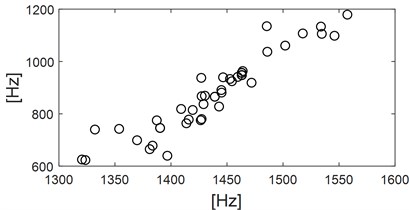
b) Calculated optimal parameters of ARLW basing the obtained results as shown in Fig. 13(a)
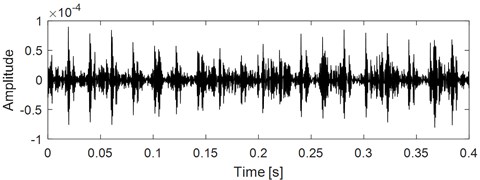
c) Time domain waveform of the filtered signal by ARLW using the calculated optimal parameters as shown in Fig. 13(b)
d) EDS of the signal as shown in Fig. 13(c)
Fig. 14Analysis results of the original signal as shown in Fig. 10 using autogram
7. Conclusions
VME originating from VMD is used for extracting the target impulse component with the prior knowledge of the analyzed signal, and it has advantage of much higher calculation ratio compared with VMD. However, it is often difficult to achieve satisfactory results using VME alone in the case of particularly severe noise interference, and it is necessary to construct a band-pass filter based on the optimal parameters to further handle the extracted signal by VME. Most of the existed SK and improved methods originating from SK have the disadvantage of basing on time domain or frequency domain index, and the fusion indexes of time and frequency domain are used to balance the enhancement of impulsive and cyclostationary characteristics to establish the best band pass filter of ARLW in the paper. Besides, MOGWO is introduced into the parameters solution to increase the calculation ratio of ARLW. Finally, EDS analysis is applied on the filtered vibration signal and the FCF with its harmonics of fault REB are extracted. Effectiveness of the proposed method is verified through simulation and experiments. Besides, its advantage over the related method such as Autogram is also presented.
\
References
-
J. Antoni, “The spectral kurtosis: a useful tool for characterizing non-stationary signals,” Mechanical Systems and Signal Processing, Vol. 20, No. 2, pp. 282–307, 2006, https://doi.org/10.1016/j.ymssp.2004.09.001
-
Y. Hu, W. Bao, X. Tu, F. Li, and K. Li, “An adaptive spectral kurtosis method and its application to fault detection of rolling element bearings,” IEEE Transactions on Instrumentation and Measurement, Vol. 69, No. 3, pp. 739–750, Mar. 2020, https://doi.org/10.1109/tim.2019.2905022
-
Y. Miao, M. Zhao, and J. Lin, “Improvement of kurtosis-guided-grams via Gini index for bearing fault feature identification,” Measurement Science and Technology, Vol. 28, No. 12, p. 125001, Dec. 2017, https://doi.org/10.1088/1361-6501/aa8a57
-
D. Wang, “Spectral L2/L1 norm: A new perspective for spectral kurtosis for characterizing non-stationary signals,” Mechanical Systems and Signal Processing, Vol. 104, pp. 290–293, May 2018, https://doi.org/10.1016/j.ymssp.2017.11.013
-
D. Wang, “Some further thoughts about spectral kurtosis, spectral L2/L1 norm, spectral smoothness index and spectral Gini index for characterizing repetitive transients,” Mechanical Systems and Signal Processing, Vol. 108, pp. 360–368, Aug. 2018, https://doi.org/10.1016/j.ymssp.2018.02.034
-
C. Junsheng, Y. Dejie, and Y. Yu, “The application of energy operator demodulation approach based on EMD in machinery fault diagnosis,” Mechanical Systems and Signal Processing, Vol. 21, No. 2, pp. 668–677, Feb. 2007, https://doi.org/10.1016/j.ymssp.2005.10.005
-
F. Wu and L. Qu, “Diagnosis of subharmonic faults of large rotating machinery based on EMD,” Mechanical Systems and Signal Processing, Vol. 23, No. 2, pp. 467–475, Feb. 2009, https://doi.org/10.1016/j.ymssp.2008.03.007
-
Z. Shen, X. Chen, X. Zhang, and Z. He, “A novel intelligent gear fault diagnosis model based on EMD and multi-class TSVM,” Measurement, Vol. 45, No. 1, pp. 30–40, Jan. 2012, https://doi.org/10.1016/j.measurement.2011.10.008
-
R. Ricci and P. Pennacchi, “Diagnostics of gear faults based on EMD and automatic selection of intrinsic mode functions,” Mechanical Systems and Signal Processing, Vol. 25, No. 3, pp. 821–838, Apr. 2011, https://doi.org/10.1016/j.ymssp.2010.10.002
-
T. Guo and Z. Deng, “An improved EMD method based on the multi-objective optimization and its application to fault feature extraction of rolling bearing,” Applied Acoustics, Vol. 127, pp. 46–62, Dec. 2017, https://doi.org/10.1016/j.apacoust.2017.05.018
-
J. Wang, G. Du, Z. Zhu, C. Shen, and Q. He, “Fault diagnosis of rotating machines based on the EMD manifold,” Mechanical Systems and Signal Processing, Vol. 135, p. 106443, Jan. 2020, https://doi.org/10.1016/j.ymssp.2019.106443
-
Y. Cheng, Z. Wang, B. Chen, W. Zhang, and G. Huang, “An improved complementary ensemble empirical mode decomposition with adaptive noise and its application to rolling element bearing fault diagnosis,” ISA Transactions, Vol. 91, pp. 218–234, Aug. 2019, https://doi.org/10.1016/j.isatra.2019.01.038
-
S. Park, S. Kim, and J.-H. Choi, “Gear fault diagnosis using transmission error and ensemble empirical mode decomposition,” Mechanical Systems and Signal Processing, Vol. 108, pp. 262–275, Aug. 2018, https://doi.org/10.1016/j.ymssp.2018.02.028
-
L. Wang and Y. Shao, “Fault feature extraction of rotating machinery using a reweighted complete ensemble empirical mode decomposition with adaptive noise and demodulation analysis,” Mechanical Systems and Signal Processing, Vol. 138, p. 106545, Apr. 2020, https://doi.org/10.1016/j.ymssp.2019.106545
-
J. Li, X. Cheng, Q. Li, and Z. Meng, “Adaptive energy-constrained variational mode decomposition based on spectrum segmentation and its application in fault detection of rolling bearing,” Signal Processing, Vol. 183, p. 108025, Jun. 2021, https://doi.org/10.1016/j.sigpro.2021.108025
-
Z. Xu, C. Li, and Y. Yang, “Fault diagnosis of rolling bearing of wind turbines based on the variational mode decomposition and deep convolutional neural networks,” Applied Soft Computing, Vol. 95, p. 106515, Oct. 2020, https://doi.org/10.1016/j.asoc.2020.106515
-
X. Chen, Y. Yang, Z. Cui, and J. Shen, “Vibration fault diagnosis of wind turbines based on variational mode decomposition and energy entropy,” Energy, Vol. 174, pp. 1100–1109, May 2019, https://doi.org/10.1016/j.energy.2019.03.057
-
M. Nazari and S. M. Sakhaei, “Variational mode extraction: a new efficient method to derive respiratory signals from ECG,” IEEE Journal of Biomedical and Health Informatics, Vol. 22, No. 4, pp. 1059–1067, Jul. 2018, https://doi.org/10.1109/jbhi.2017.2734074
-
J. Gilles, “Empirical wavelet transform,” IEEE Transactions on Signal Processing, Vol. 61, No. 16, pp. 3999–4010, Aug. 2013, https://doi.org/10.1109/tsp.2013.2265222
-
K. Dragomiretskiy and D. Zosso, “Variational mode decomposition,” IEEE Transactions on Signal Processing, Vol. 62, No. 3, pp. 531–544, Feb. 2014, https://doi.org/10.1109/tsp.2013.2288675
-
K. Feng, Z. Jiang, W. He, and Q. Qin, “Rolling element bearing fault detection based on optimal antisymmetric real Laplace wavelet,” Measurement, Vol. 44, No. 9, pp. 1582–1591, Nov. 2011, https://doi.org/10.1016/j.measurement.2011.06.011
-
A. Moshrefzadeh and A. Fasana, “The autogram: an effective approach for selecting the optimal demodulation band in rolling element bearings diagnosis,” Mechanical Systems and Signal Processing, Vol. 105, pp. 294–318, May 2018, https://doi.org/10.1016/j.ymssp.2017.12.009
-
J. Antoni, “The infogram: Entropic evidence of the signature of repetitive transients,” Mechanical Systems and Signal Processing, Vol. 74, pp. 73–94, Jun. 2016, https://doi.org/10.1016/j.ymssp.2015.04.034
-
S. Mirjalili, S. Saremi, S. M. Mirjalili, and L. D. S. Coelho, “Multi-objective grey wolf optimizer: A novel algorithm for multi-criterion optimization,” Expert Systems with Applications, Vol. 47, pp. 106–119, Apr. 2016, https://doi.org/10.1016/j.eswa.2015.10.039
-
X. Gu, S. Yang, Y. Liu, R. Hao, and Z. Liu, “Multi-objective informative frequency band selection based on negentropy-induced grey wolf optimizer for fault diagnosis of rolling element bearings,” Sensors, Vol. 20, No. 7, p. 1845, Mar. 2020, https://doi.org/10.3390/s20071845
-
H. Wang, J. Chen, and G. Dong, “Feature extraction of rolling bearing’s early weak fault based on EEMD and tunable Q-factor wavelet transform,” Mechanical Systems and Signal Processing, Vol. 48, No. 1-2, pp. 103–119, Oct. 2014, https://doi.org/10.1016/j.ymssp.2014.04.006
About this article
The research is supported by the National Natural Science Foundation (approved grant: U1804141) and the Doctoral Research Funds of Zhengzhou University of Light Industry (approved grants: 2015BSJJ029, 2015BSJJ031).
