Abstract
Acoustic properties of resonators installed in vehicle intake system are influenced by the high-speed airflow passing through, which causes errors between practical application and bench tests. In this paper, a test bench with airflow for measuring the resonator transmission loss is developed based on the principle of two-load method. Equipment types are selected and parameters calculation is presented. Effects of sound source protection devices on the performance of sound source are studied experimentally. A resistance resonator and several dissipative mufflers are mounted at the outlet of the vortex air pump to reduce airflow noise and verified to be effective. Finally, the transmission loss of a multi-chamber perforated resonator is measured with the developed test bench and effects of airflow on resonator acoustic properties are analyzed.
1. Introduction
In order to eliminate the broad band noise excited by turbocharger, multi-chamber perforated resonators are installed in vehicle intake system, in which sound wave propagation is usually accompanied with high speed airflow, especially at the outlet of the turbocharger. Neglect of the airflow influence on resonator acoustic performance at high Mach numbers will bring great error. Therefore, it has now become an essential requirement to construct a whole set of test bench with high test accuracy but relatively simple structure, not only for experimental design and optimization of resonators but also for validation of resonator performance prediction theories.
TL (transmission loss) is the most widely-used index in theories and experiments for evaluating the acoustic characteristics of a resonator, representing its inherent property. The measurement methods of resonator TL include acoustic decomposition method [1], two-source method [2] and two-load method [3]. Artificial non-reflection end is hard to obtain in tests based on the acoustic decomposition method and the two-source method will result in much longer pipelines with low practicability. Traditional two-load method test devices can accurately measure the resonator TL, while distance between microphones is not adjustable and the main pipe diameter often mismatches the resonator inlet/outlet, requiring a lot more experimental preparation time. Moreover, the resonator TL and pressure drop are usually tested separately according to the existing literature [4] and cannot ensure the consistency of experimental conditions. Complicated experimental structure will also cause flow regeneration noise.
Hence, the objective of the present study is to develop a high-efficiency test bench with airflow based on the two-load method for measuring the resonator TL and pressure drop at the same time. Among the test equipment, the fan speed can be adjusted adaptively, the wind source noise isolation device and the diversion pipe can reduce the fan noise and airflow interference in the main pipe, thus overcoming the low-accuracy problem of the existing test benches. Through adjusting the distance between microphones, the facility’s effective measurement frequency range can be changed. The TL curves of a designed multi-chamber perforated resonator are measured under different velocity of airflow, providing experimental basis for resonator performance prediction theories.
2. Theory basis of transmission loss test using two-load method
Based on the transfer matrix method, two-load method is to obtain two equations which represent the sound pressure amplitude relationship between incident and transmitted wave of the resonator by changing the impedance condition at outlet. Fig. 1 shows the two different outlet conditions of two-load method. Za and Zb are two different acoustic impedances of the outlet. Both the tube between microphone 1 and 2 and the tube between microphone 3 and 4 are straight tubes. The resonator is installed between microphone 2 and 3.
Fig. 1Sketch of two-load method

a)

b)
The corresponding transfer matrix can be expressed as:
where pi and ui are the sound pressure and particle velocity of microphones; Aij, Bij, Cij, Dij are the transfer parameters of the corresponding parts. The relationship between microphone 2 and 3 in Fig. 1(a) can be written as:
The relationship between microphone 2 and 3 in Fig. 1(b) can be written as:
Combining Eq. (4) and Eq. (5), parameters A23, B23, C23 and D23 can be obtained. The TL of the resonator can be expressed as:
where ρ0 is the density of air; c0 is the sound speed in air; Si and S0 are the section area of the inlet and outlet.
3. Development of test bench with airflow based on the two-load method
Fig. 2 is the schematic diagram of the test bench with airflow for resonator acoustic properties measurement. This test bench is mainly composed of four systems, which are respectively the wind source system, the sound source system, the test system and the noise control system.
The wind source system is composed of an adjustable-speed fan and a flow detection/control system, among which the flowmeter is used for real-time flow monitoring and the frequency converter for flow rate adjustment. The sound source system provides white noise and the test system collects sound pressure signals and pressure signals at measuring points in the pipeline for TL and pressure drop calculation. A broadband resonator and a dissipative muffler at the end of the pipeline are aimed at realizing a different testing condition based on the two-load method. In order to reduce the serious impacts of airflow noise and sound source noise radiation on testing precision, a resonator and four dissipative mufflers are mounted at the outlet of fan and layers of sound-absorbing cotton are covered on the speaker box. The mufflers and sound-absorbing cotton constitute the noise control system.
Fig. 2Sketch of resonator acoustic characteristics test bench with airflow

3.1. Source system design
The wind source system is used to provide steady airflow, mainly composed of fan frequency converter, a flowmeter and their control system. The vortex air pump with high exhaust back pressure and large power is selected as the wind source. The vortex air pump adopts small blades with low flow resistance as well as low airflow noise compared with the centrifugal fan. Three-phase 380 V power supply is used to provide a maximum flow rate up to 350 m3/h. The frequency converter controls the fan flow rate by changing the frequency in the range of 0-50 Hz. For real-time monitoring of air flow in the pipeline, a VSF (vortex shedding flowmeter) is installed with the advantage of low pressure drop, wide testing range and high precision. Real-time control and monitoring of the airflow are realized through a written program.
The sound source system mainly consists of a speaker box, a power amplifier, a data acquisition system and a computer installed with LMS Test. Lab. The speaker in the speaker box requires compact structure and a relatively smooth response in the frequency range of 100 Hz-4000 Hz, thus Huiwei SS6N speaker is selected., An iron enclosed speaker box with suitable size is designed to ensure sound propagation sealed in the pipeline without leakage. The noise is expected to propagate towards the main pipe through the draft tube.
When the vortex fan operates at a high flow rate, the airflow temperature will reach up to 50 °C and the pipeline will be filled with high temperature and high pressure air. In order to reduce its influence on the sound source, special high temperature resistant film is applied at the junction of the sound source branch and the main pipe for wind protection and heat insulation, see Fig. 4(a). The 0.0125 mm thickness polyimide film has good sound transmission performance and ensures stable long-time work under high temperature and pressure. The sound source is connected to the measuring main pipe through the T-tube by the side branch, see Fig. 3(c). Since the polyimide film and the T-tube may hinder sound wave propagation, SPL (sound pressure level) tests before and after installation were carried out respectively in the semi-anechoic room at Tongji University.
Through comparison of the SPL curves in Fig. 3(b), (d), it can be analyzed that the film slightly attenuates sound in the whole frequency band, especially in the range below 1000 Hz. The T-tube attenuates noise below 1600 Hz while enhances noise above 1600 Hz. Addition of the thin film and the T-tube reduced the overall SPL by 5 dB and 6 dB respectively, which is acceptable during the whole measurement process. Test results also indicate that the selected high temperature resistant film meets the requirements of sound transmission performance.
Fig. 3Sound source protection and connection devices
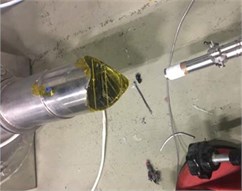
a) Polyimide film
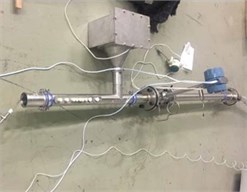
c) T-tube
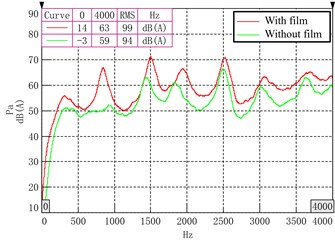
b) Comparison of SPLs with and without the film
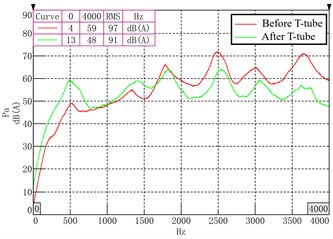
d) Comparison of SPLs before and after the T-tube
3.2. Test system design
The test system consists of an LMS SCADAS III 305 data acquisition system, four G.R.A.S 1/2 Free field pre-polarization microphones and the designed test pipeline. The sampling frequency in the test was 12,000 Hz. The flowmeter, the T-tube connected to the sound source and microphone slots are installed on the first part of the main pipe, and the second part is used to install the microphones and pressure sensors. The end of the resonator joint adopts a 45 degree bevel for adapting resonators with different duct diameters. Multiple groups of microphone distance are set on the main pipe, which can be used to obtain different TL measurement ranges.
To reduce the test errors, two requirements should be met during design process:
(1) For one-dimensional wave propagation in the pipes, the inner diameter should be in accordance with the first diametric mode, which can be expressed as [5]:
where λ is the wavelength and d is the inner diameter of the measuring pipe.
(2) According to the ASTM Standard E1050-12, the relationship between the distance of a pair of microphones and the maximum measuring frequency should meet the condition as:
where l is the distance between microphones; c0 is the sound speed and fm is the maximum measuring frequency. Bodén and Ǻbom suggest that [6]:
where k is the wave number.
Therefore, in order to meet the error reduction requirements, the effective frequency range can be calculated, which is shown in Table 1.
Table 1Effective frequency range in different cases
Distance l (mm) | Maximum frequency fm (Hz) | Bodén frequency range (Hz) | Inner diameter frequency (Hz) | Effective frequency range (Hz) |
15 | 11333 | [1133, 9067] | 3553 | [1133, 3553] |
20 | 8500 | [850, 6800] | [850, 3553] | |
25 | 6800 | [680, 5400] | [680, 3553] | |
35 | 4857 | [486, 3886] | [486, 3553] | |
40 | 4250 | [425, 3400] | [425, 3400] | |
55 | 3090 | [309, 2472] | [309, 2472] | |
60 | 2833 | [283, 2267] | [283, 2267] | |
80 | 2125 | [213, 1700] | [213, 1700] |
3.3. Noise control system design
The noise control system consists of the sound source mufflers, terminal mufflers and the sound-absorbing cotton. Sound-absorbing cotton is mainly used to reduce the influence of noise radiation on measurement accuracy. A MCPR (multi-chamber perforated resonator) is designed and 3D printed to eliminate the airflow noise, which has a TL amplitude up to 60 dB in the frequency band of 1000 Hz-3000 Hz. However, it provides basically no noise reduction effect below 1000 Hz. Considering the design and processing cost, four general dissipative mufflers are added to cover the shortage. The acoustic performance of these two mufflers was tested on a bench without airflow, see Fig. 4(a). Test comparison of the controlled airflow noise and the sound source noise is shown in Fig. 4(b). SPL of sound source is 62.91 dB, 19.8 dB higher than the airflow noise, meeting the criterion that SPL of the sound source signal needs to be more than 10dB higher than the background sound pressure level. The overall noise agrees well with the sound source noise curve, which indicates the controlled airflow noise has little influence on test results.
The two different load conditions of the outlet should not be similar, otherwise the results will not be representative. In the test, one condition of the outlet is open end, and the other condition is end linked with a MCPR and a dissipative muffler.
Fig. 4Test results of noise control system
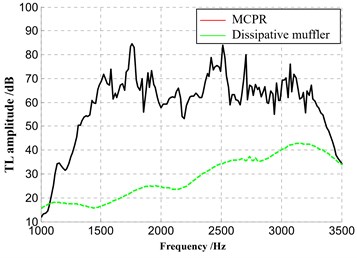
a) TL test results of the MCPR and the dissipative muffler
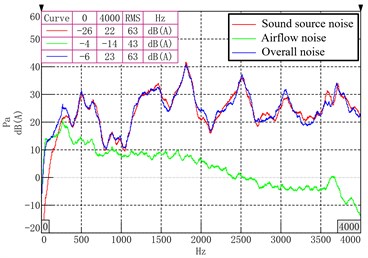
b) Effect of airflow noise
4. Acoustic performance measurement of resonators with mean flow
A designed multi-chamber perforated resonator was processed with nylon by rapid prototyping, its structure parameters are listed in Table 2. Acoustic performance with mean flow of the resonator was measured on the developed test bench in the semi-anechoic room, see Fig. 5(a). The TL curves of the MCPR at various flow rates in Fig. 5(b) indicate that the airflow will cause slight shift in resonant frequency and reduce the TL amplitude. Prediction of resonator properties should consider airflow especially at high flow rates. The effective attenuation range of the tested MCPR is [1200 Hz, 2500 Hz], taking TL higher than 20 dB as a reference, suitable for controlling high frequency noise.
Table 2Structure parameters of the tested MCPR
Internal diameter of the main duct (mm) | 57 | Hole diameter (mm) | 4 |
Internal diameter of chambers (mm) | 90 | Hole number | 60×4 |
Number of resonant chambers | 4 | Hole depth (mm) | 3 |
Thickness of annular wall (mm) | 2 | Chamber width (mm) | [20, 28, 42, 60] |
Fig. 5Acoustic performance measurement of resonators with mean flow
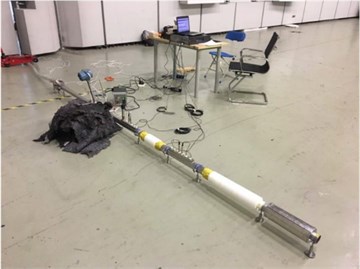
a) Testing site
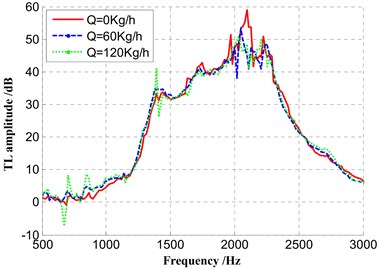
b) TL of the MCPR at various flow rates
5. Conclusions
In this paper, a test bench with airflow for resonator acoustic performance measurement is developed based on the principle of two-load method. Components in the four main system are selected and the influence of the sound source protection devices on sound propagation is investigated by tests. Noise control devices are designed to eliminate the airflow noise and proved valid. The effective measurement range can be changed through adjusting microphone distance. According to the test results of a multi-chamber perforated resonator on the developed bench, acoustic performance of resonators is affected by airflow at high Mach numbers.
References
-
Walt D. C. V. D. Measurement technique to assess the acoustic properties of a resonator component for transient engine conditions. Journal of Sound and Vibration, Vol. 243, Issue 5, 2001, p. 797-821.
-
Byrne K., Skeen M., Byrne K., et al. Measurement of the sound transmission loss of a small expansion chamber muffler to consider the effects of mean flow and wall compliance. Proceedings of Acoustics, New Zealand, 2006.
-
Zhenglin J. Acoustic Theory and Design of Muffler. 1st Edition, Science Press, Beijing, 2015.
-
Jebasinski Rolf, et al. Investigations on whistle noise in automotive exhaust system mufflers. SAE Technical Paper 2005-01-2361, 2005.
-
Falin Z., Dehua L., Yuping Z. Effects of higher order mode waves on muffler performance. In: International conference on optoelectronics and image processing. International Conference on Optoelectronics and Image Processing, 2010.
-
Bodén H., Ǻbom M. Influence of errors on the two‐microphone method for measuring acoustic properties in ducts. The Journal of the Acoustical Society of America, Vol. 79, Issue 2, 1986, p. 541-549.
About this article
This work was supported by National Natural Science Foundation of China (Grant No. 51975413).

