Abstract
The ore body has a great influence on the stability of surrounding rock and mining safety under different mining modes, and the reasonable selection of mining mode depends on other characteristics, such as ore structure surface feature, rock mass mechanical property, and ground stress distribution. Given the insufficient mining research data, this study establishes a 3D model by using the FLAC3D calculation program. Through numerical simulation and other technical means, a preliminary study on plastic and minimum stress changes during horizontal pillar mining, stress changes under different mining modes, and the effect comparison of full filling mining modes is conducted. Results show that the surrounding rock at the corner of pillar 1 is damaged, the plastic zone decreases, and the minimum stress in each working procedure increases slightly. The area of the plastic zone in alternate mining is smaller to that in continuous mining. This study provides a theoretical basis for ore body mining.
Highlights
- Hoke and Brown criteria are used to calculate various mechanical parameters of rock mass.
- FLAC3D is used to simulate different mining methods.
- Comparing various simulation results synthetically, the efficient and safe mining mode is obtained.
1. Introduction
In underground ore body mining, the mining method plays an important role in the stability of the stope structure and ground pressure control. However, with the gradual mining of ore body, the horizontal pillar with a thin plate structure may cause accidents due to instability [1]. Therefore, the analysis and evaluation of mining methods of ore bodies can provide an improved reference for this type of mine.
Domestic and foreign researchers have conducted numerous studies on mining methods and the stability of stopes [2, 3]. At present, the mining methods of metal ore bodies include continuous mining technology, filling mining technology, VCR (Vertical Crater Retreat Method) technology, and caving mining technology [4-6]. For example, T. M. Ermekovtakes [7] mine engineering obtains the key parts of pillar instability in the goaf and then analyzes the goaf stability. Zhao et al. [8-10], used FLAC3D numerical simulation technology on the basis of the optimization of the mining scheme in Dajishan Tungsten Mine. They obtained the alternative and one mining schemes, which are further conducive to stope stability and can improve the stope production capacity. Zuo et al. [11],by studying the deformation and failure characteristics of rock under different mining conditions, the transition of brittleness and ductility of surrounding rock is closely related to the axial loading rate, which is related to the mining method of coal seam, and the more confining pressure Large, plastic features are more obvious. The present research selects the middle section (section 417) of a mine in Jiangxi as the content and combines on-site monitoring, theoretical discussion, and numerical simulation to analyze the stability of the stope structure under different mining methods to provide reference for complex ore body mining.
2. Influence of stope structural parameters on stability
The design of the stope structural parameters in room-pillar mining is mainly the size design of the room and pillar. In the design process, numerical simulation is generally used to perform comprehensive analysis, and the appropriate mining model is adopted to analyze the response of the surrounding rock and ore body in the design of different structural parameters, along with the structural and failure characteristics of the rock mass, the distribution of the 3D in-situ stress field, and the characteristics of the dominant structural plane of the stope [12, 13]. The rationality of the structural parameters is evaluated in accordance with the mechanical response of the rock mass.
2.1. Model parameters
The reasonable selection of parameters is a necessary condition for correct modeling. The samples used in laboratory tests are obtained in situ, which can further reflect the mechanical properties of the main occurrence lithology in the mining area. The sample integrity is high, and few evident cracks are observed. Meanwhile, the rock mass is a heterogeneous, nonlinear structure with weak structural planes, such as cracks [14]. Therefore, the direct simulation of the mechanical parameters of a rock block may cause a large deviation and does not have a good simulation effect. Therefore, the model parameters should be reduced to some extent [15]. In the theoretical research of strength reduction, the initial empirical formula is expressed as follows:
Then, in 1980, Sun Guangzhong [21] proposed a strength judgment basis based on field tests, which can further reflect the structural effect of a rock mass. The criteria are as follows:
where σ is uniaxial compressive strength of rock blocks; MPa, σm is in-situ strength of rock mass; MPa, A, β are rock mass constants; N – number of structural bodies contained in rock blocks.
In 1992, Hoke and Brown [16] proposed an improved empirical formula:
Among them, σ1and σ3 are the maximum and minimum principal stresses when rock mass yields; σci is the uniaxial compressive strength of intact rock specimens; m, s is the material constant associated with rock mass; a is a parameter related to rock integrity. The formulas for calculating m, s and a are as follows:
where mi is the material parameter of intact rock, which indicates the degree of hardness and softness of rock. The value of mi is generally 1-50; D is the influence factor of excavation, which represents the disturbance degree of rock mass, and the value is 0-1; GSI is an index of geological strength, which is determined by the rock mass structure and structural plane characteristics of engineering rock mass, and characterizes the strength characteristics of rock mass structural plane.
Hoek-Brown criterion can be expressed in the form of normal stress and shear stress and used to estimate the shear strength parameters in Mohr-Coulomb criterion [17]. The strength parameters between the two criteria have the following relations:
In the formula, σ3n=σ3max/σci, σ3max is the upper limit of the minimum principal stress under the equivalent condition, which is related to the type of engineering rock mass.
Then according to H-B criterion, the uniaxial compressive strength σc and tensile strength σt of rock mass are as follows:
The elastic modulus of rock mass is an important parameter to describe the deformation characteristics of rock mass. The modified formula of elastic modulus of rock mass after introducing disturbance coefficient D [17] is as follows:
With the in-depth understanding of the rock mass structure, relevant research is constantly updated and improved. From the initial empirical value to the later quantitative means of rock mass constants obtained by considering the two different states of a rock mass, namely, undisturbed and disturbed, the aim is to find a further scientific and reasonable relationship between the rock and rock mass mechanical parameters in theory.
On the basis of Eqs. (1-12), using the field geological survey results as the background and considering previous test results and engineering experience, the rock mechanics parameters are reduced. Table 1 lists the rock mechanics parameters applied to the FLAC3D numerical calculation.
Table 1Model mechanical parameters
Lithology | Tensile strength Σt / MPa | Bulk density | Modulus of elasticity E / GPa | Poisson ratio Υ | Internal friction angle Φ (°) | Cohesive force C / MPa |
Surrounding rock | 2.4 | 2.75 | 17.6 | 0.22 | 19.58 | 4.6 |
Ore rock | 1.36 | 2.77 | 6.36 | 0.23 | 7.66 | 10.29 |
1:4 filling body | 0.19 | 2 | 0.59 | 0.14 | 9.77 | 1.26 |
1:10 backfill | 0.05 | 2 | 0.08 | 0.07 | 13.5 | 0.24 |
2.2. Selection of failure criteria for rock mass
A large number of rock mechanics test results show that the rock mass is destroyed when the load exceeds the ultimate load, and the residual strength decreases gradually with the development of deformation in the plastic flow after the peak strength [18, 19]. The failure envelope of the Mohr-Coulomb model is the combination of the shear and tension stress yield functions. That is, in the elastic-plastic constitutive model, the material failure is mainly composed of tension and shear failures. Therefore, the Mohr–Coulomb yield criterion is adopted as the numerical model of the rock failure criterion [20]. It can be expressed as follows:
where fs is destruction coefficient, σ1 –is maximum principal stress, MPa; σ3 is minimum principal stress, MPa; c is cohesive force, MPa; φ is internal friction angle.
When fs<0, elastic deformation occurs in rock mass, and when fs>0, shear failure occurs in rock mass. Because of the low tensile strength of rock, it can be judged by more criteria of tensile strength, that is, when the load of rock mass exceeds its own peak tensile stress, tensile failure occurs.
2.3. Model selection
Combined with the mining method used in the mine, section 417 of the mine is used as the key area of this study. On the basis of the distribution law of the 3D in situ stress measurement of the pillar, the roadway direction is laid along the direction of the maximum principal stress. The size of the stope block is 25 m × 30 m × 40 m long. The stope structure parameter optimization model considers the mining of two stopes and one pillar. The disturbance range is 3 to 5 times that of the mining range. The final size of the model is 900 m long, 300 m wide, and 500 m high.
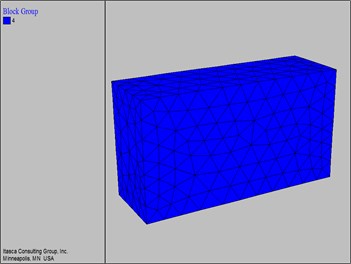
The shape of the ore body is simplified in accordance with the ore body shape map provided by the mine. Fig. 1 shows the simplified ore body model. In modeling, the geometric model of the mining area is established by CAD (Computer Aided Design), and the mesh element is divided by ANSYS. The mesh division not only meets the calculation accuracy but also controls the calculation error. Therefore, the mesh division of pillars, floor, and roof is further compact. Then, the ANSYS–FLAC3D program is used to import the model into FLAC3D to simulate and calculate the structural parameters. Fig. 1 presents the final grid model.
Fig. 1Simplified ore body shape
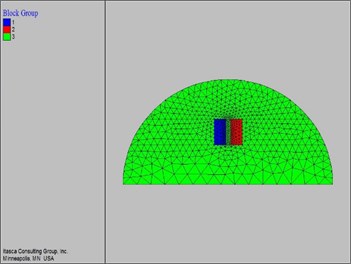
Fig. 2Grid model
3. Influence of mining sequence on structural stability
The stability of the stope structure is not only related to its own strength but also greatly influenced by mining methods and the mining sequence. A reasonable mining sequence can not only optimize the stope layout, generate high-grade ore blocks to be mined, and ensure local and overall mining volume but also help the stope structure and underground facilities maintain their stability within the mining period. Personnel work. safely in potentially unstable or high stress areas. Therefore, the reasonable mining sequence of the room and pillar is vital. The determination of the reasonable mining sequence is a repeated process, which is often realized through numerical simulation.
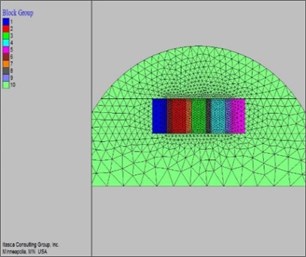
On the basis of the actual situation of the mine, the mining sequence model is divided into five chambers and four pillars, and the influence of the different mining sequences of the five chambers on structural stability is investigated. The layout of the stope is shown in Fig. 3.
Fig. 3Stope partition map
The model only considers the changes in stress and displacement caused by mining and filling and ignores the influence of mining operation on the surrounding rock. The initial stress field of the model is generated by changing the strength parameters of the elastic–plastic solution method, that is, the strength parameters of the material are set to a large value and the plastic solution is applied to avoid model damage. Then, the parameters are restored to the strength value of the material, and the initial stress field distribution is obtained by the equilibrium calculation in the second stage.
In order to ensure the reliability of the simulation, the initial stress field of the model should conform to the actual engineering environment as far as possible. According to the law of three-dimensional geostress distribution, a vertical downward uniform surface load of 11.73 MPa is applied to the upper part of the model. A pair of compressive stresses of 19.67 MPa is applied on the two sides perpendicular to the X (length) axis, and a pair of compressive stresses of 7.73 MPa are applied on the two sides perpendicular to the Y (width) axis. Fig. 4 and 5 displays the initial stress distribution nephogram of the model.
Fig. 4Initial vertical stress cloud map
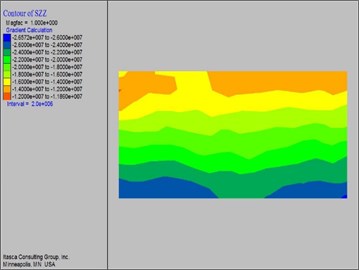
Fig. 5Initial vertical displacement cloud map
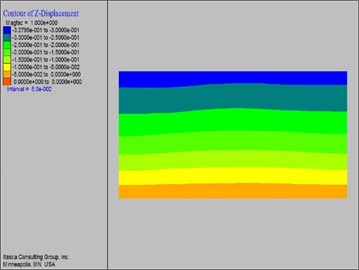
As shown in Figs.4 and 5, the initial stress and displacement nephograms have enhanced stratification. Given the irregular shape of the ore body, slight changes occur in the stratification of the stress nephogram, which is in line with reality.
The mining sequence of the room and pillar can be changed in accordance with the actual requirements of production. The room and pillar have advantages and disadvantages. Given the reduction of ore reserves, an increasing number of mines prefer to mine pillars first over ore bodies. Mining pillars first can save on the filling cost, and the economic benefit of rare metals is greatly improved. The overall steps of simulated mining are as follows:
Step 1: Mining pillars;
Step 2: Filling pillars;
Step 3: Mining the mine room;
Step 4: Filling the ore room.
3.1. Pillar mining and filling plastic zone
To reflect the mechanical response of the rock mass to mining behavior, the simulation of pillar stopping and filling is performed step by step. The order of mining and filling pillars is subdivided into the following steps:
Procedure 1: Mining pillar 1;
Procedure 2: Mining pillar 2;
Procedure 3: Mining pillar 3, filling pillar 1;
Procedure 4: Mining pillar 4, filling pillar 2;
By analogy, until the pillars are fully filled.
3.2. Change of plasticity and stress in mining
As shown in Fig. 6, after pillar 1 is mined, damaged areas appear in the surrounding rock at the corner, which is the manifestation of rock mass stress release. When pillar 2 is mined, part of the plastic area of pillar 1 decreases. When pillar 3 is mined, the plastic area of pillar 1 continues to decrease because it is filled, and the failure trend of pillar 2 is slow. Therefore, in the process of mining pillars, part of the stress is released, but it has minimal effect on the overall plastic zone and can ensure safe operation because the pillar volume is small and the surrounding rock is relatively stable.
Fig. 6Plastic zone change of mining
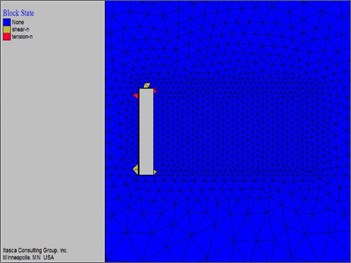
a) Procedure 1
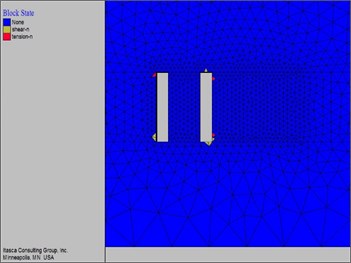
b) Procedure 2
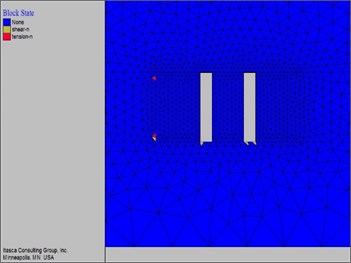
c) Procedure 3
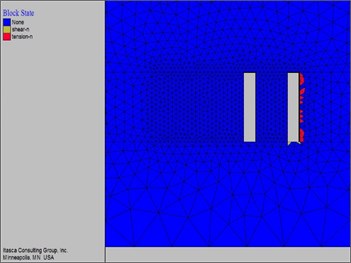
d) Procedure 4
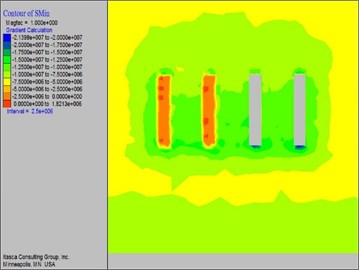
The variation of minimum principal stress in each mining procedure in Fig. 7 indicates that the mechanical response of the rock mass is similar to those of pillars 1 and 2, except for a slight change in the value of the minimum principal stress, which increases by 0.03 MPa. After the completion of processes 3 and 4, the minimum principal stress decreases due to pillar filling in the earlier stage and the partial transfer of stress. By contrast, the reduction of process 4 is great.
Fig. 7Shows the minimum principal stress change of the mining column
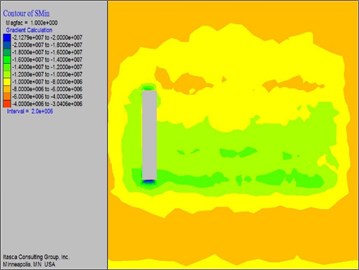
a) Procedure 1
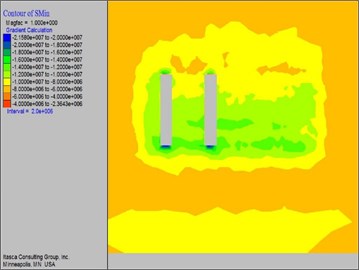
b) Procedure 2
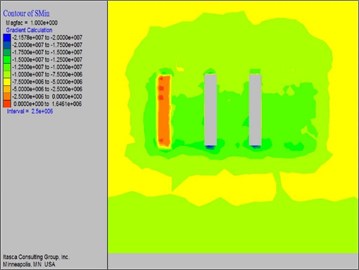
c) Procedure 3
d) Procedure 4
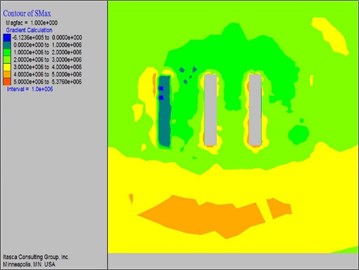
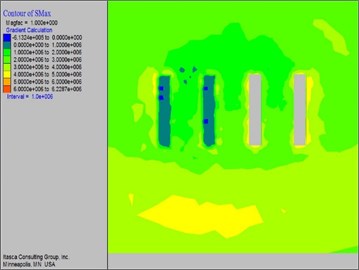
The variation law of the maximum principal stress in pillar mining states that the stress release in the mining area of each working procedure is apparent and will cause the redistribution of stress pairs. The stress release after pillar filling is restricted, and the maximum principal stress in the pillar filling area decreases. The vertical displacement variation law of each working procedure in the process of mining pillars states that the vertical displacement of the last pillar will decrease after the next pillar is finished and is mainly concentrated in the middle.
Fig. 8Maximum principal stress variation of mining pillar
c) Procedure 3
d) Procedure 4
3.3. Pillar filling and stress result
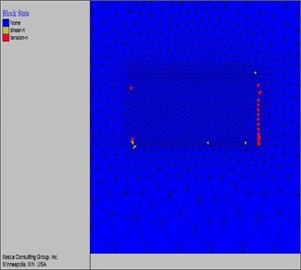
The regularity of the vertical displacement range of the cemented pillar after filling indicates that the roof shows a decline of overburden and the bottom exhibits the floor heave phenomenon. Cemented filling achieves a better filling effect in the control of stress and displacement than the previous principal stress and strain.
Fig. 9Pillar filling results
a) Distribution of plastic zone
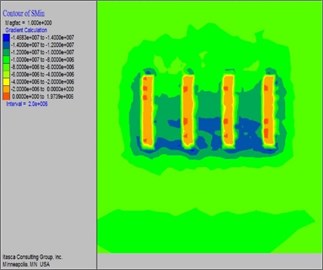
b) Minimum principal stress nephogram
4. Sequence simulation of mining room
After pillar mining and filling, studying the mechanical response of the filling body and surrounding rock to different mining sequences is helpful in understanding the influence of different mining sequences on structure stability and operation safety. The numerical simulation of the mining sequence can accurately analyze and predict the change in stress and stope displacement. After a comprehensive consideration, the optimal scheme is selected to achieve a win-win situation of security and economic benefits.
The general mining sequence includes continuous mining, one mining at intervals, three mining at intervals, symmetrical mining, and so on. Continuous mining refers to the sequential mining and filling of ore houses. One is mining and filling at intervals of one ore house. Mining and filling at intervals of three stopes means mining and filling at intervals of three stopes. Symmetrical mining is either from two sides to the middle room or from the middle to both sides of the room mining and filling. The filling mining technology mentioned above refers to the mining method of filling the goaf with filling materials while accompanying the mining, transportation and other operations. The purpose of filling is to support the two sides of the goaf rock and to create a foothold floor for continuing top slicing mining. It is suitable for ore deposits with unstable ores and surrounding rocks, which are not allowed to have large exposed surface, rare precious metals or high grade deposits. VCR technology refers to (Vertical Crater Retreat Method). The essence of this method is to drill down vertical or inclined deep holes to the bottom layer in the horizontal layer of rock drilling on the roof of the mining house by using the underground DTH drilling rig according to the optimum hole network parameters, and to use explosives with high power, high density, high detonation velocity and low sensitivity (“three high and one low explosive”) to use spherical charges (the ratio of diameter to length does not exceed 1:6) Layered blasting is carried out from bottom to top, and ore loading is carried out with efficient ore-drawing equipment (scraper). Caving mining technology is a mining method that fills the goaf with the surrounding rock of forced or natural caving, regardless of the room and pillar, in order to realize the ground pressure management of the stope. This study mainly analyzes the mechanical response of surrounding rock and cemented ore columns in two sequential mining processes through changes in stress and displacement. Combined with actual mining experience, sequential mining and alternate mining are selected as alternatives for simulating the optimization of the mining sequence.
Given that the first step of the two mining orders is the mining of room 1, the failure of the plastic zone in process 1 of the two mining orders is mainly concentrated in the corner position of the mining area. The part near the rock mass is tensile failure, whereas shear and tensile failures coexist at the corner near the cemented pillar. Then, the plastic and mechanical changes are analyzed by examining the remaining 2-5 processes.
4.1. Taking one every the other one
The specific process of mining one after another is mining room 1, mining room 3, mining room 5, filling mine 1, and so on until the goaf is fully filled.
Figure 10 shows the change process of the distribution of the plastic zone from one mining to another. The graph indicates that the plastic zone at the location of ore house 1 is mainly concentrated at the junction of the rock mass after the mining of ore house 3, but the damage scope decreases. Shear and tensile failures occur at the ends of pillars 2 and 3. After filling, the plastic zone of room 1 decreases, and a plastic zone appears around room 5 due to the stress release of the surrounding rock mass. The main failure mode is tension failure.
Fig. 10Distribution of plastic zones separated by one
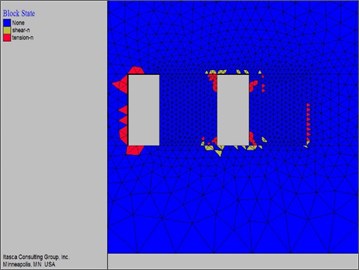
a) Procedure 2
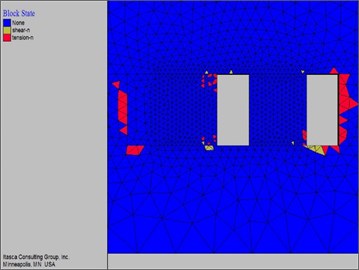
b) Procedure 3
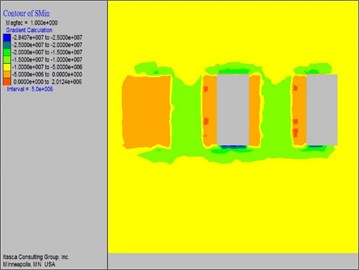
The nephogram of the distribution of the minimum principal stress of the pillar at rooms 2 and 4 in the mining process shows that the minimum principal stresses of the pillar are approximately 0.2 and 2 MPa, respectively. The maximum value of the minimum principal stress appears in the central position of the mining area, which is approximately 28.4 MPa.
Fig. 11Clouds of minimum principal stress distribution taken one every the other one
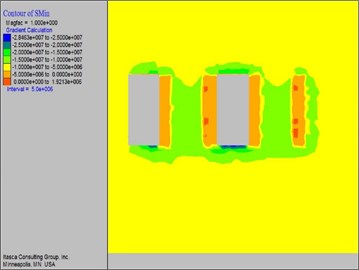
a) Procedure 2
b) Procedure 3
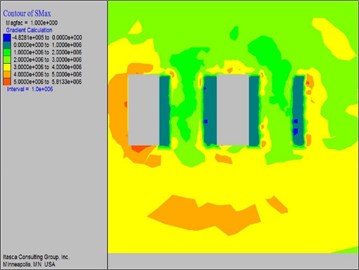
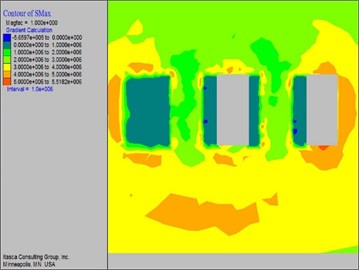
The maximum principal stress of the rock mass is approximately 5 MPa after the last room mining, which is mainly related to the distribution of ground stress and the stress release of the rock mass. The displacement change of every mining position is relatively stable in the mining process, which is approximately 25 mm. The displacement of the goaf changes to 5 mm after filling, which shows that filling has a significant effect on displacement change.
According to the max principal stress distribution map of every other mining in Fig. 12, the max principal stress of cemented pillar is in the range of 0.4-0.6 MPa, the max principal stress of room 1 before and after filling decreases by about 2 MPa, and the stress value is higher at the interface between filling body and surrounding rock mass.
Fig. 12Clouds of maximum principal stress distribution taken one every the other one
a) Procedure 2
b) Procedure 3
4.2. Continuous mining
The concrete process of sequential mining is as follows: mining room 1, mining room 2, mining room 3, filling room 1, mining room 4, filling room 2, and so on until the goaf is fully filled.
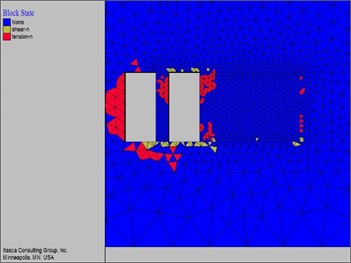
Fig. 13Distribution of plastic zone distribution in continuous mining
a) Procedure 2
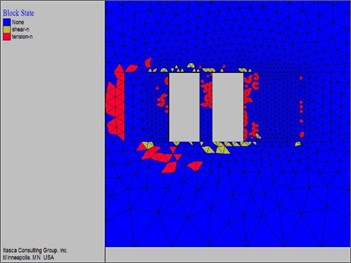
b) Procedure 3
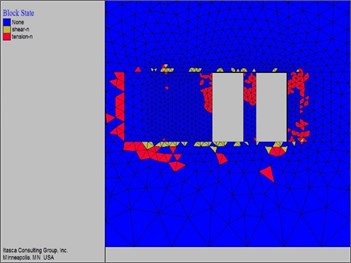
a) Procedure 4
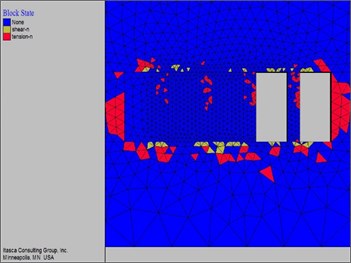
b) Procedure 5
From the change in plastic zone in the mining process, Fig. 13 shows that the stress of the surrounding rock is further released, and the plastic zone is enlarged after working procedure 2, mining room 2. At this time, cemented pillars 1 and 2 begin to bear pressure, which shows that they exhibit a tensile failure area, and the roof of the mining area has more shear failure. In process 3, room 3 is mined, and the stress release of room 4 causes the failure area of pillar 3. Given the filling of room 1, the plastic area of pillar 1 and the surrounding rock mass decrease. In process 4, mining room 4 and the stress release of room 5 destroy pillar 4 and the pre-filling room. The reason is that the filling body absorbs and transfers the energy released by the ground pressure activity. The change in plastic zone in process 5 is similar to that in process 4, and the plastic zone is further enlarged.
In comparison with process 1, the maximum principal stress in process 2 decreases, and the stress value decreases after filling the ore room in process 3. In the entire mining process, maximum vertical displacement occurs in the central part of the roof and floor. After filling, the trend of displacement change is effectively controlled.
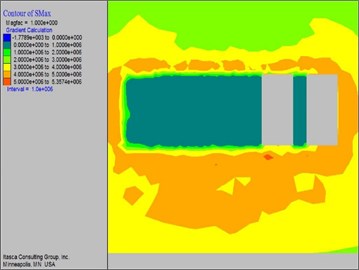
From the last two working procedures in continuous mining, we can see that the change of the maximum principal stress distribution is that after the subsequent cemented filling, the maximum principal stress in mining area decreases greatly, basically maintains in the range of 0-1 MPa, and the stress value of surrounding rock mass concentrates in the range of 3-5 MPa.
Fig. 14Maximum principal stress nephogram for continuous mining
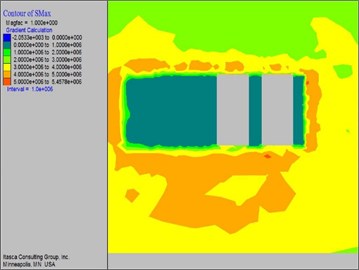
a) Procedure 4
b) Procedure 5
4.3. Contrast of filling effect
The comparison of the distribution of the full filling plastic zone in Fig. 15 indicates a small difference in the filling effect of the two mining sequences after full filling the study area. Plastic areas are greatly reduced and distributed in the edge and corner of the mining area. The main failure mode is tension failure, and some shear failure areas exist above the mining area.
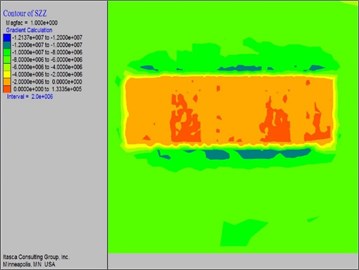
The comparison of the vertical stress nephogram of full filling in Fig. 16 shows that the vertical stress after filling in two mining sequences has approximately 0.13 MPa of tensile stress in the room area, but the tension area produced by sequential filling in one mining sequence is small. The compressive stress produced by two sequential fillings is concentrated in the roof and floor of the stope area, and the size is approximately 12 MPa.
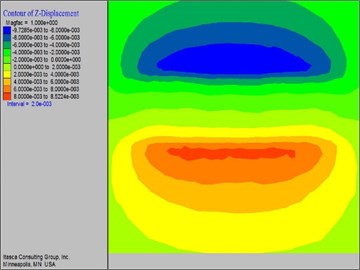
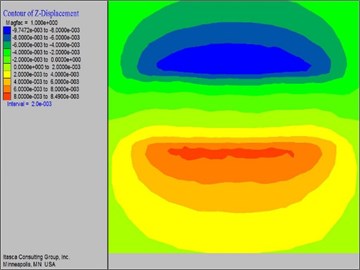
The comparison of the vertical displacement nephogram of full filling in Fig. 17 presents that the vertical displacement changes produced by the two mining orders after filling are nearly the same, the displacement range is approximately 8-10 mm, the top exhibits a negative displacement, and the bottom displays a positive displacement. The numerical simulation and pressure monitoring results, which coincide, show that although the numerical simulation has assumptions and simplification, its results are relatively accurate and reliable.
Fig. 15Comparison of the distribution of fully filled plastic zones
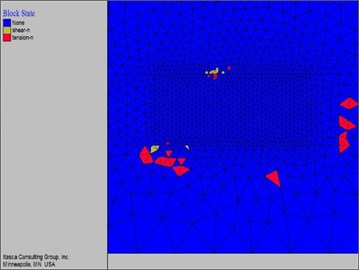
a) Continuous mining
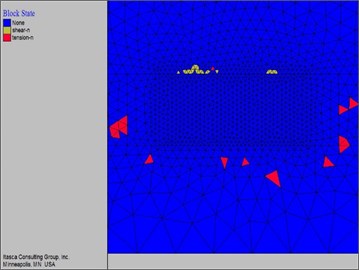
b) Taking one every the other one
Fig. 16Comparison of full filling vertical stress cloud map
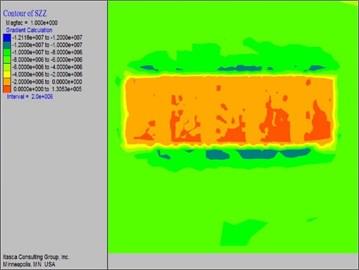
a) Continuous mining
b) Taking one every the other one
Fig. 17Comparison of full filling vertical displacement cloud map
a) Continuous mining
b) Taking one every the other one
5. Safety comparison of different mining methods for pillars
Through the simulation of the cumulative mining effect of the ore body on the pillar, the lower ore body has less influence on the disturbance of the pillar and will not pose a threat to its safety. However, after the lower pillar is mined, the pillar is in the complete filling body, and the stress concentration is high and can easily cause safety problems. A reasonable mining sequence can reduce the ore loss rate, improve the mining efficiency, and effectively control the ground pressure and stope stability. To prevent the problems caused by the further destruction of pillars, the pillars should be mined as early as possible to ensure their reasonable and safe mining, which requires a comparison of the mining methods of pillars.
Table 2Comprehensive comparison of the safety of different mining methods
Mining method | Plastic region | Minimum principal stress | Maximum principal stress | Vertical displacement | Safety |
Taking one every the other one | Minimum area | Compressive stress is small and stress concentration is obvious | Tensile stress is small and the area is small | Small displacement | Preferably |
Continuous mining | Smaller area | Compressive stress is small and stress concentration is obvious | Tensile stress is smaller and the area is small | Large displacement | Good |
Full filling and alternate mining | Smaller area | Compressive stress is small and stress concentration is obvious | Tensile stress is smaller and the area is small | Negative top displacement, positive bottom displacement. | Preferably |
Full Filling Continuous Mining | Smaller area | Compressive stress is small and stress concentration is obvious | The tension stress is small and the area is small | Negative top displacement, positive bottom displacement. | Good |
Stability comparison | Pick one at a time | The two are quite | Pick one at a time | Pick one at a time | Pick one at a time |
Comprehensive contrast | Pick one at a time | ||||
The results of the numerical simulation of different mining modes are comprehensively analyzed from five aspects, namely, plastic zone, minimum principal stress, maximum principal stress, vertical displacement, and full filling comparison, to obtain the safest mining mode and provide a basis for the safe and efficient mining of deep pillars.
The structural stability of cemented backfill is determined by the combined action of stress concentration factor, plastic zone range and stress value. From the above research, it can be seen that the plastic zones of continuous mining and alternate mining are quite different, and the plastic zones of continuous mining are more widely distributed, which may be due to the relatively slow stress concentration of rock mass in alternate mining sequence. The specific information of the mechanical response of the two mining orders is compared in Table 3.
Table 3 can be used to compare the maximum principal stress range, the maximum vertical displacement and the variation range of the vertical stress between mining and continuous mining.
Table 3Mechanical response analysis of mining sequence
Mining method | Maximum principal stress range | Maximum vertical displacement | Vertical stress range |
Continuous mining | 3-5 MPa | 32.6 mm | 0-15.7 MPa |
Taking one every the other one mining | 0-5 MPa | 25 mm | 0-14 MPa |
6. Conclusions
1) Through pillar mining and stress changes, the stress release in the mining area of each process is apparent, which will cause the redistribution of stress pairs. After the next pillar is finished, the vertical displacement of the last pillar will decrease, mainly concentrating in the middle. After pillar stoping and filling, the plastic area of the stoping area decreases after filling the cemented pillar, and the minimum principal stress of the cemented pillar is approximately 0.5 MPa. The change in vertical displacement of the cemented pillars after filling is reflected by the overburden decline at the roof and the floor heave phenomenon at the bottom.
2) The change in plastic zone is the smallest under alternate and one mining modes, and the main failure mode is tension failure. The minimum principal stress of the pillar is approximately 0.2 MPa, and that of rooms 2 and 4 is approximately 2 MPa. The maximum value of the minimum principal stress appears in the central position of the mining area, which is approximately 28.4 MPa.
3) Under the continuous mining mode, the change in plastic zone is small, which is manifested by the tensile stress failure of the cemented pillar and the shear failure of the roof in the mining area. The main change in minimum principal stress is the small compressive stress and the evident stress concentration. The plastic zone of the simulation results is mainly characterized by tensile failure, which is consistent with the results of laboratory tests and verifies the reliability of the numerical simulation results.
4) The comparison of the filling effect of the two mining methods shows that the change in plastic zone is greatly reduced and distributed in the edge and corner of the mining area. The main failure mode is tension failure, and some shear failure areas exist above the mining area. The change in force indicates an approximately 0.13 MPa tensile stress in the room area, but the tension area produced by sequential filling after mining is small. A small difference exists between the vertical displacements of the two mining sequences after filling. The displacement range is approximately 8-10 mm, the top is a negative displacement, and the bottom is a positive displacement.
5) The selection of mining sequence mainly considers such factors as construction conditions, economic benefits and ground pressure control effect. It can be seen from the foregoing that there is no obvious difference between the initial conditions and filling effect of the two orders, but the plastic zone, vertical displacement and vertical stress of continuous mining change more widely in the mining process. Under the similar filling effect, the sequence of alternate mining can better ensure the stability and safety of the working environment and engineering structure in the construction process. Moreover, according to engineering experience, the production capacity of stope can be effectively improved by alternate mining, and more considerable economic benefits can be produced under similar ground pressure control effect. Considering various factors comprehensively, it is suggested that the mining sequence of one mining interval should be selected in mine production.
References
-
Cao Ping, Liu Taoying, Pu Chengzhi Crack propagation and coalescence of brittle rock-like specimens with pre-existing cracks in compression. Engineering Geology, Vol. 187, 2015, p. 113-121.
-
Zhao K., Zhao K., Shi L. Collapsing height prediction of overburden rockmass at metal mine based on dimensional analysis. Rock and Soil Mechanics, Vol. 36, 2015, p. 2021-2026.
-
Shahriyar Heidarzadeh, Ali Saeidi, Alain Rouleau Evaluation of the effect of geometrical parameters on stope probability of failure in the open stoping method using numerical modeling. International Journal of Mining Science and Technology, Vol. 29, Issue 3, 2019, p. 399-408.
-
Zhao K., Yan H. B., Feng X., Wang X., Zhang J., Zhao K. stability analysis of pillar based on energy law. Chinese Journal of Theoretical and Applied Mechanics, Vol. 48, Issue 4, 2016, p. 976-983.
-
Ma F., Zhao H. J., Guo J., Li K. Study on the influence of mining in the middle and upper sections of Jinchuan No.2 Mining Area on surface rock movement. Journal of Engineering Geology, Vol. 22, Issue 4, 2014, p. 757-764.
-
Szott Wiesław, Valim Małgorzata Słota, Gołąbek Andrzej, Sowiżdżał Krzysztof, Łętkowski Piotr Numerical studies of improved methane drainage technologies by stimulating coal seams in multi-seam mining layouts. International Journal of Rock Mechanics and Mining Sciences, Vol. 108, 2018, p. 157-168.
-
Ermekov T. M., Iskakov S. S., Kayupov M. N. Effect of a worked-out ore deposit on the stressed state and strength of interchamber pillars. Journal of Mining Science, Vol. 25, Issue 2, 1989, p. 117-124.
-
Zhao K., Gu S. J., Yan Y. J., Li Q. Rock mechanics characteristics test and optimization of high efficiency mining in Dajishan tungsten mine. Geofluids, Vol. 2018, 2018, p. 8036540.
-
Zhao K., Liu W. F., Zeng P., Zhang L. Optimum selection of deep route parameters based on game theory combined weighted TOPSIS method. Nonferrous Metals Science and Engineering, Vol. 9, Issue 2, 2018, p. 70-74.
-
Malan D. F., Napier J. A. L. Rockburst support in shallow-dipping tabular stopes at great depth. International Journal of Rock Mechanics and Mining Sciences, Vol. 112, 2018, p. 302-312.
-
Zuo J. P., Liu L. F., Zhou H. W., Huang Y. M. Deformation and failure characteristics of rock under different mining conditions and comparative analysis. Journal of China Coal Society, 2013, p. 1319-1324.
-
Li S. W., Gao M. Z., Yang X. J., Zhang R., Li R., Zhang Z. P., Guo L., Zhang Z. T., Jing X. Numerical simulation of spatial distributions of mining-induced stress and fracture fields for three coal mining layouts. Journal of Rock Mechanics and Geotechnical Engineering, Vol. 10, Issue 5, 2018, p. 907-913.
-
Zhao K., Zhao H. Y., Zhang J. P., Wang X. J., Zhao K. Supporting mechanism and effect of artificial pillars in a deep metal mine. Soils and Rocks, Vol. 39, Issue 2, 2016, p. 149-156.
-
Atsushi Sainoki, Mitri Hani S. Quantitative analysis with plastic strain indicators to estimate damage induced by fault-slip. Journal of Rock Mechanics and Geotechnical Engineering, Vol. 10, Issue 1, 2018, p. 1-10.
-
Bieniawski Z. T. Estimating the strength of rock materials. Journal- South African Institute of Mining and Metallurgy, Vol. 74, Issue 8, 1974, p. 312-320.
-
Hoek E., Wood D., Shah S. A modified Hoek-Brown criterion for jointed rock mases. Proceedings of the Rock Characterization, Symposium of ISRM, London, 1992, p. 209-214.
-
Ramamurthy T. A geo-engineering classification for rocks and rock masses. International Journal of Rock Mechanics and Mining Sciences, Vol. 4, 2004, p. 89-101.
-
Zhao K., Wang Q., Gu S. J., Zhou K. P., Zhu S. T., Li Q., Zhao K. Research on acoustic emission characteristics of tantalum–niobium ore tailings backfill under uniaxial compression and Brazilian test. JOM, 2019, https://doi.org/10.1007/s11837-019-03497-6
-
Zhao K., Li Q., Yan Y. J., Zhou K. P., Gu S. J., Zhu S. T. Numerical calculation analysis of structural stability of cemented fill in different lime-sand ratio and concentration conditions. Advances in Civil Engineering, Vol. 2018, 2018, p. 1260787.
-
Baotang Shen, Jingyu Shi, Nick Barton An approximate nonlinear modified Mohr-Coulomb shear strength criterion with critical state for intact rocks. Journal of Rock Mechanics and Geotechnical Engineering, Vol. 10, Issue 4, 2018, p. 645-652.
-
Sun G. Z. Structural Mechanics of Rock Mass. Science Press, 1988.
About this article
The study has been supported by the National Natural Science Foundation (No. 51764013), by China Postdoctoral Science Foundation funded project (Grant No. 2019M652277), by Natural Science Youth Foundation Key Projects of Jiangxi Province of China (Grant No. 20192ACBL21014), by Jiangxi Province Postdoctoral Science Foundation funded project (Grant No. 2018KY356).
Kang Zhao conceived of the study and Xiang Yu helped draft the manuscript. Shuijie Gu collected and analysed the data. Xiang Yu constructed the models and wrote the manuscript. Yanjing Yan helped perform the analysis with constructive discussions. Yongjun Zhang reviewed the manuscript and put forward some suggestions for revision of the article. Tianyuan Suo and Jiaolong Hao made some supplements to the revised article. All authors gave final approval for publication.

