Abstract
Mathews stability graphic method, based on the rock classification system, measures the stability of the ore roof area of a relatively simple calculation method and provides a theoretical basis for mine rational design stope structure size parameters. In this study, we used a large-scale tungsten mine in Jiangxi Province as the engineering background and performed on-site engineering geological surveys and indoor ore rock mechanics tests in the middle section of mine 417 to obtain multiple engineering quality indicators for the mines and surrounding rocks. The Mathews stability map method and Barton limit span theory were used. The reasonable size range of the exposed face of the stope was calculated by performing theoretical analysis on the ultimate span. Then, FLAC3D calculation and analysis software were used for the simulation of the stope structure, and the most reasonable design of the exposed surface dimension was selected and used as reference for ensuring the safe production of the mine.
Highlights
- The hydraulic radius S mine calculated by the Mathews stability diagram method is 4.5.
- The limit span of the stope calculated by Barton limit span theory is 19.35.
- Overlay movement was monitored using the FLCD3D simulation.
1. Introduction
In the mine empty field mining method, the ore recovery rate increases when the exposed area of the stope is large; thus, this method provides economic benefits to the mining enterprise; however, the safety hazard of the mine also increases [1]. Therefore, designers must consider the safety factor according to the specific surrounding rock condition of a mine and design an optimal exposed surface size on the basis of production safety [2]. Ground pressure is affected by multiple factors because geological conditions in mines are complex and variable [3, 4]. Therefore, calculating optimal exposed areas by using pure theoretical formula is complicated and difficult. The Mathews stability diagram method [5] combined with Barton limit span theory [6] provides a means for effectively analyzing the exposed area of a stope.
FLAC3D has a wide range of applications and has 11 elastoplastic constitutive models and five calculation modes, which can be applied in any combination to simulate soil, rock mass, or other materials. Switching between different models can simulate the engineering behavior of a site [7]. The empty element model can be used to simulate the excavation of an ore body. When combined with the corresponding calculation model, the failure criterion [8] in the Mohr-Coulomb model is compatible with the elastoplastic material properties of rock and can effectively analyze the progressive failure instability and the geotechnical problems of simulating large deformation. Therefore, after calculating the reasonable exposed area of the stope by Mathews stable graph method, FLAC3D calculation and analysis software can be used for the simulation calculation, and the most reasonable exposed area design scheme can be selected.
2. Introduction to the Mathews stable graph method
The Mathews stability diagram method is often used in engineering because of its concise and practical. It is based on a large number of engineering practice experiences by Mathews et al. according to a stability factor N and a shape factor S (the shape factor refers to the ratio between an excavation surface area and the perimeter of an exposed surface). The method is mainly applied to the optimization design of the structural parameters of a stope, and the quantitative control and stability analysis of the surrounding rock parameters of a goaf are carried out. The stability coefficient N indicates the ability of the surrounding rock of a mine to maintain the stability of the mine’s stope structure under certain stress conditions. The shape factor (hydraulic radius) S reflects the shape and size of the exposed surface of a goaf. Potvin et al. developed a stability map with three regions, namely, stable, potential unstable, and caving zones as partitioning intervals based on predecessors. After the stability coefficient N is calculated, it can be stabilized against a graph. The area selects a reasonable shape factor S.
2.1. Stability factor N
The stability coefficient N is calculated as follows [9]:
where Q' is the classification index value of the modified NGI rock mass excavation quality classification method; A is the stress coefficient; B is the adjustment coefficient of the joints of rock mass, which reflects the difference between the orientation of the surface to be analyzed and the orientation of the key discontinuous joint surface; C is the gravity adjustment coefficient, which reflects the influence of the exposed surface of the roof of the stope or the occurrence of the upper surface on the stability of the stope rock under the action of gravity.
2.1.1. Modified NGI rock mass excavation quality classification index value
Barton et al. [10] proposed a tunnel excavation quality classification method for NGI rock masses based on the analysis of more than 200 tunnel engineering examples in 1974. The classification index value Q is calculated by the following formula:
where RQD is the rock quality index; Jn is the number of joints of the rock mass; Jr is the joint roughness coefficient of rock mass; Ja is the joint erosion coefficient of rock mass; Jw is the water reduction factor of rock mass joint fissure; Sf is the stress reduction factor. The amended NGI rock mass quality index is the Q value calculated by Eq. (2), and Jw and Sf are set to 1. The other parameters are unchanged.
2.1.2. Stress coefficient
A is the stress coefficient, which is linear with the ratio of the uniaxial compressive strength σc and the induced compressive stress σ1 of the intact rock mass. Its value range is A= 0.1 when σc/σ1 < 2, A= 0.1σc/σ1 when 2 < σc/σ1 < 10, and A= 1 when 10 < σc/σ1.
The σc value can be measured by the mechanical testing of the rock. The value of σ1 can be calculated by simulation using elastic finite element analysis software. When the σ1 obtained by the analysis result is tensile stress, A= 1 is considered.
2.1.3. Joint production adjustment factor
To determine the value of the coefficient B, the best main joint orientation must initially be determined for continuity by measuring the difference between the inclination of the scene and the inclination of the main joint group, and then selecting the B value according to Fig. 1.
Fig. 1Graphical explanation of joint adjustment factor B
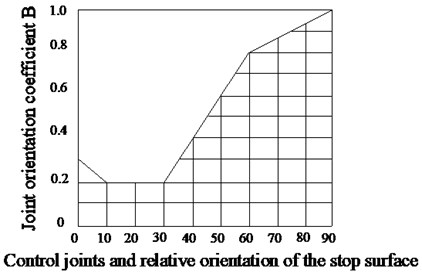
When the stability of the exposed surface of the goaf is specifically analyzed, the other joint groups, which are most unfavorable for the stability of the exposed surface, should also be analyzed if the position and orientation of the main joint group is favorable for the stability of the exposed surface.
2.1.4. Gravity adjustment factor
The gravity adjustment coefficient reflects the influence of the exposure of the stope on the stability of the side wall of the stope. Barton et al. [10] suggested that, for the same exposed surface of rock mass, the stability of the vertical side wall is approximately five times higher than the stability of the roof. They also recommended that the excavation support coefficient of permanent mine potholes is 1.6. If a partial drop and pits that are not accessible to the person exist, then the stability of the upright side wall is considered to be more than eight times the stability of the horizontal top plate. When the exposed surface angle of the goaf is horizontal, the gravity adjustment coefficient C is considered1, and the exposed surface C value of the other inclination angles can be calculated as follows:
2.2. Stope exposed area shape factor
The exposed surface of any downhole stop can consist of two different lengths, namely, length and width. The exposed surface can be pursued as a rectangle, and the ratio of the area of the rectangle to the circumference is the shape factor S. When the ratio of the length to width of the exposed surface exceeds 4:1, the value of the shape factor S remains basically unchanged, and the stability of the exposed surface is mainly affected by the size of the one-way span.
2.3. Stope design
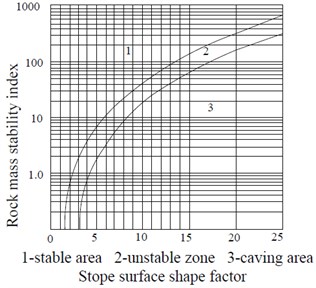
The range of the shape factor S is selected with reference to the stability map modified by Potvin [11], according to the calculated stability index N, and a reasonable size of the stop surface is designed. The stability chart is shown in Fig. 2.
Fig. 2Potvin revised stability chart
3. Application of Mathews stable graph method
3.1. Overview of engineering geology
A large-scale tungsten mine in Jiangxi Province located in the Julian Mountains bordering Guangdong and Jiangxi is used as the study area. The mining area is in the valley topography, and its highest elevation peak is 1043 m. The mining area has mainly slope quaternary modern products, and its eluvium and alluvium are located in the northwest end flap of Gukeng large anticline that plunges to the southwest direction. The rock strata direction in the area varies with the site structure. Most of the folds are in the northeast–southwest and near north–south directions, and the inclination and trend are remarkably changed. A large number of faults, joints, and fractures are found in the rock formation, which becomes a space for deformation and compression. The middle part of the mining area is mainly distributed in the structural development zone and weathered layer. Many cracks and fragments are found in the rock mass structure due to the influence of structural development and high degree of weathering. The rock mass structure is partially muddy and its bearing capacity is low.
3.2. Calculating the hydraulic radius using the Mathews stable graph method
3.2.1. Amended calculation of NGI rock mass quality index
The RQD value is calculated according to the measured data of the core obtained from the underground roadway. The RQD calculation formula is as follows:
The value is calculated based on field sampling (Fig. 3) RQD= 77 %.
According to the mine engineering geological survey report, the middle production has five sets of joints. Table 1 shows the number of joints (Jn), description, and weight table of the Barton Q classification [12], where, Jn is 15.
The main type of structural plane is tectonic, which is relatively dry and flat with less filler. Table 2 shows the Barton Q classification of joint roughness coefficient (Jr), description, and weight table, where Jr is 1.
The joint wall of the rock mass structure plane of the tungsten ore production is in close contact, hard, softened, unfilled, and impervious. Table 3 shows the Barton Q classification of algorithm alteration coefficient (Ja), description, and weight table [12], where Ja is 0.75.
Fig. 3Downhole drilling core
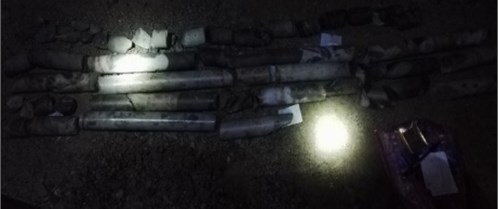
Table 1Number of joints, description, and weight table
Parameters and detailed classification | Weight | |
Serial number | Joint condition | Jn |
A | Integral rock mass with a small amount of joints or no joints | 0.5-1.0 |
B | A set of joints | 2 |
C | A set of joints and a mix of messy joints | 3 |
D | Two sets of joints | 4 |
E | Two sets of joints and mixed messy joints | 6 |
F | Three sets of joints | 9 |
G | Three sets of joints and mixed messy joints | 12 |
H | Four sets of joints or four or more sets of joints, randomly distributed specially developed joints, the rock mass is divided into “sweet sugar” blocks, etc. | 15 |
I | Crushed rock, mud | 20 |
Table 2Roughness coefficient, description, and weight table
Parameters and detailed classification | Weight | |
Serial number | Joint conditions: a) the joint wall is in full contact; b) the joint surface is in contact before the shear creep 10 cm | Jr |
A | Discontinuous wavy joint | 0.5-1.0 |
B | Rough or irregular wavy joints | 2 |
C | Smooth wavy joint | 3 |
D | Wavy joint with scratches | 4 |
E | Rough irregular joint | 6 |
F | Rough and irregular planar joint | 9 |
G | Three sets of joints and mixed messy joints | 12 |
H | Four sets of joints or more than four sets of joints, and randomly distributed specially developed joints, the rock mass is divided into “square sugar” blocks, etc. | 15 |
I | Crushed rock, mud | 20 |
Table 3Joint erosion coefficient description and weight table
Parameters and detailed classification | Weight | |
Serial number | Joint alteration conditions: the joint wall is completely closed | Ja |
A | The joint wall is in close contact, hard, softened, filled, impervious | 0.75 |
B | Joint wall alteration, only pollutants on the surface | 1.0 |
C | Mild alteration of joint walls, no soft mineral cover, gravel and disintegrated rock without clay | 2.0 |
D | Contains silty or sandy clay cover and a small amount of clay fine sand “non-softened” | 3.0 |
E | Contains clay mineral coverings with low softening or low friction, such as kaolin and mica. It can be green mud, talc and graphite, as well as a small amount of swelling clay | 4.0 |
Substituting these parameters into Eq. (2), the amended NGI rock mass quality index of the mine is Q= 6.84.
3.2.2. Stope stress coefficient
The σc in the stress coefficient A is the uniaxial compressive strength of the intact rock. An σc value of 166.99 MPa is obtained through the indoor experiment. The mining experience reveals that the plastic zone is mainly concentrated in the middle and corner of the mining area. A large number of rock mechanics test results show that the rock mass breaks after the load exceeds the ultimate load. In the plastic flow after the peak strength, the residual strength gradually decreases with the development of deformation. When fs < 0, the rock mass produces elastic deformation, and fs > 0 indicates that the rock mass has shear damage. The tensile failure occurs when the load of the rock body exceeds its own peak tensile stress, according to the tensile strength criterion, because the tensile strength of the rock is low. These changes are caused by stress release and stress redistribution of rock mass in mining. Thus, the induced stress is tensile stress, and A= 1 when σ1 is tensile stress.
3.2.3. Determining azimuth correction coefficient B of rock mass defect
Using DIPS software, a structural plane tendency and a dip rose diagram are drawn, as shown in Fig. 4.
Fig. 4Tendency and inclination rose chart of middle section 417
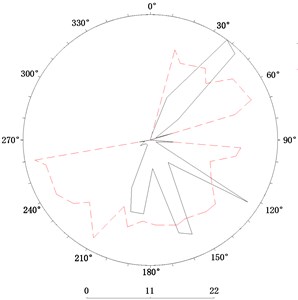
After statistical analysis, the results are shown in Table 4, according to the data of the dominant structural surface obtained according to Fig. 4. B is considered 0.86, according to the diagram of the joint orientation coefficient B (Fig. 1).
Table 4Advantage structure plane statistical analysis results table
Structural surface properties | Metamorphic rock in the middle of 417 |
Tendency | 172 |
Inclination | 69 |
3.2.4. Exposure plane orientation correction factor
The correction factor C= 1 given that the exposed surface of the mine is a horizontal exposed surface.
3.2.5. Calculating the stability factor N
These calculation parameters are substituted into Eq. (1):
3.2.6. Determining the hydraulic radius (shape factor) S
The stability map modified by Potvin (Fig. 2) obtained S= 4.5.
3.3. Stope limit span size design
Barton et al. [6] considered that the roadway support ratio of the excavation body has a certain relationship with the Q value of the rock mass. Thus, they set a parameter (De) to quantify this relationship, referred as the underground excavation body equivalent size. Its expression is as follows:
The excavation body can maintain a stable equivalent size without support and is related to the quality index of the rock mass, which is divided into nine categories according to the Q value. The relationship of various rock masses with underground excavation equivalent size (De) is shown in Fig. 5
Fig. 5Relationship between the maximum equivalent size and quality index of unsupported underground excavation
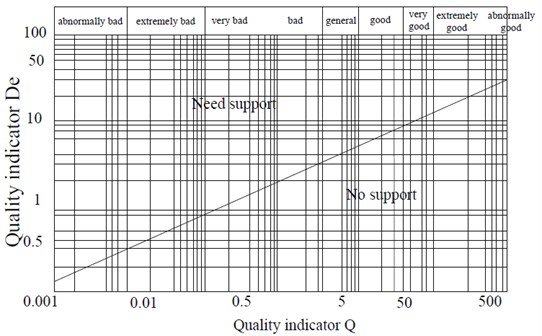
An intrinsic relationship exists between the maximum unsupported span of the underground excavation body and the equivalent size De and the support ratio ESR of the excavation body. The expression is as follows:
According to the quality index of the mine rock, the Eq. (2) is Q= 6.84. Fig. 5 shows that De= 4.3. Substitute: SPAN= 19.35.
3.4. Calculating the exposed area size
The research group calculated the hydraulic radius at different stope sizes (span by length) based on the preliminary design combined with the ore body characteristics, according to the definition of hydraulic radius (Table 5). The table shows that when the span is less than 10 meters, the exposed surface is stable and safe according to the determined stable hydraulic radius of 4.5. When the span is above 10 m, it is limited by the limit span. To ensure the stability of the stope, the size of the stope structure can be selected from Table 5.
Table 5Hydraulic radius of the roof under different stope size conditions
Size | Parameter | ||||||
Stop size | 3×10 | 3×20 | 3×30 | 3×40 | 3×50 | 3×60 | 3×70 |
Hydraulic radius | 1.15 | 1.30 | 1.36 | 1.40 | 1.42 | 1.43 | 1.44 |
Stop size | 6×10 | 6×20 | 6×30 | 6×40 | 6×50 | 6×60 | 6×70 |
Hydraulic radius | 1.88 | 2.31 | 2.50 | 2.61 | 2.68 | 2.73 | 2..78 |
Stop size | 9×10 | 9×20 | 9×30 | 9×40 | 9×50 | 9×60 | 9×70 |
Hydraulic radius | 2.37 | 3.10 | 3.46 | 3.67 | 3.81 | 3.91 | 3.99 |
Stop size | 10×10 | 10×20 | 10×30 | 10×40 | 10×50 | 10×60 | 10×70 |
Hydraulic radius | 2.5 | 3.33 | 3.75 | 4 | 4.17 | 4.28 | 3.375 |
Stop size | 12×10 | 12×20 | 12×30 | 12×40 | – | – | – |
Hydraulic radius | 2.73 | 3.75 | 4.29 | 4.62 | – | – | – |
Stop size | 15×10 | 15×20 | 15×30 | – | – | – | – |
Hydraulic radius | 3.00 | 4.29 | 5.00 | – | – | – | – |
Stop size | 18×10 | 18×20 | – | – | – | – | – |
Hydraulic radius | 3.21 | 4.74 | – | – | – | – | – |
Stop size | 19×10 | – | – | – | – | – | – |
Hydraulic radius | 3.28 | – | – | – | – | – | – |
Stop size | 20×10 | – | – | – | – | – | – |
Hydraulic radius | 3.33 | – | – | – | – | – | – |
Stop size | 21×10 | – | – | – | – | – | – |
Hydraulic radius | 3.39 | – | – | – | – | – | – |
4. Numerical simulation calculation analysis
4.1. Design parameters of stope structure
Under the same mining engineering geological conditions, the stress distribution state and displacement of the surrounding rock greatly vary according to stope structure design. Therefore, the structure parameters of the stope are directly related to the stability of the stope and the mining progress. Under the same mining conditions, selecting reasonable stopway structure parameters helps ensure the stability of the stope and increase mining speed [13-15]. This simulation intends to compare and analyze the selected nugget parameters from the ore-rock stress variation characteristics after mining to obtain the most suitable nugget structural parameters for mining. The middle section of 417 is a gently inclined thick ore body, and the ore body nuggets are vertically oriented. The stope is 50 m long and 50 m high. The simulation is based on the actual situation of the mine in the range of the exposed area with the limit span of less than 19.35 m and the hydraulic radius of less than 4.5 according to the calculation results in Table 5. Three schemes are selected and designed as shown in Table 6.
Table 6Simulation scheme of stope structure parameters of gently inclined thick ore body
– | Room/pillars (m) | Hydraulic radius (m) |
Program one | 16/14 | 3.73 |
Program two | 14/12 | 3.23 |
Program three | 12/10 | 2.72 |
4.2. Model establishment
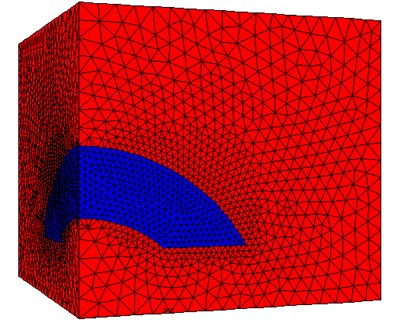
Factors, such as the distribution characteristics of the ore body and surrounding rock and the inclination angle of the rock formation, should be fully considered when establishing the model. Therefore, the model is designed as a gently inclined thick ore body (length×width×height = 265×265×235), and the nugget model is divided into 26,620 nodes and 150,568 units. The measured ground stress is applied to the model based on the ground stress measurement results of the middle section of the tungsten mine 417, and the displacement boundary conditions are applied to the periphery and the bottom surface of the model to constrain the normal displacement. The model mesh is shown in Fig. 6.
Fig. 6Gently inclined thick ore body calculation model
The rock mass mechanical parameters, constitutive models, and boundary conditions greatly influence the credibility and accuracy of numerical calculation results [16-18]. Therefore, the shortcomings caused by human assumptions can be prevented by basing a model design on the physical and mechanical properties of the ore and surrounding rock of the mine being studied and on the test results. The test results are reduced, considering the size effect of the test piece and the environment in which the surrounding rock is located. The main rock mass mechanical parameters obtained after the treatment are shown in Table 7.
Table 7Mine rock physical and mechanical parameters
Lithology | Tensile strength σt / MPa | Volume weight | Elastic modulus E / GPa | Poisson’s ratio υ | Internal friction angle φ(°) | Cohesion C / MPa |
Surrounding rocks | 2.4 | 2.75 | 17.6 | 0.22 | 19.58 | 4.6 |
Ore rock | 1.36 | 2.77 | 6.36 | 0.23 | 7.66 | 10.29 |
1:4 filling body | 0.31 | 2 | 0.58 | 0.31 | 14.70 | 0.72 |
1:10 filling bod | 0.03 | 2 | 0.06 | 0.36 | 7.91 | 0.15 |
4.3. Mining sequence and monitoring point arrangement
In the simulation calculation of frequency, the mining of the nuggets is carried out from the cutting through at 10 m per step to be as close as possible to the actual operation. The mining is divided, and the filling is carried out immediately after the mining of the pillar is completed; then, the mining room is opened. The number of computer iteration steps is determined.
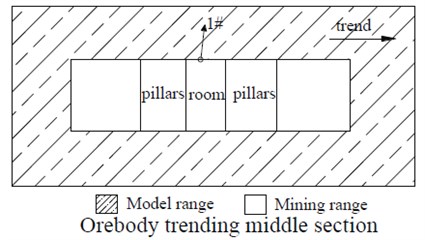
For the convenience of research and analysis, the monitoring points are arranged at key positions in the calculation model for the monitoring of the changes in the stress and deformation of ores and surrounding rocks with the mining of the ore, and the three-dimensional mechanics of the ore and surrounding rock during the mining process are recorded. The calculation model is arranged with a monitoring point at the top plate. As shown in Fig. 7, the first monitoring point is located on the roof slate, and the displacement of the roof is monitored.
Fig. 7Model monitoring point layout diagram
4.4. Structural parameter optimization
4.4.1. Comparative analysis of deformation characteristics of ore rock
During the ore mining process, the initial stress balance system of the surrounding rock is destroyed as the ore body is continuously extracted, and the exposed area of the roof of the stope continuously increases. In this case, the surrounding rock must be rebalanced by the deformation of the rock mass under the action of its internal unbalanced stress. During this process, the stress accumulated by the surrounding rock is continuously released and transferred outward. The extremely large released or transferred stress causes excessive displacement of the rock wall, thereby causing large area of the roof to fall, resulting in underground mining safety hazards and mining depletion.
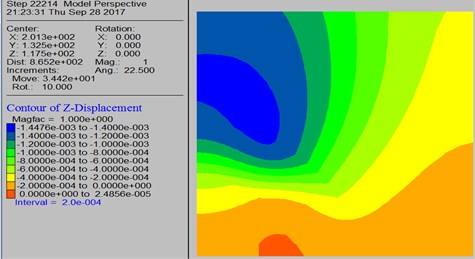
Fig. 8 shows that the general trend of the surrounding rock movement is to move from top to bottom and toward the goaf, and the displacement near the goaf is large and gradually decreases upward, whereas the lower rock body bulges. The trend of the surrounding rock migration is that the supporting role of the pillars evidently inhibits the subsidence of the overlying strata. Under the pressure of the overburden and the pressure relief of the mining back, the pillars tend to move to the two sides.
Fig. 8Post-mining ore body vertical displacement distribution
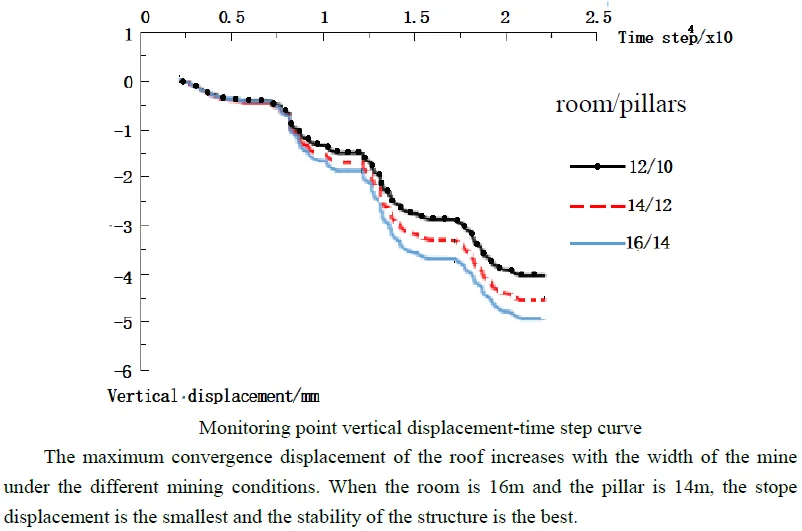
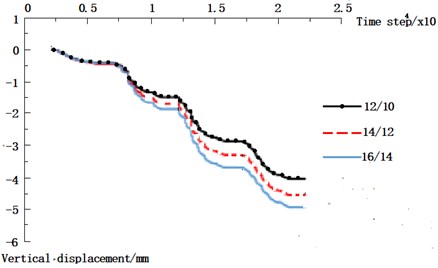
The comparison among the effects of the mining of three different width mines on the overlying strata in Fig. 9 indicates that the maximum convergence displacement of the roof increases with the width of the mine. The roof sinks mainly owing to the movement of the rock mass around the empty area to the free space under the action of its own weight and internal stress, and this phenomenon gradually extends upward. The roof subsidence is controlled, the overburden rock is relatively reduced, and the entire overburden sinking is relatively weak because of the enhanced support of the pillar and cemented backfill. The comparative results show that the support strength is gradually enhanced in the mining stage because of the main support structure of the mine and the support force of the cemented backfill. Fig. 9 shows that although the displacement of the wide column of the mine is 16 and 14 m, it is still in the stable range. The most suitable column is 16 and 14 m, considering the mining efficiency and safety.
Fig. 91# Monitoring point vertical displacement-time step curve
5. Conclusions
1) The exposed area of the roof is closely related to the limit span and the hydraulic radius. The larger the limit span is, the wider the range of exposure is within a reasonable hydraulic radius.
2) The hydraulic radius S of the middle section of mine 417 calculated by the Mathews stability diagram method is 4.5, and the limit span of the stope calculated by Barton limit span theory is 19.35. The width of the mine and the pillar are selected within a reasonable range. Three schemes of 16 and 14 m, 14 and 12 m, and 12 and 10 m are selected
3) Through the simulation of three schemes by FLAC3D, the analysis of the deformation characteristics of ore rock during the successive mining and cementation filling of the pillars and the successive mining of the mines shows that the mine width of 16 m and pillar width of 14 m are the most suitable.
4) The Mathews stability diagram method combined with limit span theory provides a simple and easy approach for establishing the numerical model of the exposed surface of a goaf in an underground mine and performing stability analysis of the mine’s stope. It is a scientific and reasonable method for calculating the roof of the ore body and provides a theoretical solution for the stable exposure dimensions and rational placement of stope structure parameters. However, when it is applied to a specific project, the results will be slightly different from the stability of real rock mass due to various geological conditions and other factors.
References
-
Zhao K., Gu S. J., Yan Y. J., Li Q. Rock mechanics characteristics test and optimization of high efficiency mining in Dajishan tungsten mine. Geofluids, Vol. 2018, 2018, p. 8036540.
-
Zhao K., Zhao K., Shi L. Collapsing height prediction of overburden rockmass at metal mine based on dimensional analysis. Rock and Soil Mechanics, Vol. 36, 2015, p. 2021-2026.
-
Cao R. H., Cao P., Lin H. Mechanical behavior of brittle rock-like specimens with pre-existing fissures under uniaxial loading: experimental studies and particle mechanics approach. Rock Mechanics and Rock Engineering, Vol. 49, 2016, p. 763-783.
-
Zhao K., Chen S., Zhao K. Meso-cracking characteristic of overburden strata material over metal mine goaf under mining process. Chinese Journal of Underground Space and Engineering, Vol. 12, 2016, p. 920-925.
-
Mawdesley C., Trueman R., Whiten W. J. Extending the Mathews stability graph for open-stope design. Mining Technology, Vol. 110, 2001, p. 27-39.
-
Smith P. F., Arnison G. T. J., Homer G. J., Lewin J. D., Alner G J., Spooner N. J. C., Shaul D. Improved dark matter limits from pulse shape discrimination in a low background sodium iodide detector at the Boulby mine. Physics Letters B, Vol. 379, 1996, p. 299-308.
-
Weng L., Luan H. X., Luan Y. A Numerical approach considering mining-induced fracture weakening and goaf compaction on surface subsidence. Geotechnical and Geological Engineering, Vol. 37, 2019, p. 283-294.
-
Labuz J. F., Zang A. Mohr-Coulomb failure criterion. Rock Mechanics and Rock Engineering, Vol. 45, 2012, p. 975-979.
-
Sunwoo C., Rao Karanam U. M. Stability assessment in wide underground mine openings by Mathews’ stability graph method. Tunnelling and Underground Space Technology, Vol. 21, 2006, p. 246-246.
-
Barton N. Some new Q-value correlation to assist in site characterization and tunnel design. International Journal of Rock Mechanics and Mining Sciences, Vol. 39, 2002, p. 185-216.
-
Grenon M., Hadjigeorgiou J. Open stope stability using 3D joint networks. Rock Mechanics and Rock Engineering, Vol. 36, 2003, p. 183-208.
-
Palmstrom A., Broch E. Use and misuse of rock mass classification systems with particular reference to the Q-system. Tunnelling and Underground Space Technology, Vol. 21, 2006, p. 575-593.
-
Zhao Y., Zhang L., Wang W., Pu C., Wan W., Tang J. Cracking and stress-strain behavior of rock-like material containing two flaws under uniaxial compression. Rock Mechanics and Rock Engineering, Vol. 49, 2016, p. 2665-2687.
-
Zhao K., Yan H. B., Feng X., Wang X. J., Zhang J. P., Zhao K. Stability analysis of pillar based on energy law. Chinese Journal of Theoretical and Applied Mechanics, Vol. 48, 2016, p. 976-983.
-
Sandanayake D. S. S., Topal E., Asad M. W. A. A heuristic approach to optimal design of an underground mine stope layout. Applied Soft Computing, Vol. 30, 2015, p. 595-603.
-
Zhang Y. F., Yuan H. P. The application of FLAC3D to the analysis of slope stability in earthquake. Journal of Jiangxi University of Science and Technology, Vol. 29, 2008, p. 23-26.
-
Chao W. Safety and environment technology development of metallic mines. Nonferrous Metals Science Engineering, Vol. 3, 2012, p. 1-7.
-
Esterhuizen G. S., Gearhart D. F., Klemetti T., Dougherty H., van Dyke M. Analysis of gateroad stability at two longwall mines based on field monitoring results and numerical model analysis. International Journal of Mining Science and Technology, Vol. 29, 2019, p. 35-43.
Cited by
About this article
The study has been supported by the National Natural Science Foundation (No. 51764013), by the Science and Technology Support Plan Project of Jiangxi Provincial Science and Technology Department (Grant No. 20161BBG70075, 20143ACG70010), by the key Research Project of Science and Technology of Jiangxi Provincial Education Department (Grant No. GJJ160592).
Kang Zhao conceived of the study and Qing Wang helped draft the manuscript. Qiang Li collected and analysed the data. Yanjing Yan constructed the models and wrote the manuscript. Xiang Yu helped perform the analysis with constructive discussions. Shuai Cao reviewed the manuscript and put forward some suggestions for revision of the article. Junqiang Wang made some supplements to the revised article. All authors gave final approval for publication.

