Abstract
The extremely changing nature of the wind action generates fatigue effects on wind sensitive structures, such as Wind Turbines (WT). Here, the wind-induced response over time of a WT tower located in Oaxaca, Mexico, is calculated considering fatigue damage. The analyses consider three main stages: time cero (at the moment of the tower installation, considering no damage), service time, considering different levels of damage at the tower’s base (corresponding to 20, 24, 30, 40 and 43 years), and time near the collapse limit state of the tower (about 47 years). In order to characterize these effects, a methodology that uses an ARMA model to simulate time-series of turbulent wind speed, and a non-lineal fatigue damage model is proposed. The structural capacity of the tower is obtained over time and details about the impact of wind-induced fatigue on the capacity of the WT are highlighted.
1. Introduction
According to the Global Wind Energy Council, in the last decades, the use of wind power has globally increased. In 2017, the global installed wind capacity has reached 539, 581 MW [1]. Only in Mexico, in 2016 the electric energy generated by wind represent about 7 % of the total national production, and an increase of the 35 % of the total electric energy has been projected to 2020 [2].
The changing nature of wind speeds makes WT extremely sensitive to fatigue effects; as result of this condition, it is important to simulate the wind velocities properly and accurately. In Wind Engineering, numerical and statistics methods have been applied to simulate wind speeds for a certain time horizon, for example: wavelet superposition, Artificial Neural Networks, hybrid methods, and time-series approach such as the Auto-Regressive Moving Average (ARMA) model [3-5].
The interaction of the wind with the blades generates important aerodynamic effects that impact on the structural capacity. Numerical methods such as the Blade Element Momentum (BEM) [6], Vorticity models [7, 8] or Computational Fluid Dynamics [9, 10] allow to simulate the wind field and obtain the wind forces that act on the blades.
Fatigue effects are usually represented by means of a damage ratio of the material. Several fatigue models have been developed to characterize it, for example: Palmgren-Miner’s rule [11], Manson bi-lineal model and its variants [12-15], Damage isolines model [16] or non-lineal fatigue damage model [17].
The structural capacity and demand are fundamental to establish inspection and maintenance periods, especially for time cumulative effects, such as fatigue. This study deals with the evaluation of the structural capacity, considering structural deterioration due to fatigue effects.
2. Objectives
The main aim is of this study is to analyze the structural capacity of a WT tower over time, considering fatigue effects at the tower’s base, taking into account different damage levels over the tower life cycle from the moment of its installation.
3. Methodology
Structural wind capacity is an important topic for design, operation and maintenance of WT. Most of the studies are focused on the blades, because these components have greater failure probability than the tower; however, the tower’s failure implies the total collapse of the entire WT.
The principal concepts used to obtain the structural capacity are:
1) Wind speeds and wind forces along the tower for a speed interval of 1 to 80 m/s at rotor’s height. The set of wind simulations are calculated here using an ARMA model, considering the Davenport’s coherence function to get the spatial and time correlation, and Kaimal Power Spectral Density (PSD) function as the target function. The wind forces that act on the tower are calculated in accordance with the International Committee for Industrial Chimneys (CICIND, for its name in French) [18].
2) Wind field simulation uses the Veers model [19] and Blade Element Momentum method to obtain the wind forces on the WT’s rotor, for the same speed interval. The BEM method includes the Glauert correction for turbulence effects on the blade’s tip.
3) Then, the fatigue analysis at the tower’s base is performed. In first place, Simple Rainflow Counting is applied on the set of stress time series to get the effective stress range and the equivalent number of cycles for each velocity. Then, wind speed scenarios are simulated fitting the probability function measured on the interest site. In addition, the hurricanes occurrence is taken into account as a Poisson process. Finally, the S-N curve of the material is established to apply the non-lineal fatigue damage model.
4) A series of Non-lineal Dynamic Analysis are carried out to get the structural capacity, considering the damage accumulation over time.
4. Illustrative case
Mexico have a great wind power potential, specially a region in Oaxaca known as La Ventosa, which has approximately 2000 MW on wind power generation and an annual mean wind speed above 7 m/s, making an excellent resource potential zone.
In this study, a representative Horizontal Axis Wind Turbine structural model installed in La Ventosa, Mexico, is analyzed. The blade characteristics where interpreted, based on the European patent EP 2 593 670 B1 [20] because of the limited amount of public information of this structures. The WT main characteristics are listed in the Table 1.
Table 1Principal characteristics of the WT analyzed [21]
Tower characteristics | Rotor characteristics | |||||
Base diameter | 4.3 | m | Number of blades | 3 | ||
Top diameter | 2.13 | m | Rated power | 2 | MW | |
Base thickness | 0.028 | m | Diameter | 84.26 | m | |
Top thickness | 0.018 | m | Rotor Height | 80 | m | |
Height | 80 | m | Rotor Weight | 149 | kN | |
Steel grade | S355 | Nacelle Weight | 513 | kN | ||
Yield stress | 355 | MPa | Blade weight (ea.) | 58 | kN | |
4.1. Wind speed simulation using ARMA model
ARMA model is constituted by two parts: The Auto-Regressive, which relates de present values with the previous ones, and the Moving Average, that relates the mean values to the white noise function. Eq. (1) shows the parameters of the ARMA model:
where is the turbulent velocities vector for a specific height, , and time, ; and are the Auto-Regressive and Moving Average order, respectively; and are the coefficient matrix for the Auto-Regressive and Moving Average model; is the white noise vector. The Spatial correlation matrix, , is determinate by the cross-spectral method, in which the Kaimal’s PSD Function, , of two different points are correlated by the coherence function, , proposed by Davenport [22]. The spatial correlation matrix and Kaimal’s PSDF are given respectively by Eqs. (2) and (3):
Wind forces on the tower are calculated according to Eq. (4), where represents air density, is the wind speed at the force direction as the sum of the mean wind speed and the turbulent part, the exposed area of the structure, and the drag coefficient for cylindrical bodies calculated in accordance with CICIND. The tower length was discretized in 80 parts to calculate the wind forces, each meter:
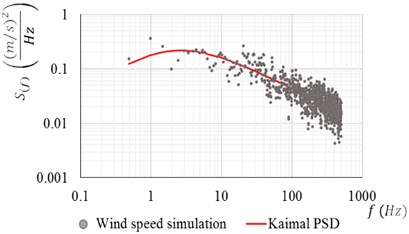
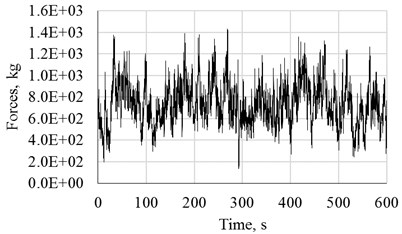
Fig. 1(a) shows a comparison of the estimated (dots) PSDF of a simulated turbulent wind record at a height of 40 m for 25 m/s, and the theoretical (solid line) PSDF. The set of numerical simulations of wind speeds were developed with the academic software SimVT Pro [23] for an averaging period of 10 minutes. Fig. 1(b) shows a typical time history of turbulent wind forces.
Fig. 1Results of the simulation: a) comparison of PSDFs, b) time history of turbulent wind forces for 25 m/s at 40 m height
a)
b)
4.2. Forces acting on the blades
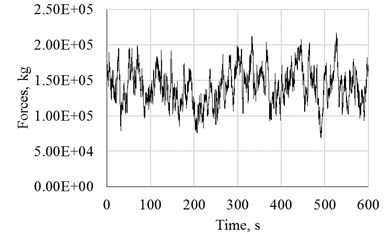
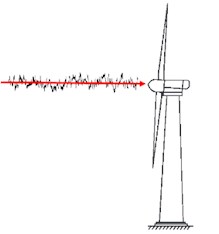
It is considered that the WT’s rotor is oriented in the principal wind direction and only the longitudinal wind component is used for the analysis. The aerodynamics effects on the blades are neglected, assuming that the total force on the rotor is concentrated at the hub position. The complete methodology can be found in [19]. Fig. 2 shows the rotor force for a 25 m/s wind speed (a), acting at the hub height (b).
Fig. 2Wind time series force for 25 m/s at hub’s height
a)
b)
4.3. Fatigue analysis
Stress time histories at the tower’s base are obtained from Transient Dynamic Analysis for each set of the complete wind speed interval, using ANSYS software [24]. In order to perform the fatigue analysis, the ASTM methodology [25] for simple Rainflow counting cycles has been implemented to obtain the effective stress and the number of cycles, corresponding to each wind speed. As an example, Fig. 3 shows the stress history corresponding to 25 m/s. The signal is equivalent to a constant stress amplitude of 1.80E+07 Pa and 302.5 cycles.
Wind speed scenarios are simulated with a probability distribution function that fits the wind speeds at the region of interest and at rotor’s height, for the WT lifetime. Jaramillo and Borja [26] have proved that the bimodal Weibull probability distribution is the best fit for the wind speeds in La Ventosa. In addition, the hurricane occurrence has been approached using historical information [27]. Fig. 4 shows the annual wind speed probability distribution.
Fig. 3Stress time series at the tower’s base plate, corresponding to 25 m/s
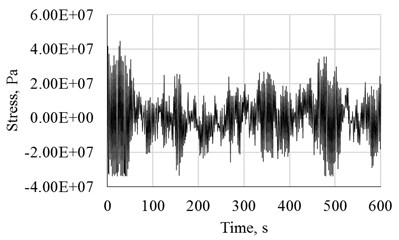
Fig. 4Annual wind speeds at La Ventosa [26]
![Annual wind speeds at La Ventosa [26]](https://static-01.extrica.com/articles/20314/20314-img6.jpg)
The fatigue analysis starts once we have: a) all the wind speeds for the entire WT lifetime, b) the effective stresses, c) the number of cycles for each wind speeds, and d) the material characteristics. The damage level is obtained with the ratio of the number of cycles and the total fatigue number of cycles for the acting wind speed. In subsequent steps, an effective number of cycles is calculated using a transfer stress factor. The complete procedure is fully detailed on [17].
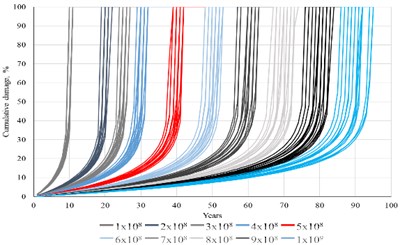
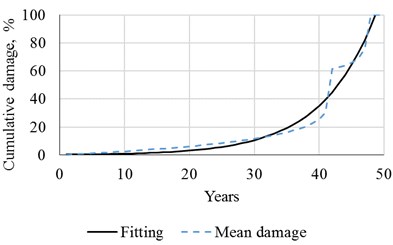
Fig. 5 shows, on the left side, the cumulative damage of the plate at the tower’s base over time, considering different cut off fatigue cycles: from 1×10⁸ to 1×10⁹. The right side of Fig. 5 shows the cumulative damage curve corresponding to the median values of the results and its fitting.
4.4. Structural capacity
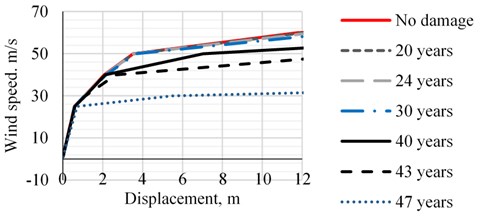
Non Linear Dynamic Analyses were performed to get the structural response for the recently installed WT and after 20, 24, 30, 40, 43 and 47 years of been installed. These years represent 3, 5, 10, 35, 50 and 80 percent of damage at the tower’s base. The structural demand parameter is the displacement at the top of the tower. For the analysis, large deflections and material non-linearity were considered.
Fig. 5Cumulative damage over the years
a)
b)
In order to simulate the loss of structural capacity, the fatigue effects were characterized with a thickness decrease of the plates. Fig. 6 shows the median values of the structural capacity for different time intervals of interest.
Fig. 6Structural capacity over the years
5. Conclusions
A methodology for the capacity evaluation of steel wind towers over time, considering deterioration due to fatigue effects, was presented. It was illustrated by the analysis of a wind tower located in La Ventosa, Oaxaca, Mexico.
The analysis results indicate that the structural capacity is not considerably affected when the structural damage is below 10 per cent. After this value, the structural capacity decreases as time increases. If an ultimate displacement of 12 m is considered, the structural capacity reduction is 15 %, 25 % and 88 % for damage levels of 35 %, 50 % and 80 %, respectively.
References
-
Global Wind Statistics. GWEC Global Wind Energy Council, 2017, http://gwec.net/wp-content/uploads/vip/GWEC_PRstats2017_EN-003_FINAL.pdf.
-
Mexican Wind Eolic Potential: Opportunities and Challenges in the New Electric Field. Mexican Association of Eolic Energy, (in Spanish).
-
Kareem A. Numerical simulation of wind effects: A probabilistic perspective. Journal of Wind Engineering and Industrial Aerodynamics, Vol. 96, 2008, p. 1472-1497.
-
Soman S. S., Zareipour H., Malik O., Mandal P. A review of wind power and wind speed forecasting methods with different time horizons. North American Power Symposium, 2010, Arlington, United States of America.
-
Samaras E., Shinozuka M., Tsurui A. ARMA representation of random processes. Journal of Engineering Mechanics, Vol. 111, Issue 1985, 3, p. 449-461.
-
Guidelines for Design of Wind Turbines. Det Norske Veritas and Wind Energy Department, Risø National Laboratory, 2002, (in Denmark).
-
Burton T., Sharpe D., Jenkins N., Bossanyi E. Wind Energy Handbook. John Wiley and Sons, 2001.
-
Branlard E. S. P., Gaunaa M. Analysis of wind turbine aerodynamics and aeroelasticity using vortex-based methods. Ph.D. dissertation, Technical University of Denmark, DTU Wind Energy, 2015.
-
Bazilevs Y., Hsu M.-C, Kiendl J., Wüchner R., Bletsinger K.-U. 3D simulation of wind turbine rotors at full scale. Part II: Fluid-structure interaction modeling with composite blades. International Journal for Numerical Methods in Fluids, Vol. 65, 2011, p. 236-253.
-
Hartwanger D., Horvat A. 3D modelling of a wind turbine using CFD. NAFEMS UK Conference Engineering Simulation: Effective Use and Best Practice, Cheltenham, United Kingdom, 2008.
-
Miller K. J., Zachariah K. P. Cumulative damage laws for fatigue crack initiation and stage I propagation. Journal of Strain Analysis, Vol. 12, 1977, p. 262-270.
-
Manson S. S., et al. Application of a Double Linear Damage Rule to Cumulative Fatigue. NASA Technical Note, 1967.
-
Manson S. S., Halford G. R. Practical implementation of the double linear damage rule and damage curve approach for treating cumulative fatigue damage. International Journal of Failure, Vol. 17, 1981, p. 169-192.
-
Hwang W., Han K. S. Cumulative damage models and multi-stress fatigue life prediction. Journal of Composite Materials, Vol. 20, 1986, p. 125-153.
-
Fatemi A., Yang L. Cumulative fatigue damage and life prediction theories: a survey of the state of the art for homogeneous materials. International Journal of Fatigue, Vol. 20, 1998, p. 9-34.
-
Rege K., Pavlou D. G. A one-parameter nonlinear fatigue damage accumulation model. International Journal of Fatigue, Vol. 98, 2017, p. 234-246.
-
Aeran A. A new nonlinear fatigue damage model based only on S-N curve. International Journal of Fatigue, Vol. 103, 2007, p. 327-341.
-
Model Code for Steel Chimneys with Commentaries. International Committee for Industrial Chimneys (CICIND), Zurich, 2000.
-
Veers P. S. Three-Dimensional Wind Simulation. Sandia National Laboratories, Albuquerque, United States of America, 1988.
-
EP 2 593 670 B1. Wind Turbine Blade with Narrow Shoulder and Relatively Thick Airfoil Profiles. European Patent Office, 2017.
-
Berny Brandt E.-A., Ruiz S. E. Reliability over time of wind turbines steel towers subjected to fatigue. Wind and Structures, Vol. 23, Issue 2016, 1, p. 75-90.
-
Davenport A. G. The spectrum of horizontal gustiness near the ground in high winds. Quarterly Journal of the Royal Meteorological Society, Vol. 87, 1961, p. 194-211.
-
Ortegón J., Pozos-Estrada A. Educational software for wind engineering applications on structures. 6th Structural Engineers World Congress, 2017.
-
ANSYS APDL. Academic Research, Canonsburg, United States, 2013.
-
ASTM E1049-85 Standard Practices for Cycle Counting in Fatigue Analysis. American Society of Testing Materials (ASTM), West Conshohocken, United States, 1997.
-
Jaramillo O. A., Borja M. A. Wind speed analysis in La Ventosa, Mexico: a bimodal probability distribution case. Renewable Energy, Vol. 29, 2004, p. 1613-1630.
-
Climatological Atlas of Tropical Cyclones in Mexico. National Center of Disaster Prevention (CENAPRED), 2014, (in Spanish).
About this article
This research had economic support from the DGAPA-UNAM under the project PAPIIT-IN103517.

