Abstract
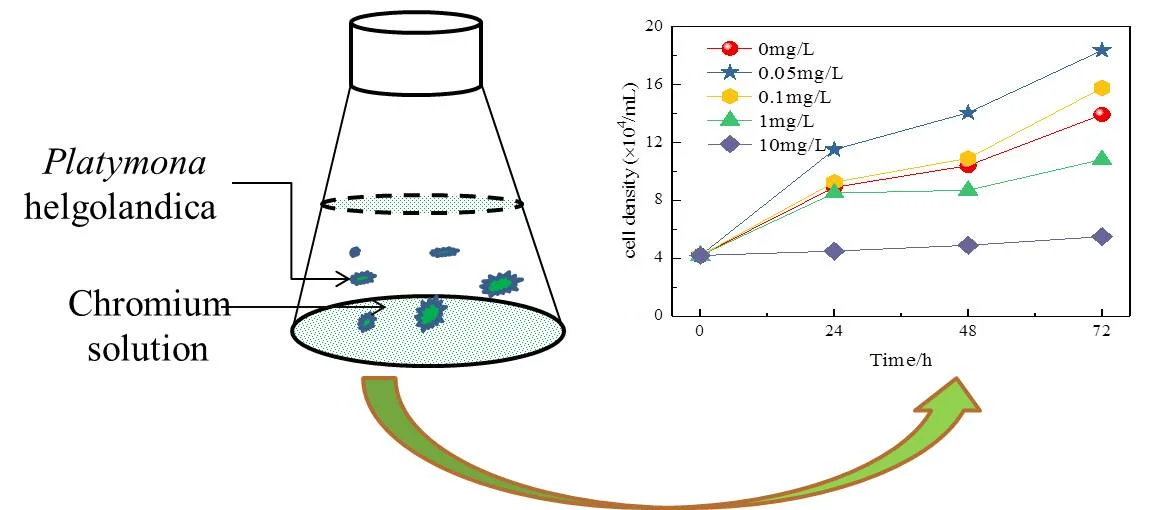
In this work, Platymonas helgolandica was used as an experimental material to study the effect of chromium on it. Under the experimental ecological condition, the concentrations of Cr (VI) were set as 0, 0.05, 0.1, 1, and 10 mg/L. Every concentration designed with three parallel groups. The ecotoxicology method was used to investigate the impact of Cr (VI) on P. helgolandica, and (EC50) was calculated by the method of linear interpolation. The results showed the growth of P. helgolandica had a more obvious “Hormesis” when chromium was 0.05 mg/L. However, with Cr (VI) increased, the inhibition on P. helgolandica was increasing, and the cell density of P. helgolandica decreased. The EC50 achieved at 24 h, 48 h, and 72 h revealed that the relative growth rate had a downward trend over time. The remodified Logistic model, the modified Gompertz model, and the Logistic model were suitable to describe cell density in an operating cycle and were beneficial to explore the growth of P. helgolandica.
Highlights
- The performance of Platymonas Helgolandica with chromium addition among 72 h was investigated.
- The relative growth rate of Platymonas Helgolandica with chromium addition among 72 h was researched.
- Kinetic analysis of Platymonas Helgolandica with chromium addition among 72 h was identified.
1. Introduction
Chromium was an element existed in nature widely. It was mainly displayed in the form of tri-valent chromium Cr (III) and six-valent chromium Cr (VI) in water environment. Cr (VI) was a clear harmful substance. It had carcinogenic and teratogenic effects and was not easy to degrade [1-3]. When the wastewater containing Cr (VI) was discharged into the water body that had a large number of aquatic plants and aquatic animals, Cr (VI) could be enriched by the food chain and played a threat to biological health [4].
Platymonas helgolandica belonged to the Chlorophyta, Chlorophyceae, Volvocales, Chlamydomonadaceae, Platymonas, and thrived in warmer and more organic water body. Moreover, Platymonas helgolandica was cultivated at home and abroad widely, eaten by larvae of marine products [5].
The promotion and inhibition of chromium on the growth of the P. helgolandica was a prerequisite for exploring the effects of heavy metals on the marine ecosystem, and it was of great significance to investigate the effects of heavy metals on the ocean in future. Therefore, the experiment took P. helgolandica as a test object. The impact of Cr (VI) with different concentration gradient on the growth of P. helgolandica was observed. The changes of cell density and relative growth rate of P. helgolandica were studied under Cr (VI) stress, in order to investigate the toxic effect of chromium on it. Besides, the remodified Logistic model, the modified Gompertz model, and the Logistic model were used to describe cell density in an operating cycle and to evaluate the growth of P. helgolandica.
2. Materials and methods
2.1. Experimental algae species and culture conditions
Experimental algae species was P. helgolandica. Cr (VI) solution was composed of potassium dichromate. The natural seawater from Qingdao was filtered through degreasing cotton, and then boiled 15 min. After cooling, nutrient solution was allocated, and f/2 nutrients formula was used for culture medium. The light intensity was 3000 lx, rhythmic light was 12 h : 12 h, the temperature was 20 ± 1 °C, and pH was 8.1-8.2.
2.2. Experimental methods
On the basis of the pre-experiment, Cr (VI) solution with different concentration gradient was set up. There were four treatment groups and one control group, every processing was repeated three times and the averaged value was reported. During exponential growth cycle, P. helgolandica was inoculated and incubated in a constant temperature incubator. After the Lugol reagent was added, the cell density was determined, and the cell density and relative growth rate of cells were calculated by blood counting chamber. In the work, the average number of cell density of mother liquid was 16.79×10⁴/mL, and the inoculation density was 4.20×10⁴/mL.
The blood counting chamber principle diagram and the image under the microscope:
Fig. 1The principle diagram and the image displayed by microscope
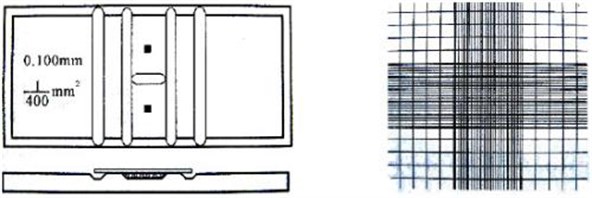
a) The blood count plate diagram and counting area schematic
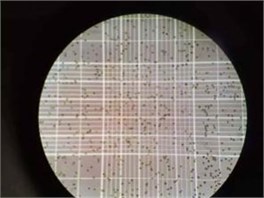
b)P. helgolandica image 10 x magnification under the microscope
The number of cells in every milliliter of medium:
where is cell number, is cell number in small square, is dilution ratio, and is number of small squares selected.
Relative growth rate of cell [6]:
where is cell density at time, mg/L, is cell density at initial density, mg/L, is culture time, h.
2.3. Kinetic analysis
The remodified Logistic model (Eq. (3)), the modified Gompertz model (Eq. (4)), and the Logistic model (Eq. (5)) were suitable to describe cell density of P. helgolandica in an operating cycle. The remodified Logistic model was the first to describe hydrogen production process in batch test [7]. The modified Gompertz model could be used to indicate the cell growth and product formation [8]. The Logistic model used to describe microbe growth curve.
The remodified Logistic model:
The modified Gompertz model:
The Logistic model:
where is cell density, (×104/mL); is maximum cell density, (×104/mL); is maximum cell growth efficiency, (×104/mL)/h; is lag time, h; is experimental time, h; is minimum cell density, (×104/mL); is time of 50 % maximum cell density, h; is exponent.
3. Experimental results and analysis
3.1. The effect of chromium on the growth of P. helgolandica
The effect of different concentrations of Cr (VI) among 72 h on cell density of P. helgolandica was shown in Fig. 2.
Fig. 2The effect of Cr (VI) on the growth of P. helgolandica
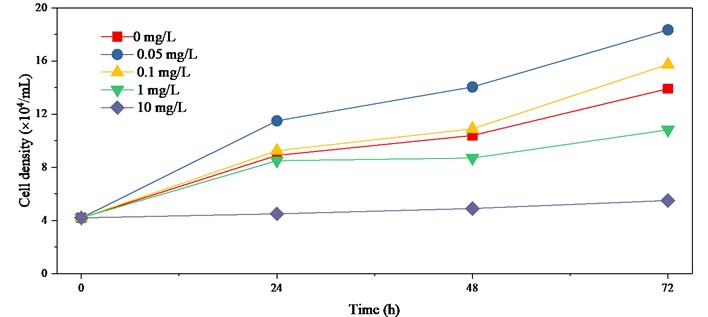
It was known from Fig. 2 that the growth of P. helgolandica showed a more obvious “Hormesis” and cell density increased at low concentration of chromium. This effect was strongest when the concentration of Cr (VI) was 0.05 mg/L. However, when the concentration of chromium exceeded 0.1 mg/L, the inhibition would present, and even threaten survival of P. helgolandica.
3.2. The effect of chromium on the relative growth rate of P. helgolandica
3.2.1. The effect of chromium on the relative growth rate of P. helgolandica in 24 h.
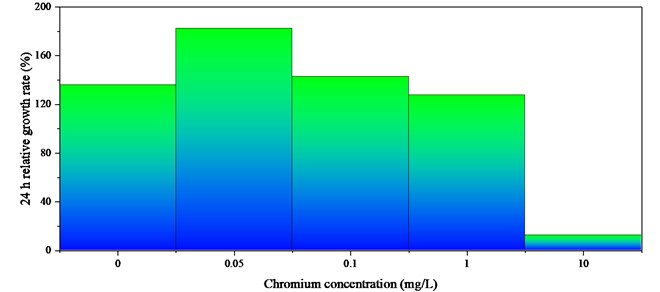
Fig.3 revealed that the relative growth of P. helgolandica increased first and then decreased with the increase of chromium concentration. When the chromium concentration was 0.05 mg/L, the relative growth rate of P. helgolandica was the highest and Cr (VI) has a significant impact on the growth of P. helgolandica. With the continuous increase of chromium concentration, the promotion weakened gradually and showed inhibitory effect. From the change of value, it could be concluded that the 24 h-EC50 of chromium to P. helgolandica was 5.18 mg/L.
Fig. 3The effect of chromium on the relative growth rate of P. helgolandica in 24 h
3.2.2. The effect of chromium on the relative growth rate of P. helgolandica in 48 h
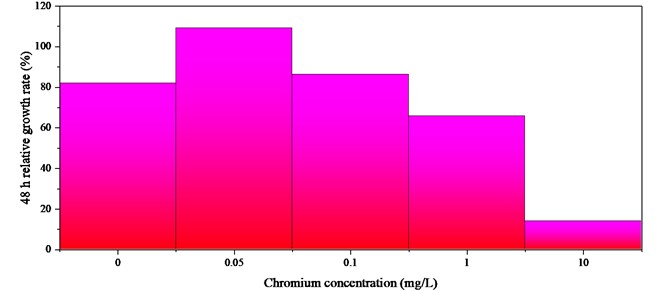
It was known from Fig. 4 that the relative growth rate of P.helgolandica showed a tendency to increase first and then decreased. When Cr (VI) concentration was 0.05 mg/L, the relative growth rate of P. helgolandica was the largest, which was 109.30 %, and chromium had an obvious promoting effect on the growth of P. helgolandica. With the continuous increase of chromium concentration, this “excitatory effect” weakened gradually and showed inhibitory effect. When chromium concentration was 10 mg/L, the relative growth rate of P. helgolandica was 13.90 %. From the change of value, it could be concluded that the 48 h-EC50 of chromium to P. helgolandica was 4.09 mg/L.
Fig. 4The effect of chromium on the relative growth rate of P. helgolandica in 48 h
3.2.3. The effect of chromium on the relative growth rate of P. helgolandica in 72 h
Fig. 5 displayed that the relative growth of P. helgolandica increased first and then decreased with increasing chromium concentration. When the Cr (VI) concentration was 0.05 mg/L, the relative growth rate of P. helgolandica was 88.90 %, and chromium has obvious promotion on the growth of P. helgolandica. When chromium concentration was 0.1 mg/L, it also had “excitatory effect”. With the increasing of chromium concentration, this promotion weakened gradually and showed inhibitory effect. From the change of value, it can be concluded that the 72 h-EC50 of chromium to P. helgolandica was 3.82 mg/L.
Fig. 5The effect of chromium on the relative growth rate of P. helgolandica in 72 h
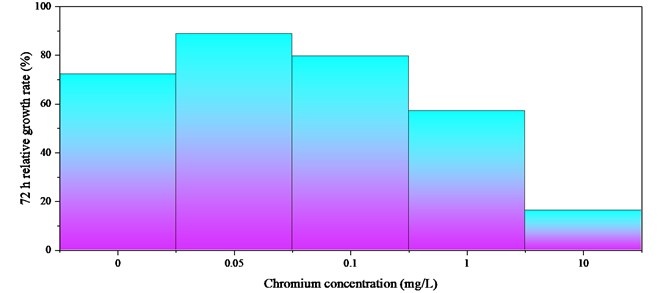
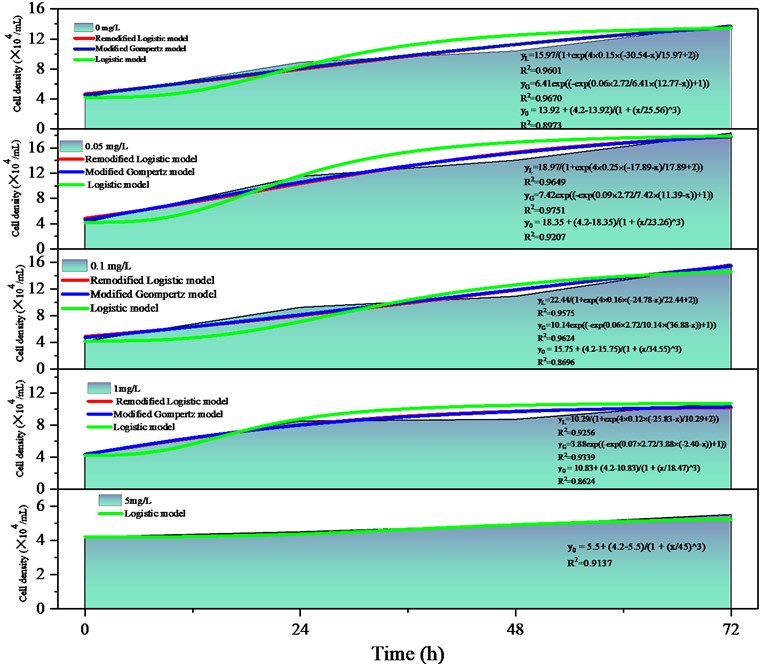
Fig. 6Kinetic analysis to cell density of P. helgolandica among 72 h was shown in Fig. 6
3.3. Kinetic analysis about cell density of P. helgolandica in an operation cycle
The effect of Cr (VI) on cell density of P. helgolandica among 72 h was shown in Fig. 6.
The cell density and kinetic features with Cr (VI) addition in an operating cycle were described by the remodified Logistic model (Eq. (3)), the modified Gompertz model (Eq. (4)) and the Logistic model (Eq. (5)). Kinetic parameters and fitting formulas were showed in Fig. 6.
Compared the parameters were obtained by three models, which all had relatively higher correlation coefficients (R2). It can be obtained by multiple fitting, and the remodified Logistic model and the modified Gompertz model were suiting to describe the changes of P. helgolandica of cell density at 0, 0.05, 0.1, and 1 mg/L. The Logistic model could describe all Cr (VI) concentrations cell density variation.
4. Discussion
4.1. The discussion of the effect of chromium on the growth of P. helgolandica
From the effects on cell density of P. helgolandica at different Cr (VI) concentrations, chromium showed a “low promotion and high inhibition” on the growth of P. helgolandica. At low concentrations of 0.05 mg/L and 0.1 mg/L, it showed a significant promotion effect compared with the control group. This phenomenon also occurred in previous studies on the toxic effect of heavy metals copper and cadmium on green algae [9]. Algae exhibited stress resistance and stimulate algal growth when disturbed by weak stresses may be a main reason. Many low concentration promotion phenomena had also been observed in some published articles [10, 11]. It indicated that the “excitatory effect” of marine microalgae caused by low concentration of heavy metals was universal.
When the P. helgolandica was treated with high Cr (VI) concentration showed inhibitory effect. When the chromium concentration was 1 mg/L, the inhibition began to be showed. With the increase of Cr (VI) concentration, the inhibition was more obvious. The cause of this phenomenon was that chromium destroyed the cell structure of P. helgolandica and destroyed its superoxide dismutase activity and the content of photosynthetic pigment, which affected photosynthesis and inhibited growth and reproduction.
4.2. The discussion of the effect of chromium on the relative growth rate of P. helgolandica
From Fig. 3, Fig. 4, and Fig. 5, it was found that when Cr (VI) concentration were 0, 0.05, 0.1, 1, and 10 mg/L, all were in the tolerance range of P. helgolandica.
EC50 was an important parameter to measure the biological toxicity of toxic substances in water, and EC50 was related to the time of exposure to toxic environment [12]. 24 h-EC50, 48 h-EC50, and 72 h-EC50 were 5.18, 4.09, and 3.82 mg/L, respectively. It was known that with the extended of contact time between P. helgolandica and chromium, the greater degree of damage to P. helgolandica.
The relative growth rate of 24 h, the relative growth rate of 48 h, and the relative growth rate of 72 h gradual declined. The cause of this phenomenon may be that the relative growth rate of P. helgolandica was affected by the exposure time, and the longer the exposure time of P. helgolandica in the toxic environment, the more bad impact. It may also be due to the growth and reproduction of P. helgolandica depleted part of the nutrient in the culture solution resulting in the lack of nutrients, which limited P. helgolandica growth and reproduction
4.3. The discussion about kinetic feature of P. helgolandica in an operation cycle
Parameters were compared obtained by three models that the remodified Logistic model (Eq. (3)), the modified Gompertz model (Eq. (4)), and the Logistic model (Eq. (5)). The modified Gompertz model owned best was 0.9596, above 0.9520 and 0.8927 provided respectively by the remodified Logistic model and the Logistic model. However, the presented by the first two models were discrepant. Comparing the differences between the experimental and the predicted values, average relative error respectively are 16.37 % and 37.31 %. Average relative error of the remodified Logistic model was only 3.38 % in 0.05 mg/L, and the modified Gompertz model was little more than 0.09 % in 1 mg/L. Suitable models were good at predicting cell density at different chromium concentrations.
The Logistic model could match all the concentration of the cell density change trend, and be able to provide the time of appearance 20 %, 50 %, and 80 % maximum cell density, predict cell density at different times. In addition, other kinetic parameters (, ) could also be deduced well by three models. In order to maximum enhancement for P. helgolandica Cr (VI) dosage had best controlled at 0.05 mg/L.
5. Conclusion
The effect of chromium on the growth of P. helgolandica was studied in the work. When the chromium concentrations were 0.5 mg/L and 0.1 mg/L, the growth of P. helgolandica showed a more obvious “excitatory effect”. However, when the chromium concentration exceeded to 1 mg/L, the inhibition appeared, and the cell density of P. helgolandica descend. Compared with the EC50 at 24 h, 48 h, and 72 h, it was discovered that the relative growth rate of P. helgolandica decreased with the extension of time. The remodified Logistic model and the modified Gompertz model were suitable for predicting , and the Logistic model be able to provide the time of appearance 20 %, 50 % and 80 % maximum cell density.
References
-
Yan W., Qunwei D., Guohua C. Cr (VI) adsorption characteristic of alga adsorbent. Journal of Environmental Engineering, Vol. 5, Issue 8, 2014, p. 2006-2010.
-
Xianlong Z., Siyang Z., Jingwei F. Preparation of nano-iron for removing Cr (VI) from wastewaters. Chinese Journal of Environmental Engineering, Vol. 9, Issue 6, 2012, p. 3167-3172.
-
Ying L., Chunqiang L., Chuanyuan T. Effects of different nutrient concentrations on the succession of 6 Marine microalgae communities. Aquatic Science, Vol. 32, Issue 11, 2013, p. 627-635.
-
Jinhua Y. Effects of anthracene on the growth of Platymonas helgolandica. Science and Technology Information, Vol. 28, Issue 6, 2011, p. 345-345.
-
Xiaogang H., Tinglin H., Xiuzhen C. Study on the application of ferrous sulfate reduction-precipitation method to the emergent treatment of sudden Cr (VI) pollution. Industrial Water Treatment, Vol. 33, Issue 6, 2013, p. 40-46.
-
Shuai M., Liang Q., Xiaogong L. Effects of four dispersants on cell density and chlorophyll contents of Platymonas helgolandica and Nitzschia closterium f. minutissima. Ecological Science, Vol. 34, Issue 6, 2015, p. 9-15.
-
Zhong W., Yongzhen P., Lei M. Continuous-flow combined process of nitritation and ANAMMOX for treatment of landfill leachate. Bioresource Technology, Vol. 214, 2016, p. 514-519.
-
Jianlong W., Wei W. Kinetic models for fermentative hydrogen production: a review. International Journal of Hydrogen Energy, Vol. 34, Issue 8, 2009, p. 3313-3323.
-
Hongwei H., Yuanyuan D., Yunfei F. Effects of artificial sweeteners on metal bioconcentration and toxicity on a green algae Scenedesmus obliquus. Chemosphere, Vol. 150, 2016, p. 285-293.
-
Qiongzhi Z., Feng L., Feng G. Nutrient removal by Chlorella vulgaris F1068 under cetyltrimethyl ammonium bromide induced hormesis. Environmental Science and Pollution Research, Vol. 23, Issue 19, 2016, p. 1-11.
-
Jiashun C., Ruixue J., Jiaqin W. Study on the interaction mechanism between cefradine and Chlamydomonas reinhardtii in water solutions under dark condition. Ecotoxicology and Environmental Safety, Vol. 159, 2018, p. 56-62.
-
Tennekes H A., Sánchez-Bayo F. The molecular basis of simple relationships between exposure concentration and toxic effects with time. Toxicology, Vol. 309, Issue 2, 2013, p. 39-51.
