Abstract
The time delayed Positive Position Feedback (PPF) controller is utilized to suppress the primary resonance of vibrations of an excited base oscillator by real power exponents of the restoring and damping forces. Multiple scales method is conducted to get the frequency response equations. The stability of the system is studied by using the Lyapunov first method. The influences of system parameters and time delay on the system response are investigated to avoid the jump phenomenon for better system performance. Time margin is deduced for most possible values of controller gain. Analytic results are verified by numerical integration of the original system equations.
1. Introduction
The restoring force related to the classical model of linear springs usually obeys Hook’s law i.e., the force needed to deform the spring is proportional to its deflection. Practically, the restoring force is a nonlinear function of the deflection because it decreases or increases more rapidly than the deflection. Usually, the function that relates the restoring force to the deflection is a polynomial with a linear term and another one with integer powers higher than unity (mainly quadratic and cubic). Many structural materials of the springs can cause this type of nonlinearity. Also, the origin of this type of nonlinearity may be geometrical or physical configurations, as in the case of a pendulum performing small vibrations, beams, cables, electrical circuits. This type of restoring force was widely studied in many scientific contributions, as was reported [1]. However, many materials whose elastic deformations cannot be exactly, described as a polynomial [2, 3]. In these materials, the force-deflection relationship includes non-integer exponents of a fractional order [2-9]. Specifically, the nonlinear materials of Ramberg-Osgood type, which have been applied to depict the elastic properties of the aircraft materials such as aluminum and titanium [4]. While, The Ramberg-Osgood equation was created to describe the nonlinear relationship between stress and strain in some metals.
Vibration isolators having nonlinearity in both stiffness and damping terms were analyzed under harmonic excitation [5] using the method of harmonic balance. Oscillators with a non-negative real-power restoring force and quadratic damping are considered [6]. The expressions for the energy displacement function as well as the closed form exact solutions for the relationship between subsequent amplitudes were derived in terms of incomplete Gamma functions. The relative and absolute displacement transmissibility of a base excited vibration isolation system were analyzed, and the performance characteristics were expressed in terms of the damping parameters [7]. Kovacic [8] studied the steady-state response of forced damped nonlinear oscillators. In the considered oscillators, the restoring force has a nonlinear term in the form of a non-integer exponent with a fractional order and a linear term. The damping term was assumed in a power form. The method of multiple scales was improved to cover the cases in which the nonlinearity is not necessarily small. Huang et al. [9] utilized the time-delayed cubic velocity feedback to improve the performance of a vibration isolation system whose restoring and damping forces are in a real-power form. They also studied the primary resonance, dynamic stability and transmissibility for this system under base excitation using the method of multiple scales. In the last decades, active control techniques have been widely used in mechanical and structural vibrations for sensing structural vibrations and delivering appropriate control forces to counteract structural motions. However, active control techniques may lead control systems to instability due to presence of time delays. The reason is that the time delays are unavoidable during the process of sensing and calculating the necessary control forces. Researchers paid a great attention to the stability analysis of delayed controlled systems [10-19]. Abdelhafez and coauthor applied positive position feedback (PPF) controller to reduce the vibrations of a forced and self-excited nonlinear beam [19]. They deduced that the time margin of the system depends on the sum of all time delays. To our knowledge, previous works didn’t apply PPF controller on systems with real-power exponents of the restoring and damping forces.
In this work, the PPF controller is utilized to suppress the primary resonance vibrations of the base excited oscillator with real-power exponents in the restoring and damping forces given [9]. This oscillator is harmonically excited on its base. The method of multiple scales is applied to get the possible resonance conditions and the amplitude-phase modulating equations. Also, the frequency response equations and the stability conditions are derived. The effects of some effective parameters on the dynamical behavior of the system will be explored. The optimal values of system parameters for avoiding the jump- phenomenon are deduced. Effects of time delays on the system response are studied extensively. It is known that, time margin is the amount of time delay that system can bear without being unstable. Time margin of the system is deduced for most possible values of controller gain and the optimal conditions for system operation are derived. Some analytical results are verified by numerical integration of the original closed-loop system equations. Finally, main results are summarized.
2. Mathematical model
The system considered here comprises of a mass M isolated from a harmonically excited base through a linear spring, a nonlinear spring composed of nonlinear materials “Ramberg-Osgood type”, and a nonlinear damper similar to that reported [7]. The equation of motion of the base is y=Ycos(Ωet) and the equation of motion of this primary system is given in [9] as follows:
where X=z-y is the relative displacement of the mass M with respect to the vibrating base, dots indicate derivative with respect to time t, α is an arbitrary positive real number, and the coefficient C1 symbolizes the corresponding damping coefficient. K1 is the coefficient of the linear stiffness. β is an arbitrary non-negative real number, and the coefficient K2 stands for the corresponding stiffness coefficient. sgn(X) and sgn(˙X) are the sign functions. Introducing the dimensionless parameters x=X/Y,τ=ω0t,Ω=Ωe/ω0,2ξ1=C1Yα-1/Mω2-α0,ω21=K1/Mω20, k=K2Yα-1/Mω20 and f=F/Mω20 yields the following dimensionless equation of motion of the system:
Utilizing the positive position feedback controller to isolate the mass M from the base vibrations yields the following system model:
where dots denote derivatives with respect to τ, ω2 is the controller mode, λ1 and λ2 are the controller gains. The block diagram of this closed loop system is presented in Fig. 1.
Fig. 1Closed loop system

3. Mathematical analysis
Applying the method of multiple time scales [20] yields a first-order approximate solution to Eqs. (3) and (4) by seeking the solution in the form:
where ε is a small dimensionless perturbation parameter, T0=τ, T1=ετ are the two time scales that represent the fast and slow times. The time derivatives are expressed in terms of T0 and T1 as follows:
For the necessity of applying the multiple time-scales method, we may scale system parameters as follows:
Substituting Eqs. (5) to (8) into Eqs. (3) and (4) and equating coefficients of the same power of ε give the following set of differential equations:
-2ˆξ1|D0x0|αsgn(D0x0)+ˆλ1y0τ1-2D0D1x0,
The general solutions of Eqs. (9) and (10) can be expressed as follows:
where A(T1), θ1(T1), B(T1) and θ2(T1) are functions of the slow time scale T1. |x0|βsgn(x0) and |D0x0|αsgn(D0x0) can be expanded by using Fourier series as follows:
|D0x0|αsgn(D0x0)=|ω1A(T1)sin(ω1T0+θ1(T1))|αsgn(-ω1A(T1)sin(ω1T0+θ1(T1))),
|x0|βsgn(x0)=|A(T1)|β(b1βcos(ω1T0+θ1(T1))+b3βcos(3ω1T0+3θ1(T1))),
where coefficients b1α, b1β, b3α and b3β are given in the Appendix. Also, x0τ2 and y0τ1 can be defined as follows:
Expanding Aτ2 and Bτ1 by using Taylor series yields:
where, prime denotes derivative with respect to T1. Substituting Eqs. (13) to (20) into Eqs. (11) and (12), we get:
+Bω2θ2'(T1)eiT0ω2+iθ2+cc,
where cc stands for complex conjugate. In this work, the primary resonance case is treated in presence of internal resonance between the system and the controller, so we have:
where σ1 and σ2 are detuning parameters used to describe the closeness of the considered resonance cases. After inserting Eq. (23) into Eqs. (21) and (22), the conditions for a bounded solution of Eqs. (21) and (22) are:
where ϕ1=εˆσ1T0-θ1=σ1t-θ1, ϕ2=εˆσ2T0-θ1+θ2=σ2t-θ1+θ2. Separating real and imaginary parts of Eqs. (24) and (25) and rescaling parameters to their original form yield the following system of autonomous differential equations:
4. Equilibrium solution and stability analysis
At steady-state oscillations, the derivatives of system states are zeros (˙A=˙ϕ1=˙B=˙ϕ2= 0). Inserting this condition into Eq. (26), we can get the following closed form equations:
We have utilized Lyapunov first method to study the stability of the equilibrium solution. So, we need to linearize Eq. (26) about the equilibrium solution A0, ϕ10, B0, and ϕ20 by using Taylor expansion to first-order. Each system state consists of its value at equilibrium plus a small perturbation as follows:
where A1, ϕ11, B1, and ϕ21 are perturbations which are small with respect to A0, ϕ10, B0, ϕ20. Linearizing Eq. (26) about the equilibrium solution as illustrated in Eq. (29) yields the following linear system of ordinary differential equations:
where coefficients rij; i,j= 1, 2, 3, 4 are given in the appendix. The solution is stable, if and only if, all eigenvalues of the Jacobian matrix of Eq. (30) have negative real parts.
5. Results and discussions
The steady-state response of both the primary system and the controller are explored in this section. The dimensionless parameters of the system are set as ω1= 1, k= 0.2, α= 3/2, β= 4/3, f= 0.1, ξ1= 0.05, ξ2= 0.1, λ1=λ2= 0.5, τ1=τ2= 0, ω2=ω1+σ2, σ1= 0, and σ2= 0, unless otherwise stated.
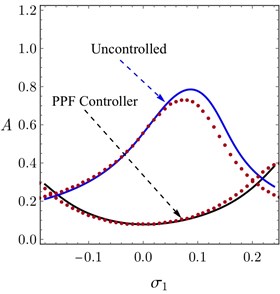
Fig. 2 presents a comparison between the FRC of the system controlled by positive position feedback (PPF) controller versus the uncontrolled system. This figure shows that the PPF Controller is very effective in reducing vibrations of the primary system under control. The solid small circles in the figure represent a numerical validation of the analytical results. Also, from the figure it could be observed that, the numerical solutions coincide with the analytical solution when |σ1| tends to zero so that, the accuracy of the analytical solution increases when the system approaches the studied resonance case. However, both of the analytical and numerical solutions are generally of same trend.
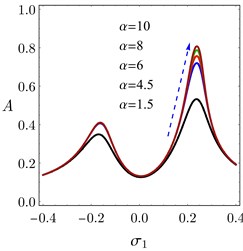
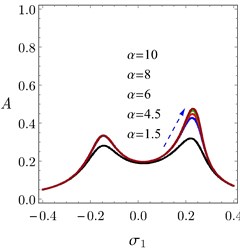
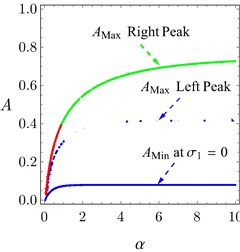
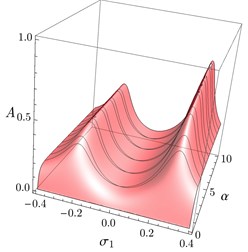
Fig. 3(a) presents the frequency response curve (FRC) of the system and the controller under different values of α. From those figures it can be observed that, increasing α leads to an increase in the peak amplitudes as indicated by the dashed arrow in them. Also, the minimum amplitude “AMin” at σ1= 0 increases slightly when α increases. The behaviors of the peak amplitudes AMin and the minimum amplitude AMin are indicated in Fig. 3(b). When the exponent of damping force  increases, the minimum amplitude of the FRC of the system increases monotonically until the value α= 1, the left peak amplitude increases monotonically until α= 4, and the right peak amplitude increases monotonically until α≃ 9. So, the FRC of the system nearly saturates after α= 9 as seen in Figs. 3(a) and 3(b).
Fig. 2Comparison between FRC of the primary system controlled by PPF controller and uncontrolled system at λ1= 0.3, λ2= 1.0 and τ1=τ2= 0.02. (Circles are indicating the numerically solution)
Solve Eqs. (27) and (28) together to get an equation in the form:
From Eq. (31) we obtain four solutions of σ1 as funntions of A. These four solutions are combined to plot the FRC. The maximum peaks are obtained by the equation σ1(A)= 0, with substitution for all parameters as constants except α. Substituting σ1(A)= 0 in Eq. (31) yields the minimum amplitudes. In this way can study the effect of any parameter on the peaks of the amplitudes of the system FRC.
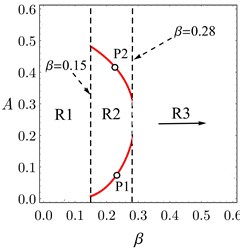
From Fig. 3 we deduced that, increasing α does not cause multi-valued solution regions or frequency-island phenomenon if PPF controller is implemented. However, variation of the restoring force exponent β can lead to multi-valued solution regions in the system response. Fig. 3(a) depicts the possible cases of the system behavior for any value of β.
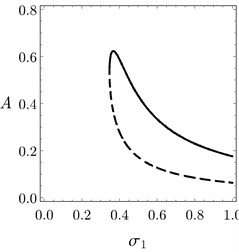
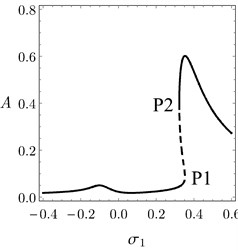
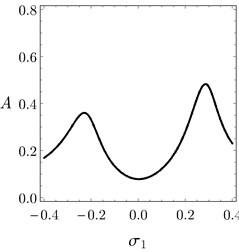
In Fig. 4(a), it is clear that there are three regions and each of these regions has a possible different case of system behavior. Fig. 4(b) presents the system behavior at β= 0.05 as a sample of the region R1. In this region, the system response is distorted which means that there is no real solution for the frequency response equations when σ1→ 0. Fig. 4(c) depicts the FRC of the system when β belongs to the region R2. In region R2, jump phenomenon occurs as shown by arrows. The FRC of the system at β= 1.5 as a sample of region R3 is presented in Fig. 4(d). For β> 0.28, there is no jump and there is a good vibration suppression bandwidth. So, R3 is the best region for system operation when controlled by the PPF controller.
Fig. 3a) FRC of the system, b) FRC of the controller, c) Maximum and minimum values of the system amplitude A against α, d) System amplitude as a function of the detuning parameter σ1 and α
a)
b)
c)
d)
Fig. 4a) Jump and no-jump regions in the system response under different values β, b) FRC of the system at β= 0.05, c) FRC of the system at β= 0.24, d) FRC of the system at β= 1.5
a)
b)
c)
d)
The equivalent natural frequency of the system can be estimated approximately from the following equation:
Fig. 5 shows the plots of the equivalent natural frequency ωa as a function of β and the system amplitude A. It can be observed that ωa increases largely for small values of A or β as indicated in the figure. This is the reason behind the bad results given by PPF controller in Fig. 4(b) (region R3).
Fig. 5Equivalent natural frequency ωa as a function of β and the system amplitude A
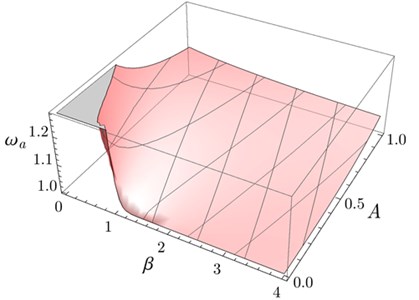
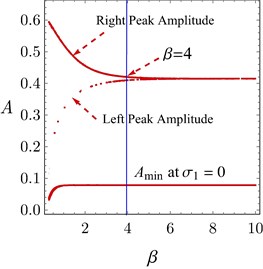
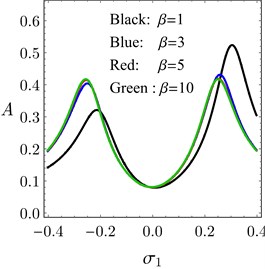
Fig. 6(a) gives us the key features of the FRC of the system when β belongs to region R3. If β≤ 4 then the right peak amplitude is larger than the left peak amplitude. The right peak amplitude becomes equal to the left peak for the values of β> 4. The minimum amplitude of the system increases monotonically as β increases until β≃ 1 and becomes constant for β> 1. Hence, Fig. 6(b) verifies the general description presented in Fig. 6(a).
Fig. 6a) General behavior of the system when β belongs to R3, b) FRC of the system for many values of β in region R3
a)
b)
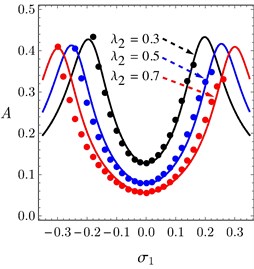
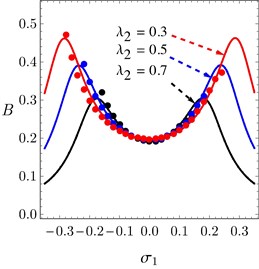
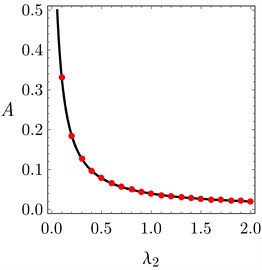
The FRC of the system and the controller are presented in Figs. 7(a) and 7(b) under different values of controller’s gain λ2. It is evident in Figs. 7(a) and 7(b) that, the vibration suppression bandwidth increases as λ2 increases. The effect of λ1 on the system performance was also tested and gave nearly the same effect of λ2. The system amplitude at σ1= 0 decreases as λ2 increases as seen in Fig. 7(c). The analytical solution is validated numerically using small circles as shown in the figure.
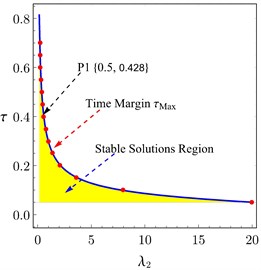
The time margin “the amount of time delay that the system can bear without being unstable” of the system decreases as λ2 increases. The relation between the time margin of the system and controller gain λ2 is explained later on. Eq. (28) shows that the system behavior depends on the quantity τ2ω1+τ1ω2, but ω1= 1 and the PPF controller is perfectly tuned i.e., ω1= 1. So, the system response and its stability are dependent on the quantity τ=τ1+τ2. Hence, τ represents the overall time-delay of the system. The following data in Table 1 of the overall time-delay τ against the controller gain λ2 can be deduced using stability criteria. The values of τ in Table 1 represent the maximum overall delay that the system can bear without being unstable at the considered values of λ2. Plotting the data in Table 1 yields Fig. 8(a). From Fig. 8(a) it could be observed that τMax “Time margin” is a decreasing function of λ2. Utilizing fitting methods yields the following formula that links τMax and λ2, such that:
Fig. 7a) FRC of the system, b) FRC of the controller under different values of λ2, c) The system amplitude A against λ2 at σ1= 0
a)
b)
c)
Table 1Time-delay τ=τ1+τ2 against the controller gain λ2 by using stability criteria
τ | 0.05 | 0.06 | 0.07 | 0.08 | 0.09 | 0.10 | 0.125 | 0.15 | 0.175 | 0.20 | 0.25 |
λ2 | 20 | 19.99 | 13.33 | 10 | 9.99 | 7.99 | 4.99 | 3.63 | 2.85 | 2.10 | 1.42 |
τ | 0.35 | 0.40 | 0.45 | 0.50 | 0.55 | 0.60 | 0.65 | 0.70 | 0.75 | 0.85 | 1.00 |
λ2 | 0.74 | 0.58 | 0.46 | 0.37 | 0.31 | 0.27 | 0.23 | 0.20 | 0.18 | 0.14 | 0.10 |
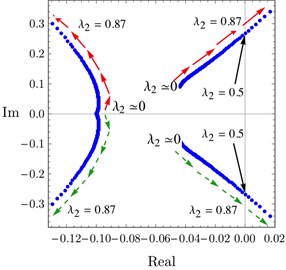
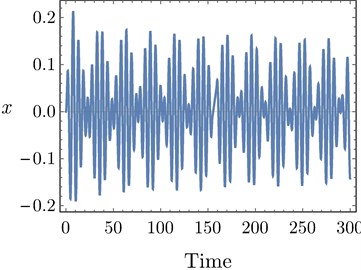
Eq. (33) is used to get the time margin of the system corresponding to any value of λ2. When λ2 increases the time margin of the system decreases. The stable solutions region of the system for all possible values of λ2 and τ is indicated by the yellow region in Fig. 8(a). Any point on the curve in Fig. 7(a) represents the time margin of the system at the corresponding value of λ2. Other values of β and α were used to obtain Fig. 8(a) and it is observed that, the same results are nearly obtained when those values increases, but the time margin and the area of stable solutions region decrease when α increases. Fig. 8(b) describes the behavior of the system eigenvalues at τ= 0.428 when λ2 changes from 0 to 0.87. A pair of eigenvalues move towards the imaginary axis when λ2 increases until intersecting it at λ2= 0.5. So, Hopf-bifurcation occurs at the point P1 in Fig. 8(a), the system vibrates by a bounded quasi-periodic motion at this point as seen in Fig. 8(e), and the system is critical stable. All points on the curve of Fig. 8(a) have the same response as the point P1. At the point P1, τ= 0.428 and λ2= 0.5, however τ=τ1+τ2 so τ= 0.428 and λ2= 0.5.
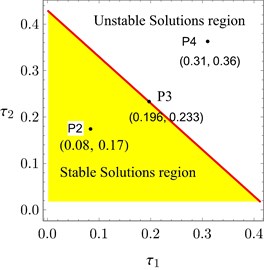
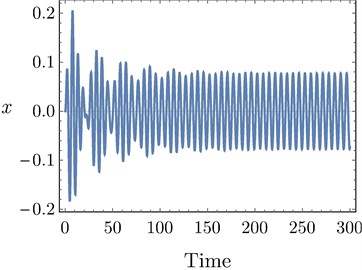
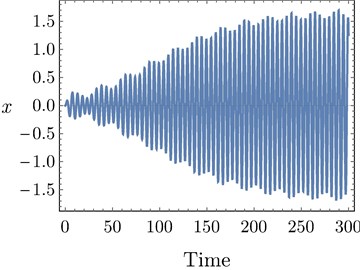
The red line in Fig. 8(c) is drawing at τ1+τ2= 0.428. So, τ= 0.428 at any point on the line plotted in Fig. 8(c). Then this line symbolizes all possible combinations of τ1 and τ2 that represent the time margin of the system at λ2= 0.5. The stable solution regions indicated in Fig. 8(a) and 8(c) are the regions at which all eigenvalues have negative real part. The points P2, P3, and P4 in Fig. 8(c) are studied in Figs. 8(d) and 8(f) to explain the possible different responses of the system. The time response depicted in Fig. 8(d) shows that the system vibrates by a stable periodic motion when τ belongs to the stable solutions region. At τ equals the time margin, the system response becomes critical stable and vibrates by a bounded quasi-periodic motion as shown in Fig. 8(e). The overall delay τ must not exceed the time margin to avoid occurrence of system instability indicated in Fig. 8(f).
Fig. 8a) The overall delay τ against controller gain λ2 at σ1= 0, b) Imaginary part of eigenvalues versus their real parts when τ= 0.428, c) The stable solutions region w.r.t. τ1 and τ2 at the point P1 in a), d) Time response of the system at the point P2 in c), e) Time response of the system at the point P3 in c), f) Time response of the system at the point P4 in (b)
a)
b)
c)
d)
e)
f)
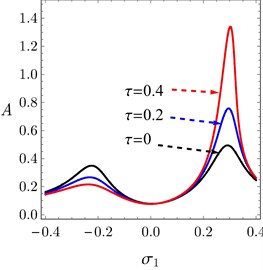
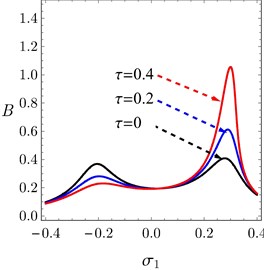
Fig. 9(a) depicts the system amplitude as a function of the external detuning parameter σ1 and the magnitude of the external force f. From this figure it can be seen that, the peak amplitudes and the minimum amplitude of the system are increasing when the value of f is increased. Also, the vibration suppression bandwidth is not affected largely by increasing f. The force response curves of the system before and after control are presented and validated numerically in Fig. 9(b) at σ1= 0. The system amplitudes after controller are very small compared to them before control as seen in Fig. 9(b).
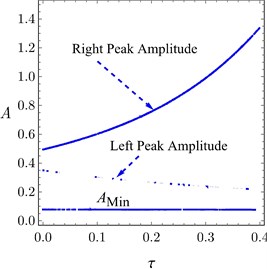
Fig. 9a) FRC of the system, b) FRC of the controller under different values of overall delay, c) Peak amplitudes and minimum amplitude of the system against overall delay
a)
b)
c)
6. Conclusions
Utilizing PPF controller Guarantees wider vibration suppression bandwidth around σ1= 0. When the exponent of damping force α increases, the smallest amplitude of the FRC of the system increases monotonically until α= 1, the left peak amplitude increases monotonically until α= 4, and the right peak amplitude increases monotonically until α≃ 9. So, the frequency response curve of the system nearly saturates after α= 9. The PPF controller reduces vibrations of the system effectively around σ1= 0 for all possible values of α as seen in Fig. 3. Increasing α does not cause multi-valued solution regions or frequency-island phenomenon. Variation of the restoring force exponent β yields three possible cases of system response as shown in Fig. 4.
The vibration suppression bandwidth increases as λ1 and/or λ2 increases. The minimum amplitude of the system decreases when λ1 and/or λ2 increases. The effects of time-delays on the system stability were studied with the deduction that, the time margin of the system depends on the sum τ1+τ2. When the overall delay of the system is small than the time margin, the system vibrates by a stable periodic motion. When the overall delay of the system equals the time margin, the system response becomes critical stable, the system vibrates by a bounded quasi-periodic, and Hopf-bifurcation occurs. The system becomes unstable when the overall delay τ exceeds the time margin. Increasing τ, within the stable solutions region, boosts the right peak amplitude, suppress the left peak amplitude and has no effect on the vibration suppression bandwidth. The system vibrations amplitudes after controller are very small if compared to their values before control.
References
-
Strogatz S. H., Shafer D. S. Nonlinear Dynamics and Chaos: With Applications to Physics, Biology, Chemistry, and Engineering. Addison-Wesley, Massachusetts, 1994.
-
Cveticanin L. L., Zukovic M. Melnikov’s criteria and chaos in systems with fractional order deflection. Journal of Sound and Vibration, Vol. 326, 2009, p. 768-779.
-
Rakaric Z., Kovacic I. Approximations for motion of the oscillators with a non-negative real-power restoring force. Journal of Sound and Vibration, Vol. 330, 2011, p. 321-336.
-
Prathap G., Varadan T. K. The inelastic large deformation of beams. Journal of Applied Mechanics, Vol. 43, Issue 4, 1976, p. 689-690.
-
Ravindra B., Mallik A. K. Performance of non-linear vibration isolators under harmonic excitation. Journal of Sound and Vibration, Vol. 170, Issue 3, 1994, p. 293-304.
-
Kovacic I., Rakaric Z. Study of oscillators with a non-negative real-power restoring force and quadratic damping. Journal of Nonlinear Dynamics, Vol. 64, 2011, p. 293-304.
-
Kovacic I. On some performance characteristics of base excited vibration isolation systems with a purely nonlinear restoring force. Journal of Non-Linear Mechanics, Vol. 65, 2014, p. 44-52.
-
Kovacic I. The method of multiple scales for forced oscillators with some real-power nonlinearities in the stiffness and damping force. Journal of Chaos, Solitons and Fractals, Vol. 44, 2011, p. 891-901.
-
Huang D., Xu W., Xie W., Liu Y. Dynamical properties of a forced vibration isolation system with real-power nonlinearities in restoring and damping forces. Journal of Nonlinear Dynamics, Vol. 81, 2015, p. 641-658.
-
Abdelhafez H. M., Osamma Omara. Controlling quarter car suspension system by proportional derivative and positive position feedback. Journal of Vibroengineering, Vol. 19, Issue 7, 2017, p. 5374-5387.
-
Nayfeh N. A., Baumann W. T. Nonlinear analysis of time-delay position feedback control of container cranes. Journal of Nonlinear Dynamics, Vol. 53, 2008, p. 75-88.
-
Jin Y., Hu H. Principal resonance of a Duffing oscillator with delayed state feedback under narrow-band random parametric excitation. Journal of Nonlinear Dynamics, Vol. 50, 2007, p. 213-227.
-
Gao X., Chen Q. Nonlinear analysis, design and vibration isolation for a bilinear system with time-delayed cubic velocity feedback. Journal of Sound and Vibration, Vol. 333, 2014, p. 1562-1576.
-
Zhao Y., Xu J. Effects of delayed feedback control on nonlinear vibration absorber system. Journal of Sound and Vibration, Vol. 308, 2007, p. 212-230.
-
Xu J., Yu P. Delay-induced bifurcations in a nonautonomous system with delayed velocity feedbacks. International Journal of Bifurcation and Chaos, Vol. 14, 2004, p. 2777-2798.
-
Ji J. C., Leung A. Y. T. Resonances of a nonlinear s.d.o.f. system with time-delays in linear feedback control. Journal of Sound and Vibration, Vol. 253, 2002, p. 985-1000.
-
Maccari A. The response of a parametrically excited van der Pol oscillator to a time delay state feedback. Journal of Nonlinear Dynamics, Vol. 26, 2001, p. 105-119.
-
Hu H., Dowell E. H., Virgin L. N. Resonances of a harmonically forced duffing oscillator with time delay state feedback. Journal of Nonlinear Dynamics, Vol. 15, 1998, p. 311-327.
-
Abdelhafez H., Nassar M. Effects of time delay on an active vibration control of a forced and Self-excited nonlinear beam. Journal of Nonlinear Dynamics, Vol. 86, 2016, p. 137-151.
-
Nayfeh A. H., Mook D. T. Nonlinear Oscillations. Wiley, 1985.

